

 Print
Print facebook
 twitter
 Linkedin
 google+

Introduction
A fetal cardiac evaluation is composed of two stages: an anatomic evaluation, in which the presence or absence of congenital heart disease (CHD) is detected by means of the sequential segmental analysis of structures, and a study of cardiac function, in which the effective contraction and relaxation of the myocardial fibers, their capacity to maintain fetal cardiac output (CO), and heart rate and rhythm are evaluated.
Currently, the procedure for anatomical evaluations of the fetal heart is well established and routinely performed by specialists in fetal cardiology. However, there is still no consensus on the technique to be used in the evaluation of cardiac function, despite its unquestionable importance [1,2]. There are some difficulties in determining the most appropriate method capable of detecting early fetal cardiac dysfunction, which is why many researchers are studying the various methods that are available [1,3]. Challenges include the movement and positioning of the fetus, the high fetal heart rate, the different architecture of fetal myocardial fibers [3] and the parallel blood circulation characteristic of fetuses, which may interfere with assessments of the heart [4].
The functional assessment of the fetal heart conveys important information regarding the hemodynamic status and cardiovascular adaptation of a fetus in the face of several perinatal complications. Numerous studies have evaluated existing echocardiographic techniques in order to improve functional assessments [2]. Information from functional assessments can be very useful for the clinical management of pregnant women with fetuses with growth restriction, hydrops fetalis, and fetal arrhythmias, as well as pregnant women with monochorionic twins or diabetes.
The cardiac cycle comprises a period of systole and diastole. With regard to fetal cardiac function, it is necessary to determine the quality of systolic and diastolic function, as well as which ventricle is more important for maintaining a good hemodynamic status in the fetus, bearing in mind that the right ventricle shows some dominance in relation to CO.
Evaluation of Systolic Function in the Fetal Heart
Systolic function in the fetal heart can be evaluated primarily through the ejection fraction (EF), shortening fraction, CO, cardiac volume, maximal displacement of the valve ring (tricuspid or mitral), myocardial performance index (MPI), and parameters derived from cardiac strain [3,5]. Systolic evaluation of the fetal heart can be performed using 1- (M-mode), 2- (2D), and 3-dimensional (3D) techniques.
EF and Shortening Fraction
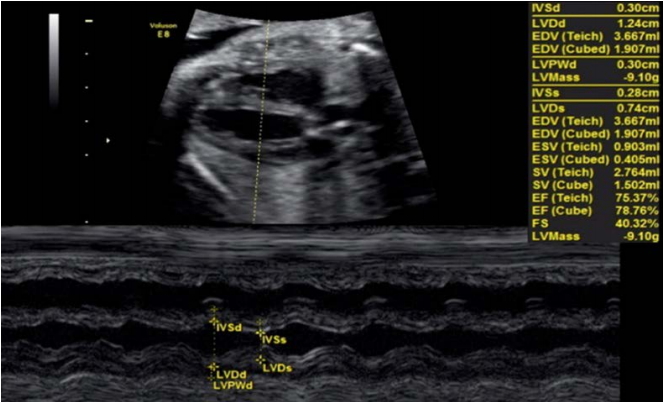
The EF and shortening fraction are criteria traditionally used in adult and child echocardiography to evaluate global radial/circumferential cardiac function [5,6]. These values are usually obtained using M-mode (1-dimensional technique) from a 2D or 3D image on the parasternal plane of the long axis (Fig. 1) or the short axis of the heart at the height of the papillary muscles of the mitral valve (MV). Measurements of the ventricle at diastole and systole are obtained, and using the relationship between these measurements, calculations are performed to determine the EF ([diastole measurement-systole measurement]/diastole) measurement and shortening fraction [3-5].
The shortening fraction is a percentage-based relationship between the dimensions of the ventricle cavity. The EF represents the ratio between ventricular volumes expressed as a percentage; therefore, when its determination requires the measurement of volume from 2D measurements, the margin of error increases. Thus, we have observed that dimension measurements may be subject to less error than measurements of the ventricular volume; this is one of the main reasons why the shortening fraction is considered to be more valuable for fetuses than the EF [6].
However, using the shortening fraction to assess the systolic function of the ventricles presents some technical difficulties in fetuses, due to difficulties in the proper alignment of the plane, higher heart rate, and fetal body movements [5,7,8]. M-mode assessment of cardiac function has the disadvantage of evaluating a single line of the cardiac plane, resulting in limitations in cases of myocardial asymmetry [3]. In addition to this technical difficulty, it should also be kept in mind that this parameter is altered only in the later phase of cardiac dysfunction, and it is necessary to use other echocardiographic techniques, such as the MPI, for the earlier diagnosis and treatment of fetuses with growth restriction, hydrops fetalis, as well as pregnant women with monochorionic twins or diabetes [2,9].
Cardiac Output and Stroke Volume
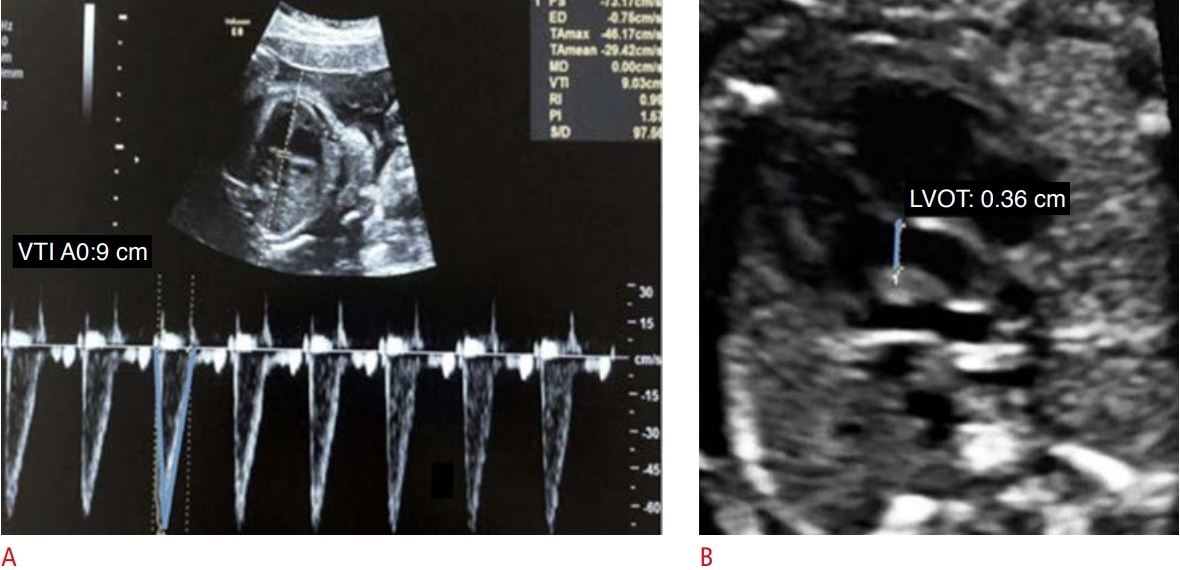
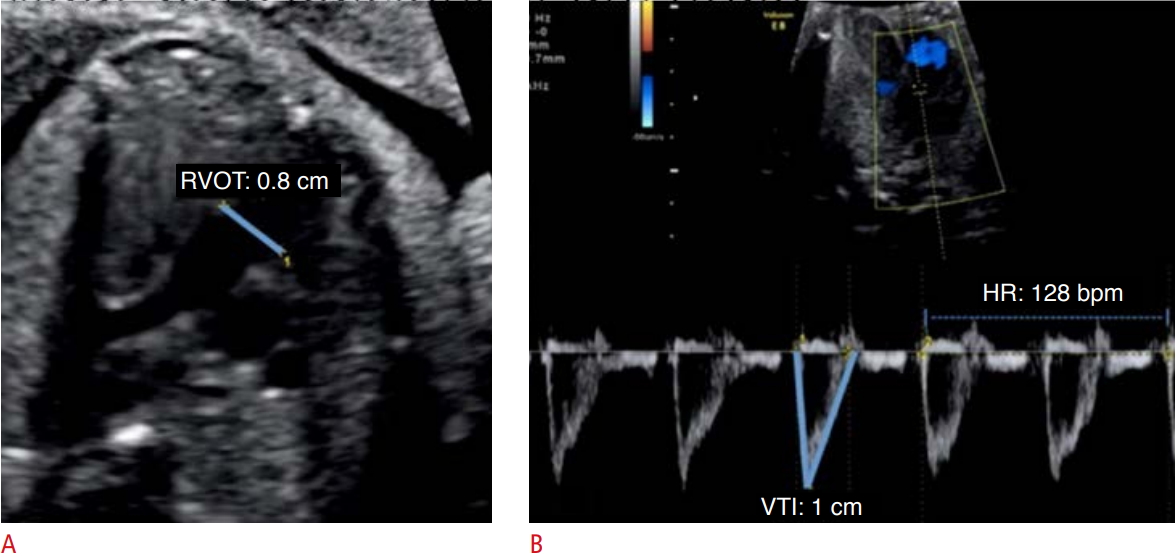
CO and cardiac volume can be evaluated by 2D and 3D methods. CO is the product of the heart rate and the stroke volume (SV) ejected by the left ventricle. The SV is the product of the valvular cross-sectional area and the velocity-time integral (VTI) (Figs. 2, 3) [4,5,10]. Mathematically, CO=FHR×πr2 ×VTI, where CO refers to the cardiac output, FHR is the fetal heart rate, r2 equals half the diameter of the ventricular outflow tract, VTI is the velocity-time integral of the flow out of the assessed ventricle, and π is a constant with a value of 3.14.
In the evaluation of CO by the 2D method, it is necessary to acquire the values of the VTI, ventricular outflow tract diameter, and fetal heart rate. The VTI is obtained through the pulsed Doppler sample volume positioned at the ventricular outflow tract. The VTI is the area under the velocity spectral curve, which indicates the sum of all individual velocities throughout the ventricular ejection period (Figs. 2, 3). The measurement of the ventricular outflow tract at the end of the systolic period of the cardiac cycle using the 2D method can be an important challenge for this aspect of the functional evaluation, as it is difficult to make exact measurements because the valve has elliptical characteristics. The measurement should be made with extreme care because the square of the value of this radius will be used (Figs. 2, 3) [4,5,10]. Measurement of the ventricular outflow tract is contraindicated in cases of valve injury (obstructive or not).
Using the 3D method to evaluate the CO and SV, it is possible to perform a volumetric acquisition of the fetal heart [11]. Subsequently, the image is processed through a spatio-temporal image correlation, using the volume mode to determine the cardiac volume and, consequently, the CO by multiplying it by the fetal heart rate [11].
CO in fetuses may increase in cases of active CHD [4], that is, in situations in which high CO causes hemodynamic repercussions even in the intrauterine period, such as agenesis of the ductus venosus, arteriovenous fistulas, teratomas, and placental transfusion syndrome. In such cases, the calculation of CO may assist in clinical follow-up and more careful management of the fetus [5]. CO in fetuses may decrease in cases where there is a deficit of cardiac contractility, such as fetal myocarditis or cardiomyopathy secondary to a viral infection in the gestational period [5].
Maximum Displacement of the Valvar Ring
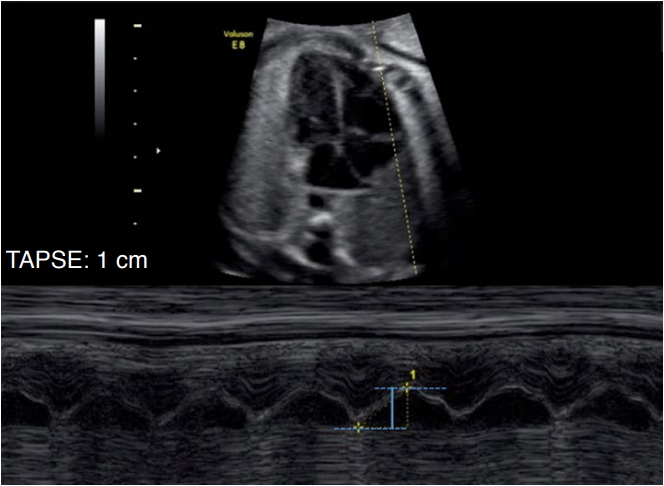
The evaluation of the maximum displacement of the valvar ring emphasizes the concept of longitudinal movement of the left ventricle during the cardiac cycle. During systole, the valvar ring nears the apical region, and the greater the displacement of the valvar ring, the better the longitudinal systolic function of that ventricle. Thus, we can evaluate this shift using M-mode aligned in the direction of the lateral portion of the valvar ring. The M-mode trace demonstrates the excursion movement of the ring during the cardiac cycle, and this distance is the displacement of the annulus. This parameter can be assessed for both the left ventricle and the right ventricle through measurements of the mitral annular plane systolic excursion (MAPSE) and the tricuspid annular plane systolic excursion, respectively (Fig. 4) [12].
The evaluation of longitudinal systolic cardiac function through the MAPSE in adults demonstrated a good correlation with scintigraphy. However, these measures may be underestimated or overestimated, because they are 1-dimensional measurements that are dependent on the position of the transducer [13,14].
Care should be taken regarding values of maximum displacement of the valvar ring, as there is already an estimated normal value in the adult population [12]. Although reference curves exist for infants and fetuses, we should not take into account isolated measurements only. Monitoring the left ventricle while performing serial measurements of valvar displacement is preferable for evaluating the performance of the myocardium [12,14].
Other Techniques
In addition to the parameters used for systolic evaluation, there are also parameters used to assess the velocity of contractility of myocardial fibers derived from Doppler tissue imaging [5]. These parameters are well documented for fetuses, and deformities of the myocardial fibers identified based on "speckle tracking" should receive further evaluation, as these techniques must still be validated in the fetal heart [4,14].
Evaluation of Diastolic Function in the Fetal Heart
The diastolic phase occupies approximately two-thirds of the cardiac cycle, comprising four steps: isovolumetric relaxation, the rapid filling phase, the slow filling phase or diastasis, and atrial systole. Considering these four steps, we can understand why the diastolic blood volume of the ventricle can be transmitted to the atrium and veins (pulmonary veins and superior and inferior venae cavae) over a relatively long period.
The diastolic evaluation of the fetal heart can utilize the blood flow of the atrioventricular valves, pulmonary veins, and inferior vena cava, as well as evaluations of the isovolumetric relaxation and velocity of the myocardial fibers using the tissue Doppler technique.
Blood Flow of the Atrioventricular Valves, Pulmonary Vein, and Inferior Vena Cava
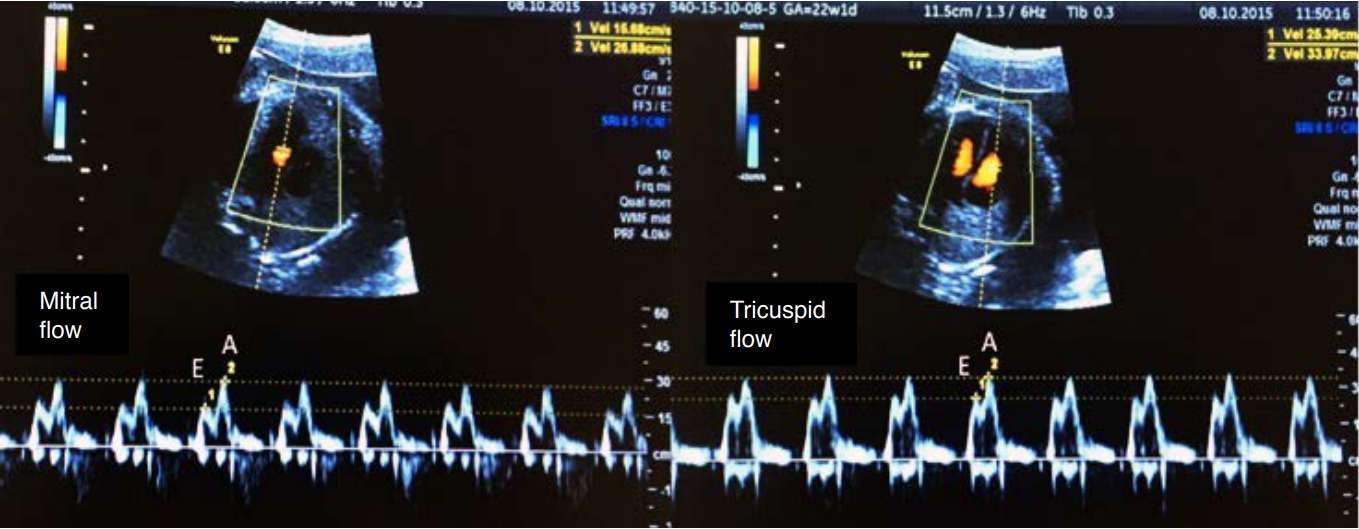
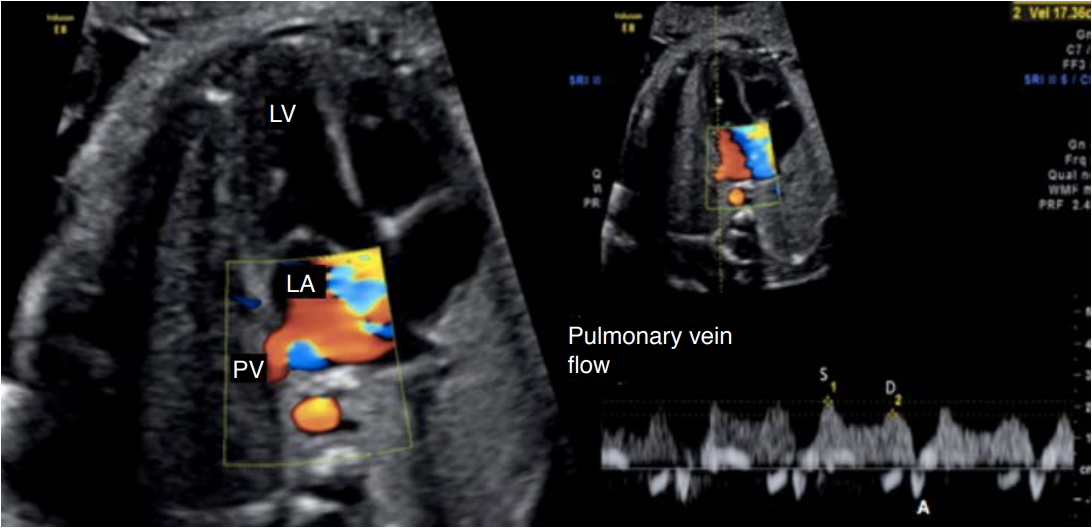
To characterize the blood flow from the atrioventricular valves and pulmonary veins, it is necessary to use the 4-chamber view (4C) with color Doppler. The sample volume of the pulsed Doppler should have a 2-mm aperture [3]. To obtain the spectral curve of the blood flows of the MV and tricuspid valve (TV), the pulsed Doppler sample is positioned inside the ventricular cavity, immediately below the valve (Fig. 5) [4,5]. To obtain the spectral curve of pulmonary vein blood flow, the pulsed Doppler sample is positioned at the connection of the pulmonary vein to the left atrium (Fig. 6) [4,5,15].
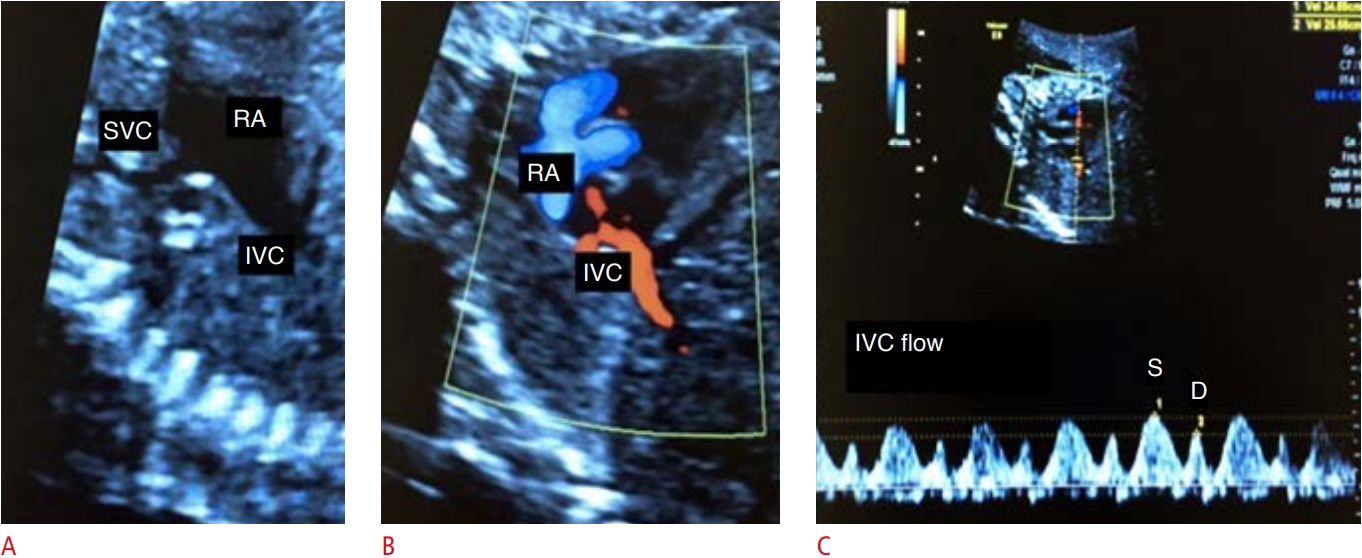
To obtain the spectral curve of the inferior vena cava, we should highlight the arrival of the two venae cavae into the right atrium through the bicaval plane, in the sagittal plane of the fetus. The pulsed Doppler sample is positioned at the inferior vena cava, with care to avoid interference with the vascular bed of the proximities and maintaining a maximum angle of 30° (Fig. 7) [4,5].
The normal blood inflow into the ventricles consists of a biphasic waveform, in which the initial flow coincides with the E wave, which is the passive filling period of the ventricle, and the late flow coincides with the A wave, the phase of atrial systole. Due to the lower ventricular compliance characteristic of the fetal heart, the magnitude of the A wave normally exceeds that of the E wave, with an E/A wave ratio<1 (Fig. 5) [5].
The normal blood flow in the veins in adults and children presents two anterograde waves (above the baseline, a peak systolic velocity [S wave] and a diastolic peak velocity [D wave]) and a retrograde wave (below the baseline [A wave]) (Fig. 6) [5]. The S wave comprises the systolic period of the ventricle and coincides with the period of atrial relaxation. The D wave occurs during the rapid filling phase of the ventricle during diastole (Figs. 6, 7). The A wave, which is usually not very evident, arises during atrial contraction at the end of diastole and corresponds to retrograde flow in the vein [4,5].
The normal blood flow in the pulmonary veins in fetuses may present three anterograde waves [15,16]. Because some of the blood in the ductus venosus, while passing through the inferior vena cava and right atrium, is directed to the left atrium through the foramen ovale, the waveform in the pulmonary vein is very similar to that of the inferior vena cava and ductus venosus [17]. Accordingly, during systole and rapid filling of the left ventricle during diastole, through a patent foramen ovale, the flows of the inferior vena cava and ductus venosus may be influenced by the pressure of the left atrium, which in turn may undergo changes according to the pressure of the left ventricle [17].
Few studies have been conducted on normal blood flow in the inferior vena cava of fetuses. The findings are similar to those of adults and children, with a triphasic pattern: S wave, period of ventricular systole; D wave, period of early diastole; and A wave, reverse flow of atrial contraction. The indexes studied in the analysis of the flow of the inferior vena cava include the preload index (A wave-to-S wave ratio), the index of peak velocity, and the pulsatility index [18].
Isovolumetric Relaxation Time
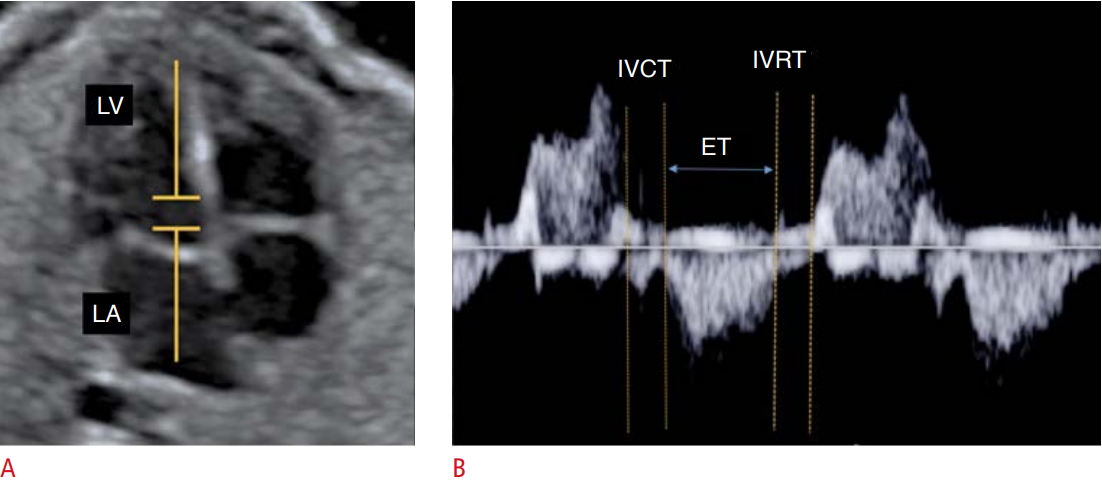
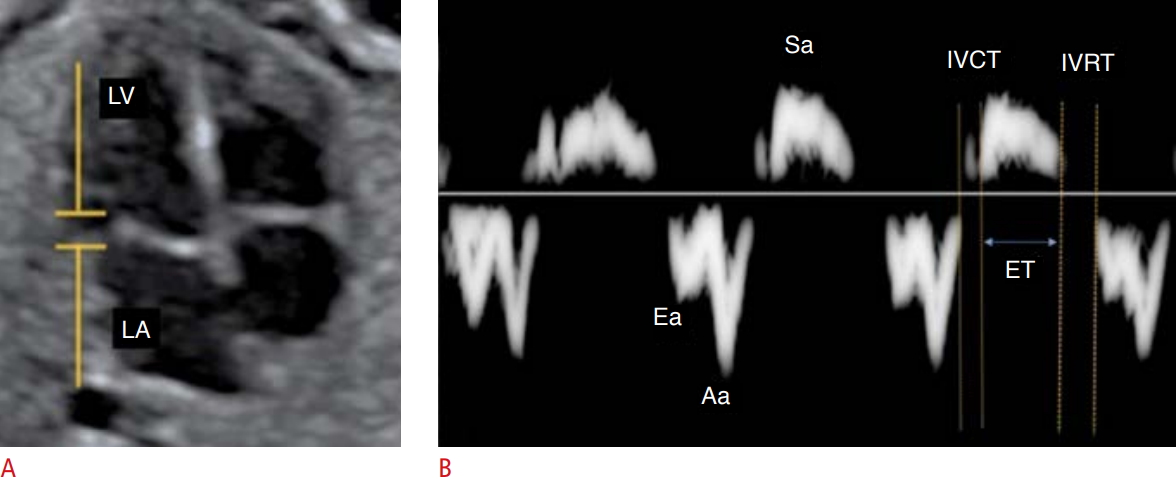
The isovolumetric relaxation time (IVRT) of the left ventricle corresponds to the initial period of diastole. This measurement can be obtained through pulsed Doppler (Fig. 8) or tissue Doppler (Fig. 9), with the sample positioned between the outflow and inflow [3]. The basic idea of this measurement is to record the time between the closing of the MV outlet and the opening of the atrioventricular valve. Diastolic dysfunction may be present when the IVRT is abnormally high [4,19].
Tissue Doppler measures the velocity of myocardial fiber movement. The sample volume can be positioned in the lateral portion of the MV ring, the TV ring, and the septal wall of the valve ring. The spectral curve obtained shows the systolic movement of the ring (Sa) and the diastolic movement of the ring (Ea and Aa) [3]. From this curve, data on the segmental function of the fetal heart can be obtained (Fig. 9).
Although this technique is more sensitive than classic spectral Doppler and allows the assessment of segmental diastolic function, some practical difficulties exist, such as making measurements of these values and the availability of this tool on ultrasound equipment.
Other Techniques
Other techniques to assess diastolic function in fetuses include the systolic-to-diastolic time index in the fetal heart cycle, measurement of the atrial volume, the pulsatility index of the pulmonary vein, and measurement of the excursion of the foramen ovale. All these techniques are worthy of consideration and are being researched worldwide, but they must still be validated to be fully incorporated into the daily routine of the echocardiographer [20,21].
Myocardial Performance Index
Additionally, the MPI, also known as the Tei index, can be used. The MPI was developed in the mid-1990s as a measure of global ventricular performance, including both systolic and diastolic parameters, and can be applied to the left or right ventricle. The MPI encompasses the following time intervals derived from spectral or tissue Doppler: ejection time (ET; the entire ejection period observed with Doppler), isovolumetric contraction time (IVCT; end of the A wave and the beginning of systole), and IVRT (end of the systole and beginning of the E wave) (Figs. 8, 9). With these values, we obtain the following equation: MPI=IVCT+IVRT/ET. Systolic dysfunction is indicated by abnormally high values of IVCT or abnormally low values of ET. Diastolic dysfunction corresponds to high values of IVRT. Thus, the MPI increases in both systolic and diastolic dysfunction. Several studies have sought to validate the Tei index for the functional evaluation of the fetal heart [3]. The MPI determined using tissue Doppler is one of the most sensitive and reproducible methods for evaluating fetal cardiac function of the right ventricle [22].
Cardiovascular Profile Score
The fetal cardiovascular failure score was first reported by Huhta [23], and has been validated as a predictor of perinatal morbidity and mortality [24,25]. The score combines the following direct and indirect markers of fetal cardiovascular function: fetal hydrops, venous and arterial Doppler findings, heart size, and cardiac function using parameters such as the presence of regurgitation in the atrioventricular valves, the biphasic pattern of the filling flow in diastole, and the relationship between the shortening fraction of the ventricles [23]. The normal score is 10, and scores of less than 5 points are predictive of perinatal mortality [25,26].
 Download Citation
 PDF Links
 PubReader
 ePub Link
 Full text via DOI
 Full text via PMC


