

 Print
Print facebook
 twitter
 Linkedin
 google+

Introduction
Hepatic steatosis is defined as triglyceride content exceeding 5% in hepatocytes [1]. The most common causes of hepatic steatosis are obesity and its complications, especially type 2 diabetes and hypertriglyceridemia [2]. Indeed, nonalcoholic fatty liver disease (NAFLD) is the most common cause of liver disease worldwide, with a reported global prevalence of 25.2% [3]. NAFLD can progress into a more advanced stage of disease such as cirrhosis or nonalcoholic steatohepatitis (NASH) [3,4]. In addition, hepatic steatosis is a common histopathological feature of chronic hepatitis B (CHB) [5] and chronic hepatic C (CHC) infections [6]. Moreover, the presence of steatosis has been reported to be associated with faster fibrosis progression or significant fibrosis burden in patients with CHC or CHB [7-10]. Therefore, an easy-to-use tool that can diagnose hepatic steatosis via simple, noninvasive evaluation of liver fat content in different clinical settings would be beneficial for the identification of asymptomatic high-risk patients and the evaluation of response to therapy or disease progression [11].
At present, the gold standard for diagnosing hepatic steatosis is a liver biopsy. However, liver biopsy has clear disadvantages of morbidity owing to invasiveness, cost, and inaccuracy due to sampling variation [12,13]. In accordance with clinical needs, quantitative imaging-based approaches using either magnetic resonance (MR) or ultrasonography (US) techniques have emerged as noninvasive tools for steatosis quantification [14-17]. Previous studies have demonstrated that quantitative US parameters such as the attenuation coefficient (AC) and backscatter coefficient may be more accurate than conventional US for predicting the hepatic steatosis grade in patients with NAFLD [18,19]. AC is a measure of US energy loss in tissue that provides a numerical parameter analogous to the obscuration of tissue structures assessed qualitatively using B-mode images [20]. Recently, 2-dimensional (2D) attenuation imaging (ATI) has been developed and equipped on a clinical US platform (Canon Medial Systems, Tochigi, Japan), which allows tissue characterization by providing the AC and color mapping [21]. ATI is expected to have an advantage from the perspective of real-time measurements and large sample volumes [22]. However, for ATI to be used more widely, a high probability of obtaining actual applicable measurements and repeatability are warranted. To the best of our knowledge, no study has evaluated the intra-observer or inter-observer agreement of AC measured using the real-time 2D ATI technique.
The purpose of this prospective study, therefore, was to evaluate the reproducibility of real-time 2D ATI measurements for the noninvasive assessment of hepatic steatosis.
Materials and Methods
Two separate prospective studies (one for intra-observer reproducibility of ATI in patients with suspected hepatic steatosis [group 1] and the other for inter-observer reproducibility of ATI in volunteers [group 2]) were approved by our institutional review board. Informed consent was obtained from all enrolled subjects.
Patients
In group 1, 157 patients who met the following eligibility criteria from January to May 2018 were enrolled: (1) older than 18 years of age; (2) clinically suspected hepatic steatosis with or without liver function test abnormalities; and (3) scheduled for initial or follow-up liver US examinations at our radiology department. Fourteen patients were excluded according to the following criteria: (1) moderate, heavy, or binge alcohol consumption, defined as three drinks or more per day on average for men and two or more drinks per day on average for women (n=6); (2) inability to hold their breath for more than 3 seconds during the US examination (n=4); (3) patients who had undergone right hepatectomy (n=2); and (4) patients who had received locoregional treatments for liver malignancies (n=2). Laboratory tests, including liver biochemistry and body mass index (BMI) measurements, were performed in patients when clinically indicated at the discretion of the referring physicians, on the same day. Finally, 143 patients constituted the study population.
For group 2, we separately enrolled 18 asymptomatic adult volunteers for evaluation of the inter-observer reproducibility of ATI. All volunteers had no history of chronic viral or non-viral hepatitis such as alcoholic or non-alcoholic steatohepatitis, or autoimmune hepatitis. Laboratory tests, including liver biochemistry and measurements of BMI, were obtained from all subjects on the same day.
Gray-Scale US and ATI Measurements
Group 1
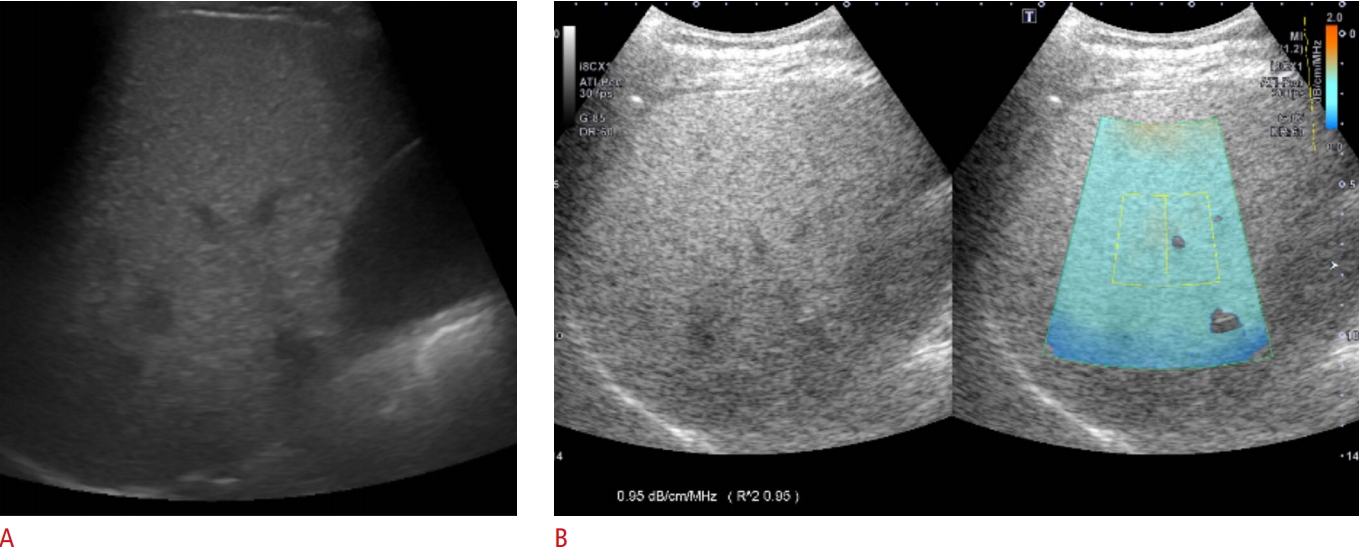
One board-certified radiologist (J.M.L.) with 20 years of experience in abdominal imaging performed conventional gray-scale US examinations using a clinical US system (Aplio i900, Canon Medical Systems) and a wide-band convex i8CX1 multifrequency probe. Patients were requested to fast for at least 6 hours before the examination. Sonograms were obtained from patients in the supine or decubitus position and in the subcostal, transverse, oblique, sagittal, and intercostal planes. The sonograms were stored for evaluation of the presence or absence of the known US features of fatty liver, including increased echogenicity, impaired visualization of the diaphragm line and intra-hepatic portal vein wall, and decreased visualization of deep liver structures [23]. Additionally, the visual degree of hepatic steatosis was scored later by two independent reviewers on gray-scale US as follows: 0 (absent), 1 (mild), 2 (moderate), and 3 (severe). Mild steatosis was defined as increased liver echogenicity compared with the right renal cortex [24]. Moderate steatosis was indicated by liver echogenicity greater than that of the right renal cortex with obscured periportal echogenicity (Fig. 1A). Severe steatosis was determined by increased liver echogenicity obscuring diaphragmatic echogenicity. Additionally, the skin-to-capsule distance was measured as the shortest distance between the transducer and the Glisson capsule.
The same radiologist who acquired gray-scale US also performed additional ATI measurements, which provided color mapping of the degree of ultrasound attenuation using the same clinical US system (Aplio i900, Canon Medical Systems) in all patients. Two sessions of ATI measurements were performed by the radiologist, with an interval of 2-5 minutes and a positional change between sessions. According to the vendorsŌĆÖ recommendation, the radiologist attempted to obtain at least six ATI color maps with an R2 value Ōēź0.8. An approximately 3├Ś4-cm region of interest (ROI) overlaid on the B-mode image was placed in the right lobe of the liver at the intercostal space while the patient held his or her breath (Fig. 1B). The ROI box was placed in a relatively homogeneous region of the right lobe of the liver at least 2 cm below the liver capsule, while avoiding areas with focal fat sparing or deposition and large vessels. With a single button pressed by the operator for freezing a B-mode image, the level of US attenuation was color-coded and displayed in the ROI. Areas with significant errors of attenuation calculation, such as vascular structures or areas with reverberation artifacts, were excluded from the ATI map.
In principle, on gray-scale imaging, an ultrasound beam is focus-dependent, so that the highest image resolution and maximum signal intensity are acquired at the focal zone while the signal intensity profile is adjusted and transformed to the simple signal intensity profile, which reflects the attenuation caused by scattering and absorption in ATI. The beam profile is then obtained by averaging the signal from the yellow ROI, and AC is automatically quantified. The US system automatically displays the AC and the results of the quality of linear fitting for the reliability of data (R2 value) to optimize the accuracy of ROI placement. The R2 value can be interpreted as follows: <0.8, poor; 0.81-0.90, good; >0.9, excellent. Since AC values with an R2<0.8 were considered to be unreliable and were excluded from the analysis, the radiologist performed ATI measurements until each session contained six AC measurements with an R2Ōēź0.8. The ATI values in each set were averaged for statistical analysis.
Group 2
Three board-certified radiologists (H.J.K., S.J.A., J.M.L.) with at least 6 years of experience in abdominal imaging performed ATI measurements using an Aplio i900 (Canon Medical Systems). All volunteers had fasted for at least 6 hours before the examination. Each radiologist measured the AC at least 6 times in each volunteer. The method of measurement was the same as that for group 1 as described above. Two radiologists who performed a visual assessment of steatosis in group 2 also assessed the degree of hepatic steatosis, independently and retrospectively.
Statistical Analysis
Correlations between the mean AC and visual grades of steatosis determined by the two reviewers were assessed using Spearman rank correlation coefficients. The AC was compared between the patients with different visual grades using the Jonckheere-Terpstra and Mann-Whitney U tests. Comparison of visual grading by two reviewers was analyzed using the Wilcoxon signed-rank test, and inter-observer agreement between the two reviewers for visual assessment was evaluated using linear-weighted kappa statistics. The kappa results were interpreted as follows: values < 0.2 as poor, 0.21-0.40 as fair, 0.41-0.60 as moderate, 0.61-0.80 as good, and 0.81-1.00 as very good agreement. The intra-observer (group 1) and inter-observer reproducibility (group 2) of ATI measurements and intra-observer reproducibility according to BMI were assessed using intra-class correlation coefficients (ICCs) and the coefficient of variation (CoV). ICC estimates and their 95% confidence intervals (CIs) were calculated based on a mean-rating, absolute-agreement, 2-way mixed-effects model. Based on the 95% CI of the ICC estimate, values less than 0.5, between 0.5 and 0.75, between 0.75 and 0.9, and greater than 0.90 were considered indicative of poor, moderate, good, and excellent reliability, respectively [25]. All statistical analyses were performed using IBM SPSS Statistics for Windows version 20.0 (IBM Corp., Armonk, NY, USA) and MedCalc Statistical Software version 15.2 (MedCalc Software, Ostend, Belgium; http://www.medcalc.org; 2015). A P-value of <0.05 was considered indicative of statistical significance.
Results
Patient Characteristics
Group 1
Among 143 patients (76 men and 67 women; mean age┬▒standard deviation [SD], 55.6┬▒11.9 years; range, 19 to 81 years) with suspected hepatic steatosis, 23 patients (16.1%) underwent US examinations as the initial work-up for suspected hepatic steatosis and 120 patients (83.9%) underwent follow-up US (Table 1). Their mean BMI was 25.7┬▒3.4 kg/m2. Seventy-nine patients (79 of 143, 55.2%) were obese (BMI Ōēź25 kg/m2). The mean skin-to-capsule distance was 18.8┬▒3.8 mm (range, 9 to 34 mm). Among 130 patients who underwent laboratory tests on the same day of the US examinations, 51 (39.2%) showed an abnormal increase of either alanine transaminase or aspartate transaminase. In the visual assessment, 132 patients were assessed as having hepatic steatosis by reviewer 1 and 133 patients by reviewer 2. The mean ATI of the first session was 0.70┬▒0.11 dB/cm/MHz (range, 0.46 to 0.99) and that of the second session was 0.71┬▒0.10 dB/cm/MHz (range, 0.45 to 1.00).
Group 2
A total of 18 healthy volunteers (13 women and 5 men; mean age┬▒SD, 30.2┬▒7.3 years; range, 22 to 57 years) were included. The mean BMI of all volunteers was 21.2┬▒2.1 kg/m2. One person (1 of 18, 5.6%) was obese (27.8 kg/m2). The mean skin-to-capsule distance was 14.3┬▒5.2 mm (range, 10 to 32 mm). Two volunteers (2 of 18, 11.1%) showed elevated levels of alanine transaminase, with a normal level of aspartate transaminase. In the visual assessment, 16 volunteers (16 of 18, 88.9%) were assessed as having normal hepatic echogenicity without steatosis, another (1 of 18, 5.6%) as having mild steatosis, and the other (1 of 18, 5.6%) as having moderate steatosis by both reviewers 1 and 2. The mean ATI was 0.52┬▒0.06 dB/cm/MHz (range, 0.46 to 0.67) in the first session, 0.51┬▒0.08 dB/cm/MHz (range, 0.40 to 0.70) in the second session, and 0.52┬▒0.05 dB/cm/MHz (range, 0.44 to 0.66) in the third session.
Technical Aspects of ATI Measurements
In the first session of group 1, six ATI measurements were obtained in 137 patients (95.8%, 137 of 143), seven measurements in three patients (2.1%), eight measurements in one patient (0.7%), nine measurements in one patient (0.7%), and 12 measurements in one patient (0.7%), in order to obtain six ATI color maps with an R2 value Ōēź0.8. In the second session, 138 (96.5%, 138 of 143) patients underwent six measurements, three (2.1%) underwent seven measurements, one (0.7%) underwent eight measurements, and one (0.7%) underwent nine measurements. In group 2, 16 subjects (88.9%) underwent six measurements by three radiologists. Two subjects (11.1%) underwent seven measurements by one radiologist and six measurements by two radiologists. As the ATI measurements required less than 1 second, less than 1 minute was needed to acquire six ATI color maps in both groups.
Intra-observer and Inter-observer Variability of ATI Measurements
For the intra-observer reproducibility of ATI, the ICC was 0.929 (95% CI, 0.901 to 0.949), indicating excellent reliability, and the CoV was 7.1% (SD, 0.051). The intra-observer reproducibility of each subgroup was shown as ICC and CoV, and CoV was shown not to be influenced by sex, age, BMI, skin-to-capsule distance, or chronic liver disease (P>0.05) (Table 2). For inter-observer variability, the ICC was 0.792 (95% CI, 0.549 to 0.916), indicating good reliability.
Correlation between ATI Measurements and Hepatic Steatosis Grades
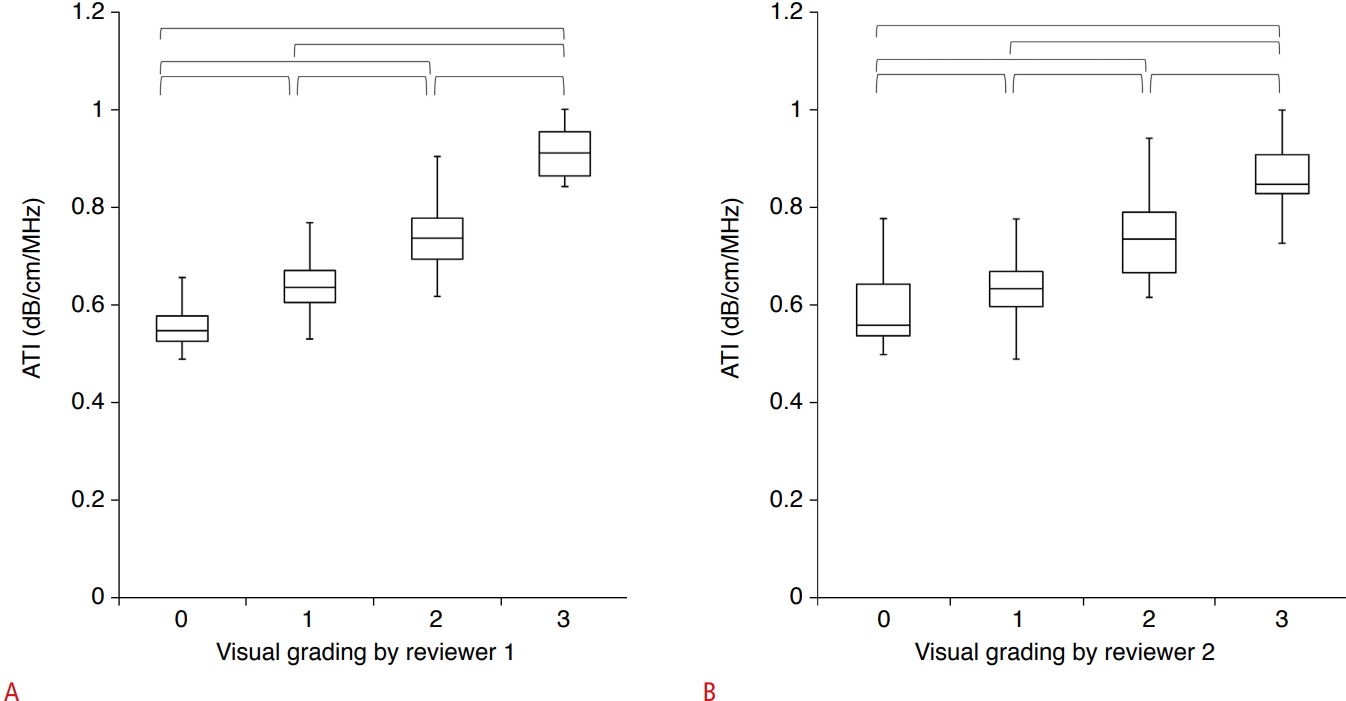
The AC values in groups 1 and 2 (n=161) according to the visual grading of hepatic steatosis are presented in Table 3. ATI measurements showed a significant correlation with the visual grade of hepatic steatosis for both reviewer 1 (rho, 0.780; P<0.001) and reviewer 2 (rho, 0.695; P<0.001). Fig. 2 shows the distribution of ATI over the visual grades of steatosis. The mean AC values were significantly different across all grades (P<0.05) (Fig. 2). There was no significant difference between the visual grades assigned by the two reviewers (P=0.131), and weighted kappa analysis revealed good agreement (linear weight, kappa, 0.800; standard error, 0.036; 95% CI, 0.730 to 0.871) between the visual grades assigned by the two reviewers.
Discussion
In our study, we demonstrated that the test-retest reproducibility of ATI in patients with suspected hepatic steatosis was excellent and the inter-observer agreement in asymptomatic volunteers was good. Furthermore, intra-observer repeatability was not affected by sex, age, BMI, skin-to-capsule distance, or chronic liver disease. Additionally, there were significant correlations between ATI and the visual assessments of hepatic steatosis performed by each of the two reviewers. Considering these results, we believe that ATI may be of great utility as a screening test in patients with hepatic steatosis.
In recent years, several US-based techniques such as the controlled attenuation parameter (CAP) acquired via FibroScan (Echosens, Paris, France) or the acoustic structure quantification technique have been used to quantify hepatic steatosis [17,26-28]. However, despite the high accuracy of transient elastography [29,30], the diagnostic performance of CAP has been less convincing, especially in obese patients and patients with a heterogeneous distribution of steatosis [31,32]. In contrast, our results showed the maintenance of excellent intra-observer repeatability, irrespective of BMI or skin thickness. This can be explained by the fact that only the reliable areas for measurement were displayed on the ATI map after excluding regions with significant errors in the attenuation calculation; furthermore, the coefficient of determination allowed the operator to confirm the optimal location for ROI placement to improve accuracy. Furthermore, while the unidirectional measurement of CAP may be vulnerable to complex wave patterns such as reflections and refractions [31], ATI presents the adjusted intensity change after removing the systemŌĆÖs influence on signal intensity by extracting the focus-dependent beam profile and internal gain control from the observed intensity [21]. Moreover, ATI may be more advantageous as it can be performed with conventional B-mode US, which can help to exclude other causes of liver disease and demonstrate the alteration of hepatic parenchymal echogenicity related with steatosis; additionally, it has a significantly larger area of measurement than CAP [19]. Therefore, we believe that ATI may be utilized as a reliable tool for the evaluation of hepatic steatosis, although further studies comparing the diagnostic performance of ATI and CAP for hepatic steatosis are warranted.
Of note, in this study, intra-observer reproducibility of ATI in the evaluation of hepatic steatosis was shown not to be influenced by the presence or absence of chronic liver diseases. It has been reported that the presence of hepatic fibrosis decreased the diagnostic accuracy of MR imaging for quantification of hepatic steatosis [33-35]. Indeed, the degree of steatosis in patients with hepatic fibrosis could be underestimated compared to patients without fibrosis [36]. Furthermore, several studies have demonstrated that in patients with CHC or CHB, steatosis is an independent risk factor associated with severe fibrosis [7,8,37]. Although it is not yet clear if steatosis control, in addition to antiviral treatment, can reduce the burden of fibrosis in patients with CHB or CHC, evaluation of steatosis in patients with CHB or CHC may have an important clinical value [7]. In this regard, our study results are clinically valuable, as they demonstrate the possibility of a robust modality for fat quantification in a wide spectrum of chronic liver diseases, including NAFLD, CHB, and CHC.
Interestingly, despite the high prevalence of NAFLD, it generally has relatively low severity, as the prevalence of advanced fibrosis is <5%; this discrepancy underscores the need for more robust pathways of risk stratification [27]. Therefore, significant interest has emerged in developing better clinical prediction rules and noninvasive biomarkers to identify NASH in patients with NAFLD [38]. According to a recent practice guideline from the American Association for the Study of Liver Diseases for the diagnosis and management of NAFLD, transient elastography or MR elastography are suggested to be clinically useful tools for identifying advanced fibrosis in patients with NAFLD [38]. Additionally, several major US vendors have developed 2D shear wave elastography (SWE) techniques for hepatic fibrosis staging, and more recently, both 2D ATI and SWE have been equipped in a single clinically available US platform (Canon Medical Systems) [19,39-41]. This promising multiparametric approach using ATI, SWE, and conventional US can provide clinicians with a comprehensive evaluation of parenchymal changes, including quantification of both liver steatosis and stiffness in patients with NAFLD in a single visit, thereby ultimately reducing the need for invasive liver biopsy.
There are several limitations to our study. First, the inter-observer and intra-observer reproducibility of ATI was evaluated in different study populations. However, as this prospective study was performed as an additional part of a routine US examination in the patient population due to funding limitations, it was difficult to perform multiple measurements of ATI with three operators in patients with chronic liver diseases. Instead, inter-observer reproducibility was evaluated in asymptomatic volunteers. Second, we correlated the ATI results using qualitative assessments of B-mode US images rather than a pathologic assessment of hepatic steatosis. However, our studyŌĆÖs goal was to evaluate the reproducibility of ATI, rather than to evaluate the diagnostic performance of ATI for hepatic fat quantification. Thus, further prospective studies are warranted to evaluate the diagnostic accuracy of ATI in hepatic fat quantification using pathologic assessment or MR-proton density fat fraction as a reference standard in patients who underwent liver transplantation. Third, the test-retest reproducibility of ATI was tested on the same day with a 2-minute interval, although positional changes were made after the first set of measurements. Furthermore, the fact that a radiologist who was aware of the results of the ATI measurements of the first session performed the second session of ATI measurements might have had an effect on the intra-observer reproducibility. However, as we included all ATI measurements with R2 value >0.8, the impact on intra-observer reproducibility is unlikely to have been excessive. Since ATI could be used for longitudinal follow-up of patients with NAFLD or patients with steatosis and chronic liver diseases after modification of lifestyle and diet control, test-retest reproducibility on different days would have been more desirable.
In conclusion, ATI demonstrated excellent intra-observer reproducibility and good inter-observer reproducibility in the assessment of hepatic steatosis.
 Download Citation
 PDF Links
 PubReader
 ePub Link
 Full text via DOI
 Full text via PMC


