

 Print
Print facebook
 twitter
 Linkedin
 google+

Introduction
Ultrasonography (US) is a non-invasive modality used for imaging of the liver and biliary tract. Unlike computed tomography scanning and magnetic resonance imaging, US produces results in real time and is convenient to use at the bedside. Conventional grayscale US has been used to detect and grade chronic liver disease (CLD) as well as to screen focal hepatic lesions. The clinical guidelines for the management of CLDs such as viral hepatitis, alcoholic liver disease, and metabolic liver disease recommend US as surveillance for liver cirrhosis (LC) and hepatocellular carcinoma [1-4]. Grayscale US findings suggestive of LC include hepatic surface nodularity, blunting of the liver edge, accentuation of the fissure, heterogeneity and coarsening of the hepatic echotexture, and morphological changes, such as enlargement of the left and caudate lobes of the liver and shrinkage of the right lobe [5]. The reported sensitivity of US in the diagnosis of LC ranges from 37.5% to 95%, but its sensitivity in the prediction of CLD requiring clinical management (above F2 and F3) is low, with values of 13.6% to 27.4%, respectively. Previous studies have found no correlation between the fibrotic pattern on grayscale US and the grade of hepatic fibrosis [6-11]. In contrast, Nishiura et al. [7] used a US fibrosis scoring system involving surface nodularity, edge blunting, and echotexture assessed with low- and high-frequency probes and found that scores were significantly correlated with the histological stage of hepatic fibrosis.
Hepatic elasticity imaging is widely used for surveillance of CLD patients; recently, several research groups have published technical and clinical guidelines for CLD, including guidelines on US elastography [12-15]. Two-dimensional shear wave elastography (2D-SWE) exhibits good technical performance in the assessment of hepatic fibrosis, with a high rate of technical success and reliability [16]. In the evaluation of LC, 2D-SWE has been found to have almost the same accuracy as transient elastography (TE), the most clinically validated US elastography technique, and the correlation of 2D-SWE with the diagnosis of significant hepatic fibrosis (≥F2) has been found to be better than that of TE [17]. The advantage of 2D-SWE in the evaluation of hepatic fibrosis is that grayscale US examination and elasticity measurements can be performed simultaneously.
We expected that incorporating the quantitative liver stiffness measurement (LSM) obtained by 2D-SWE would increase the reliability of qualitative conventional grayscale US and the reproducibility of the diagnosis and grading of hepatic fibrosis by US. The purpose of our study was to determine the effect of the incorporation of LSM values obtained using 2D-SWE with grayscale US grading on the diagnosis of hepatic fibrosis and LC. We also compared the performance of grayscale US with and without LSM values in the diagnosis of significant fibrosis (≥F2) and LC (F4) made by two independent reviewers.
Materials and Methods
Patients
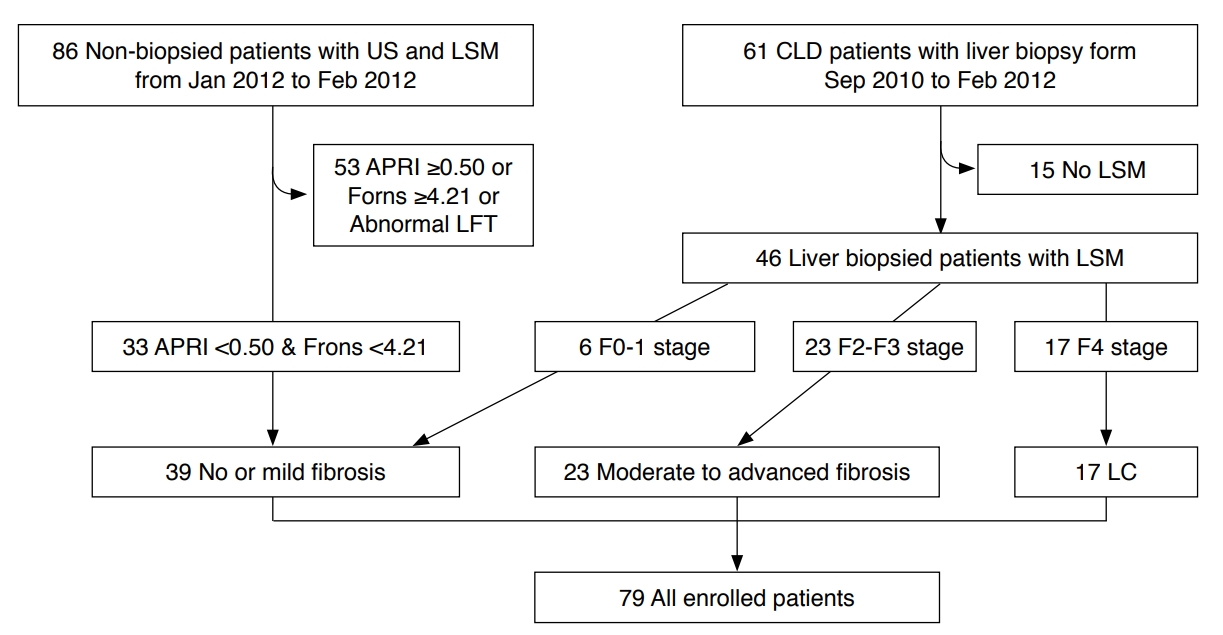
This retrospective study was approved by the institutional review board of our hospital, and the requirement for informed consent was waived. The study included 61 consecutive patients who underwent percutaneous liver biopsy between September 2010 and February 2012. Most patients were examined by grayscale US and underwent LSM measurement by 2D-SWE prior to biopsy, but 15 patients did not undergo LSM measurement and were excluded. The causes of liver biopsy and LSM evaluation were alcoholic LC (n=9), viral hepatitis B (n=12), viral hepatitis C (n=11), co-infection with hepatitis B and C (n=1), heavy alcohol consumption with underlying viral hepatitis B (n=2), suspicion of autoimmune hepatitis (n=4), non-alcoholic fatty liver disease (n=1), fever of unknown origin (n=1), and cryptogenic LC (n=1).
In the present study, the subjects were classified into three groups: no or mild fibrosis, moderate to advanced fibrosis, and LC. For recruitment of the no or mild fibrosis group, the study included 86 non-biopsied patients who underwent liver US coupled with SWE in January or February 2012. In order to include only patients with minimal hepatic fibrosis, patients with abnormal aspartate aminotransferase-to-platelet ratio indices (APRI) or Forns scores were excluded. Of the 86 patients, 37 had normal APRIs (<0.50) and Forns scores (<4.21). Of these, four patients with abnormal liver function profiles were also excluded. Finally, the remaining 33 subjects who did not undergo liver biopsy were assigned to the no or mild fibrosis group. The reasons for US examination of these patients were viral hepatitis B (n=7), evaluation for administration of methotrexate due to autoimmune collagen vascular disease (n=25), and suspicion of CLD on a previous US examination (n=1).
The pathologic degree of hepatic fibrosis was graded using the Meta-Analysis of Histological Data in Viral Hepatitis (METAVIR) fibrosis scoring system. In addition to the 33 patients mentioned above, the no or mild fibrosis group included patients with scores of F0 and F1 on the METAVIR scale. The moderate to advanced fibrosis group included patients with scores of F2 and F3, and the LC group included patients with METAVIR scores of F4. APRI and Forns scores were calculated from recorded laboratory findings and platelet counts.
US Examination and Measurement of Liver Stiffness
Grayscale US examinations and measurements of liver stiffness were performed by one of three attending abdominal radiologists. The examiners had 17, 8, and 6 years of clinical experience in abdominal radiology, and all three perform liver US as part of their regular practice. A dedicated US machine (Aixplorer, Supersonic Imagine, Aix-en-Provence, France) equipped with 2D-SWE functionality was used to acquire grayscale images and LSM values.
Following a routine grayscale liver US examination, LSM was measured on the right lobe of the liver with the patient in the supine position and the machine on the "not-per-oral" setting for a minimum of 8 hours. A broadband convex transducer (1-6 MHz) was positioned on an intercostal space with a good grayscale view of the liver parenchyma, and a trapezoid color box was moved on the parenchyma, positioned deeper than 2 cm from Glisson’s capsule and away from large vessels. The scanning parameters and protocols were as follows: SWE option, standard mode; color map opacity, 50%; displayed elasticity range, 70 kPa; smoothing factor, 5; persistence, medium mode; displayed dynamic range, 62 dB; frame rate, 7 frames per second; mechanical index, 1.5; and thermal index of soft tissue, 1.2 to 1.4. The examiner asked patients to exhale slightly, then hold their breath for about 5 seconds, and a cine loop that included a SWE color map was obtained. Sequential frames were recalled until the examiner believed that the elasticity in the color box had reached a plateau. In addition, a circular region of interest (ROI; Q-box, Supersonic Imagine) was positioned within the color box for measurement of the mean and standard deviation of elasticity. Generally, the diameter of the ROI was >15 mm, but it could be changed according to the size of the measurable parenchyma. The examiners repeated the measurement sequence 5 times.
Analysis of US Images
Each set of grayscale sonograms for each patient was composed of four representative images. The key image sets of the three patient groups-no or mild fibrosis, moderate to advanced fibrosis, and LC-were randomized by another radiologist (Y.S.C.) who did not perform the US tests and was not informed regarding the clinical data of the patients. The sonograms were evaluated retrospectively in two sessions conducted more than 6 months after obtaining them. In the first session, two radiologists (W.K.J., reviewer A; Y.K., reviewer B) with 16 and 28 years of experience in abdominal imaging, respectively independently evaluated the key image sets of grayscale US while blinded to the clinical information and LSM values. They evaluated four categories of US features associated with CLD: echogenicity, echotexture, surface nodularity, and edge blunting of the liver [7]. Finally, they predicted whether patients belonged to the no or mild fibrosis, moderate to advanced fibrosis, or LC groups based on the grayscale US findings. Four weeks later, they again reviewed the image sets once informed of the LSM values, and they repeated the evaluation of the grayscale US features and prediction of the patients’ fibrosis status. The reviewers knew the reference values of the LSM in advance. On the basis of a previous study, an LSM >7.1 kPa was considered abnormal, while an LSM >10.4 kPa was considered indicative of possible LC [18].
To evaluate the grayscale US features, the two reviewers scored each finding. A score of 1 for echogenicity of the liver corresponded to homogeneity, with no difference in echogenicity between the liver parenchyma and the kidney parenchyma. A score of 3 corresponded to clearly increased echogenicity with an indefinite margin of the intrahepatic vasculature and diaphragm or to even more highly increased echogenicity. A score of 2 was given for increased echogenicity between the scores of 1 and 3. Regarding echotexture, a score of 1 was given for a uniform smooth hepatic echotexture on US, while a score of 2 corresponded to a suspicion of mildly coarse echotexture. A score of 3 was given for a clearly coarse texture and a score of 4 for a highly coarse texture. For surface nodularity, a score of 1 indicated a smooth liver surface, a score of 2 indicated a mildly irregular surface, and a score of 3 was given for a highly irregular hepatic surface. Regarding blunting of the liver edge, a score of 1 was given for a sharp liver edge, a score of 2 for a slightly blunt tip of the edge, and a score of 3 for a blunted edge.
Statistical Analysis
The correlations between US features and fibrosis grade and between subjective final diagnosis and fibrosis grade were assessed using the Spearman test. To evaluate the interobserver variability of each US feature and the final diagnosis, the weighted kappa (κ) statistic was used. A κ-value of less than 0.20 indicated poor agreement, between 0.20 and 0.39 indicated fair agreement, between 0.40 and 0.59 moderate agreement, between 0.60 and 0.79 substantial agreement, and 0.80 or higher excellent agreement. The Z-test was used to evaluate differences in correlation coefficients (ρ and κ values). The performance of grayscale US in the diagnosis of F2-stage or higher or of F4-stage fibrosis according to the METAVIR hepatic fibrosis classification system was evaluated using receiver operating characteristic (ROC) curve analysis, and the areas under the ROC curves (AUCs) and corresponding 95% confidence intervals were compared using the methods detailed by DeLong et al. [19]. The utility of LSM values in the diagnosis of significant fibrosis and LC was also evaluated. Statistical analyses were performed using SPSS for Windows (version 17, SPSS Inc., Chicago, IL, USA) and MedCalc for Windows (version 12.4.0.0, MedCalc Software bvba, Mariakerke, Belgium). A P-value of <0.05 was considered to indicate statistical significance.
Results
Patient Groups and Characteristics
Among the 46 patients who underwent liver biopsy, the numbers with F0, F1, F2, F3, and F4 METAVIR fibrosis scores were 3, 3, 12, 11, and 17, respectively. The no or mild fibrosis group consisted of 39 patients: the six F0 and F1 patients and 33 patients who did not undergo liver biopsy. The 23 patients with METAVIR fibrosis scores of F2 and F3 were classified as the moderate to advanced fibrosis group, and the 17 patients with METAVIR fibrosis scores of F4 were classified as the LC group, which served as the reference standard (Fig. 1).
The LSM values of the total group of patients ranged from 4.0 kPa to 48.6 kPa, and the mean value was 11.0±8.6 kPa. The LSM values of the no or mild fibrosis group ranged from 4.0 kPa to 9.8 kPa, with a mean of 5.7±1.3 kPa. In the moderate to advanced fibrosis group, LSM values ranged from 6.2 kPa to 40.2 kPa (mean, 15.0±9.2 kPa), while the LSM values of the LC group ranged from 5.3 kPa to 48.6 kPa (mean, 17.6±10.2 kPa). Patient information and laboratory findings are summarized in Table 1.
Effect of Being Informed of the LSM Values on the Correlation between US and Fibrosis Grades
The correlation coefficients between US grade and fibrosis grade are summarized in Table 2. After incorporating LSM values, the correlation coefficient between echotexture and fibrosis grade increased significantly for both reviewer A (0.404 to 0.697, P=0.007) and reviewer B (0.336 to 0.736, P=0.001). The correlation coefficients for reviewer A for surface nodularity (0.382 to 0.691, P=0.006) and for edge blunting (0.499 to 0.681, P=0.032) also increased. For reviewer B, the correlation coefficient for edge blunting increased significantly after incorporating LSM values (0.496 to 0.783, P=0.002), but the coefficient for surface nodularity did not increase to a significant extent (0.400 to 0.440, P=0.765). In the final US diagnosis, the correlation coefficients increased significantly for both reviewers A (0.499 to 0.782, P=0.001) and B (0.312 to 0.804, P=0.001) after the LSM values were incorporated.
Interobserver Agreement between the Two Reviewers for US Grade and Final Diagnosis
We evaluated the changes in interobserver agreement for the US feature grade and final diagnosis by grayscale US that occurred once LSM values were included (Table 3). The interobserver agreement between reviewers A and B for echogenicity, echotexture, and edge blunting was not significantly improved by adding the LSM values. Edge blunting improved from moderate to substantial (0.417 to 0.621, P=0.082) when the LSM values were incorporated, although not to a statistically significant degree. Only the interobserver agreement for surface nodularity was significantly improved by the addition of information regarding LSM values, from fair to moderate agreement (0.275 to 0.538, P=0.049). Knowledge of LSM values significantly improved agreement on the final diagnosis of hepatic fibrosis based on US features from fair to substantial (0.318 to 0.753, P<0.001).
Comparison of Diagnostic Performance for Presence of ≥F2 and F4 Fibrosis
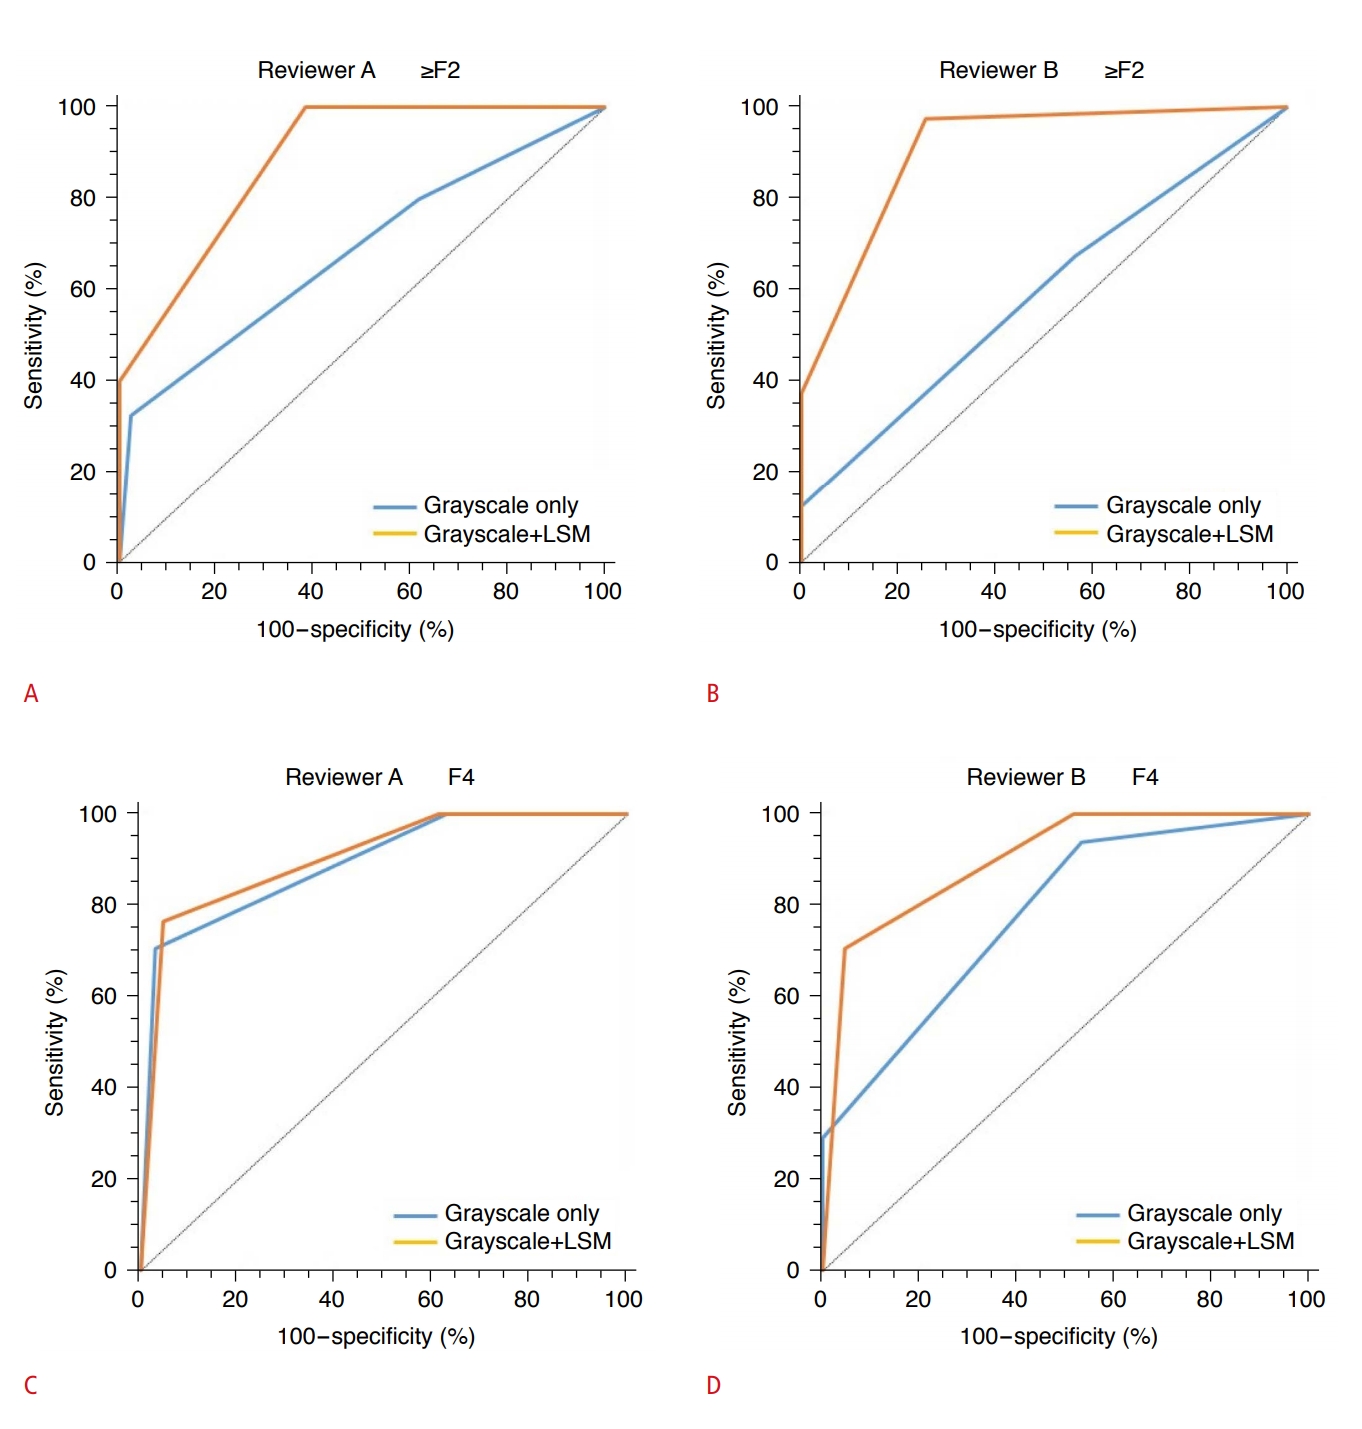
In the ROC curve analysis, the AUC values for grayscale US estimation of ≥F2 fibrosis by reviewers A and B were significantly improved by including LSM values (0.682 and 0.591 to 0.885 and 0.907, respectively; P<0.001 for both relationships). In the diagnosis of F4 fibrosis, the AUC did not increase significantly for reviewer A (0.891 to 0.904, P=0.849); for reviewer B, it increased more notably, but the increase was still not significant (0.783 to 0.900, P=0.166). The AUCs for the diagnoses of ≥F2 and F4 fibrosis using only LSM values were 0.960 and 0.829, respectively. These were not significantly different from the AUC values obtained using grayscale US findings and LSM values. The diagnostic performances for the estimation of ≥F2 and F4 fibrosis by the two reviewers are summarized in Table 4, and the changes in the ROC curves for grayscale US diagnosis of ≥F2 and F4 fibrosis with LSM values are shown in Fig. 2.
Discussion
Grayscale US is the first-line imaging method for patients with chronic liver diseases. It is inexpensive and has minimal adverse biological effects [20,21]. However, evaluation of the liver parenchyma using grayscale US is relatively subjective, and there is poor agreement between different scanners and examiners [6,10,22]. Of patients without secondary findings of portal hypertension who were suspected of LC based only on liver parenchymal echotexture and morphology on grayscale US, 20% actually had mild-to-moderate or no fibrosis (as evidenced by METAVIR scores of F0 to F2) on liver biopsy [23]. Even expert examiners have a tendency to overestimate LC, which can lead to unnecessary liver biopsy. Therefore, caution should be taken in diagnosing LC based on the liver parenchyma or morphology on grayscale US alone. Consistent US results are required to avoid confusion in the management of CLD patients in clinical practice.
In this study, the impact of including LSM values in the diagnosis of hepatic fibrosis and LC by US was evaluated. Both the correlation of grayscale US grade with the presence of hepatic fibrosis and the interobserver agreement between the two reviewers were significantly higher when LSM values were considered. Previous studies and a meta-analysis have shown LSM using 2D-SWE to have superior diagnostic accuracy to TE in the staging of hepatic fibrosis [17,18]. 2D-SWE has been found to have high sensitivity (approximately 90%) in the diagnosis of clinically significant hepatic fibrosis (≥F2) or LC (F4), while grayscale US has been shown to exhibit sensitivity between 25% and 80% even with the use of a complex scoring system. Additionally, 2D-SWE is a reliable and reproducible method for assessing liver elasticity [24]. We obtained high AUC values of 0.960 and 0.829 when significant fibrosis (≥F2) and LC (F4) were predicted using LSM. Therefore, the incorporation of LSM values is expected to improve not only the consistency of the US findings but also interobserver agreement in the grading of hepatic fibrosis.
Except for hepatic echogenicity, which correlates with hepatic steatosis, grayscale US findings related to hepatic fibrosis-echotexture, surface nodularity, and edge blunting-yielded generally improved interobserver agreement and correlation with the reference standard when LSM values were included, although the correlations varied between reviewers. In previous studies, surface nodularity was the most sensitive grayscale US feature in the detection of significant fibrosis when a high-frequency probe was used [25]. A US scoring system involving grayscale US results obtained with a high-frequency probe exhibited higher sensitivity than TE in the diagnosis of LC [26]. Nevertheless, a meta-analysis of previous studies found sensitivity varying from 12.5% to 87.5% [27]. Liver surface nodularity exhibited an excellent agreement of 0.80 according to Colli et al. [6], but those authors performed examinations using a high-frequency probe. The present study yielded an interobserver agreement of 0.275, and the correlation with the reference standard increased significantly only for reviewer A. In daily practice, low-frequency US is not sensitive as high-frequency US in the diagnosis of LC [11]. In the present study, in which a low-frequency probe was utilized, the diagnostic value of liver surface nodularity for hepatic fibrosis was considered inferior to the result expected if a high-frequency probe had been used. However, the addition of high-frequency probes to routine liver US causes examination to take longer and the process to become more complicated. In addition, such probes are difficult to utilize in patients with thick abdominal walls or large amounts of ascites, and high-frequency probes are not always available in the settings in which liver US examinations are conducted.
The combination of grayscale US and LSM in the prediction of significant fibrosis (≥F2) and LC (F4) did not yield a significantly different AUC value from LSM alone. However, interobserver agreement and the diagnostic accuracy of US grading of hepatic fibrosis significantly improved with the incorporation of information about LSM values. In particular, both reviewers exhibited better discrimination between significant fibrosis (≥F2) patients and the no or mild fibrosis group, which had relatively low AUC values in the absence of LSM data. By adding 2D-SWE-based LSM measurements to routine US practice, a non-invasive reference for hepatic fibrosis could be obtained in a single session of US examination. As a result, the variability of grayscale US findings and diagnostic impressions of the degree of hepatic fibrosis could be continuously calibrated between different US examiners.
This study has several limitations. First, it was retrospective, which may have introduced selection bias, and since most of the patients in the no or mild fibrosis group did not undergo biopsy, the homogeneity of the patient group may have been impaired. Additionally, we could not evaluate grayscale US findings in real time and instead had to assess key images retrospectively, which was thus different from the clinical setting of routine US examination. Second, we did not evaluate the use of a high-frequency probe. Several studies have reported that surface nodularity using high-frequency probes was a useful finding for detecting LC on grayscale US [6]. This study involved only lowfrequency probes, so the diagnostic performance of grayscale US may have been underestimated. However, because low-frequency probes are routinely used for hepatic US examinations, our data reflect clinical US practice. Third, the CLDs of our patients had a variety of etiologies, and hepatic morphology and LSM value could not reflect the differences between the various causes of hepatic fibrosis.
In conclusion, the correlation between US findings and the reference standard, as well as interobserver agreement on the US diagnosis of hepatic fibrosis, improved when information on LSM values was incorporated. Discrimination of significant fibrosis (≥F2) from no or mild fibrosis was also significantly improved. Thus, incorporation of LSM obtained using 2D-SWE improves the diagnostic performance of grayscale US examination of hepatic fibrosis in CLD patients.
 Download Citation
 PDF Links
 PubReader
 ePub Link
 Full text via DOI
 Full text via PMC


