

 Print
Print facebook
 twitter
 Linkedin
 google+

Introduction
Increased levels of triglyceride and free fatty acids cause ectopic fat depositions in the liver, heart, muscles, and pancreas in a condition called steatosis. Ectopic fat accumulation in the liver, termed nonalcoholic fatty liver disease (NAFLD), is associated with an increased risk of diabetes, metabolic syndrome, and cardiovascular disease [1-4]. Similar to this condition, ectopic fat deposition in the pancreas is known as pancreatic steatosis or fatty pancreas, which has recently received increasing attention. Although many studies have revealed that fatty pancreas is also associated with an increased risk of type 2 diabetes, NAFLD, and metabolic risk factors, the association is not fully understood [5-11].
Ultrasonography (US) has traditionally been used to evaluate fat accumulation in the pancreas [12,13]. However, there is neither a widely accepted modality nor a cutoff point for diagnosing fatty pancreas [14]. Fatty pancreas is defined as a hyperechoic pancreas (HP) on US compared with the echogenicity of the liver or renal cortex [6,8,15]. Although a few studies have been reported with a small number of selected participants [10,16,17], there have been no large-scale, longitudinal studies focusing on the severity of fatty pancreas and glycemic progression. Additionally, the diagnostic criteria are slightly vague and can be occasionally challenging with respect to the possible coexistence of NAFLD or a limited sonic window, especially in mild fatty pancreas.
Meanwhile, a strong association between NAFLD and fatty pancreas has been reported in previous studies [18-20]. The prevalence of this concomitant condition could be up to 50% in both Western and Asian countries, and can most likely be attributed to the similar pathogenesis associated with metabolic risk factors. However, data are limited on the association of isolated fatty pancreas with glycemic progression independent of NAFLD and its synergistic effect on the progression of diabetes.
In daily practice, we encounter HP of varying severity with or without concomitant NAFLD, diabetes, or other cardiometabolic risk factors. However, whether the severity of HP is independently associated with future glycemic progression is unclear. Moreover, whether the severity of HP is associated with the aforementioned diseases independently of NAFLD remains largely unknown.
Therefore, this study aimed to evaluate the association between the severity of HP on US and glycemic progression with the influence of concomitant NAFLD.
Materials and Methods
Compliance with Ethical Standards
This retrospective study was approved by the institutional review board Chung-Ang University Hospital in Korea (1811-016-16223), which waived the requirement for informed consent owing to the retrospective study design.
Sample Size
In a previous study [17], the prevalence of HP on US was around 15% (147+326/8,856=15.43%). The hazard ratio (HR) for glycemic progression in participants with HP on US was 1.54. On the basis of the HR of 1.54 and 80% power with a 5% significance level, the minimum sample size for estimating glycemic progression was calculated to be 261. Additionally, considering the development of diabetes or prediabetes on follow-up (5% and 14%, respectively), the minimum total number of samples was determined to be 1,383.
Participants
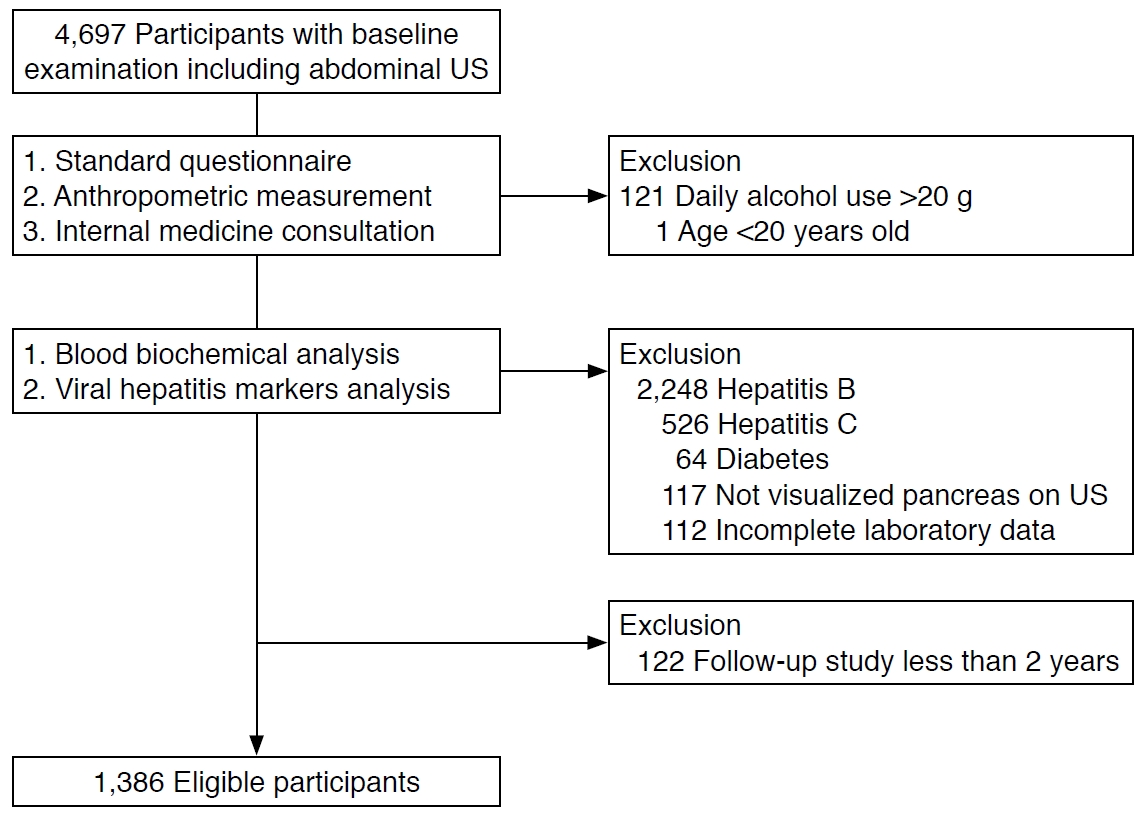
Between January 2008 and December 2014, we analyzed individuals who underwent US for health screening at a tertiary hospital. Because a substantial proportion of these individuals regularly attended health examinations, those who had undergone a follow-up examination at least 2 years after the baseline examination were included in this study. We excluded individuals who met the following criteria: (1) aged <20 years, (2) estimated alcohol consumption >20 g/day, (3) a history of viral hepatitis or seropositive for hepatitis B and C virus antigen, (4) a history of liver or pancreas surgery or medical renal disease, (5) use of diabetes medications or a diagnosis of diabetes, and (6) incomplete laboratory data from the initial and/or follow-up examinations. The flow diagram of this study is shown in Fig. 1.
Clinical and Laboratory Parameters
Data on age, sex, comorbidities including diabetes, alcohol consumption, and medications used were collected. All participants underwent height and body weight measurements while wearing light clothing to calculate the body mass index (BMI, in kg/m2). For waist circumference, we used a tape measure and measured in the middle part between the lowest rib and the iliac crest of the pelvis, horizontal to the ground with the participant in an upright position. Systolic and diastolic blood pressures were recorded in the sitting position.
After overnight fasting, all participants underwent blood tests including fasting blood glucose, plasma hemoglobin A1c (HbA1c), total cholesterol, triglyceride, high-density lipoprotein, low-density lipoprotein, blood urea nitrogen, and creatinine tests.
Metabolic syndrome was defined according to the updated National Cholesterol Education Program Adult Treatment Panel III and the abdominal obesity criteria of the Korean Society for the Study of Obesity. Diabetes was diagnosed according to the American Diabetes Association 2014 recommendations (HbA1c ≥6.5%, fasting glucose level ≥126 mg/dL, or 2-hour postprandial plasma glucose level ≥120 mg/dL). Prediabetes was diagnosed according to the American Diabetes Association 2014 recommendations (fasting glucose level, 100-125 mg/dL; 2-hour postprandial glucose level, 140-199 mg/dL; or HbA1c, 5.7%-6.4%).
Glycemic progression was measured as an endpoint in our follow-up analysis and was defined as progression from normoglycemia to prediabetes or diabetes or progression from prediabetes to diabetes.
Analysis of Abdominal US Images
After overnight fasting, the participants underwent abdominal US, performed by designated board-certified radiologists using a 3.5-MHz convex-array probe (LOGIQ7, GE Healthcare, Milwaukee, WI, USA). The radiologists were blinded to the laboratory findings.
To grade NAFLD and HP, two radiologists (J.O. and H.J.P., with 3 and 14 years of experience in abdominal US, respectively) independently reviewed abdominal US images on a commercial workstation with a 2,000×2,000 picture archiving and communication system monitor (Centricity, GE Healthcare). Both radiologists were blinded to other clinical and laboratory parameters. In cases of disagreement, a third observer (E.S.L. with 14 years of experience in abdominal US) was consulted to reach a consensus.
The US diagnostic criteria for NAFLD were increased parenchymal echogenicity compared with the right renal cortex as well as blurring of the hepatic vasculature and an echogenic diaphragm. Liver echogenicity was graded using a 4-point scale according to the criteria described by Needleman et al. [21] as follows: (1) normal, equal to, or slightly greater echogenicity than that of the renal cortex; (2) mild, diffusely increased hepatic echogenicity, but periportal and diaphragmatic echogenicity is still appreciable; (3) moderate, diffusely increased hepatic echogenicity obscuring periportal echogenicity, but diaphragmatic echogenicity is still appreciable; (4) severe, diffusely increased hepatic echogenicity obscuring periportal as well as diaphragmatic echogenicity.
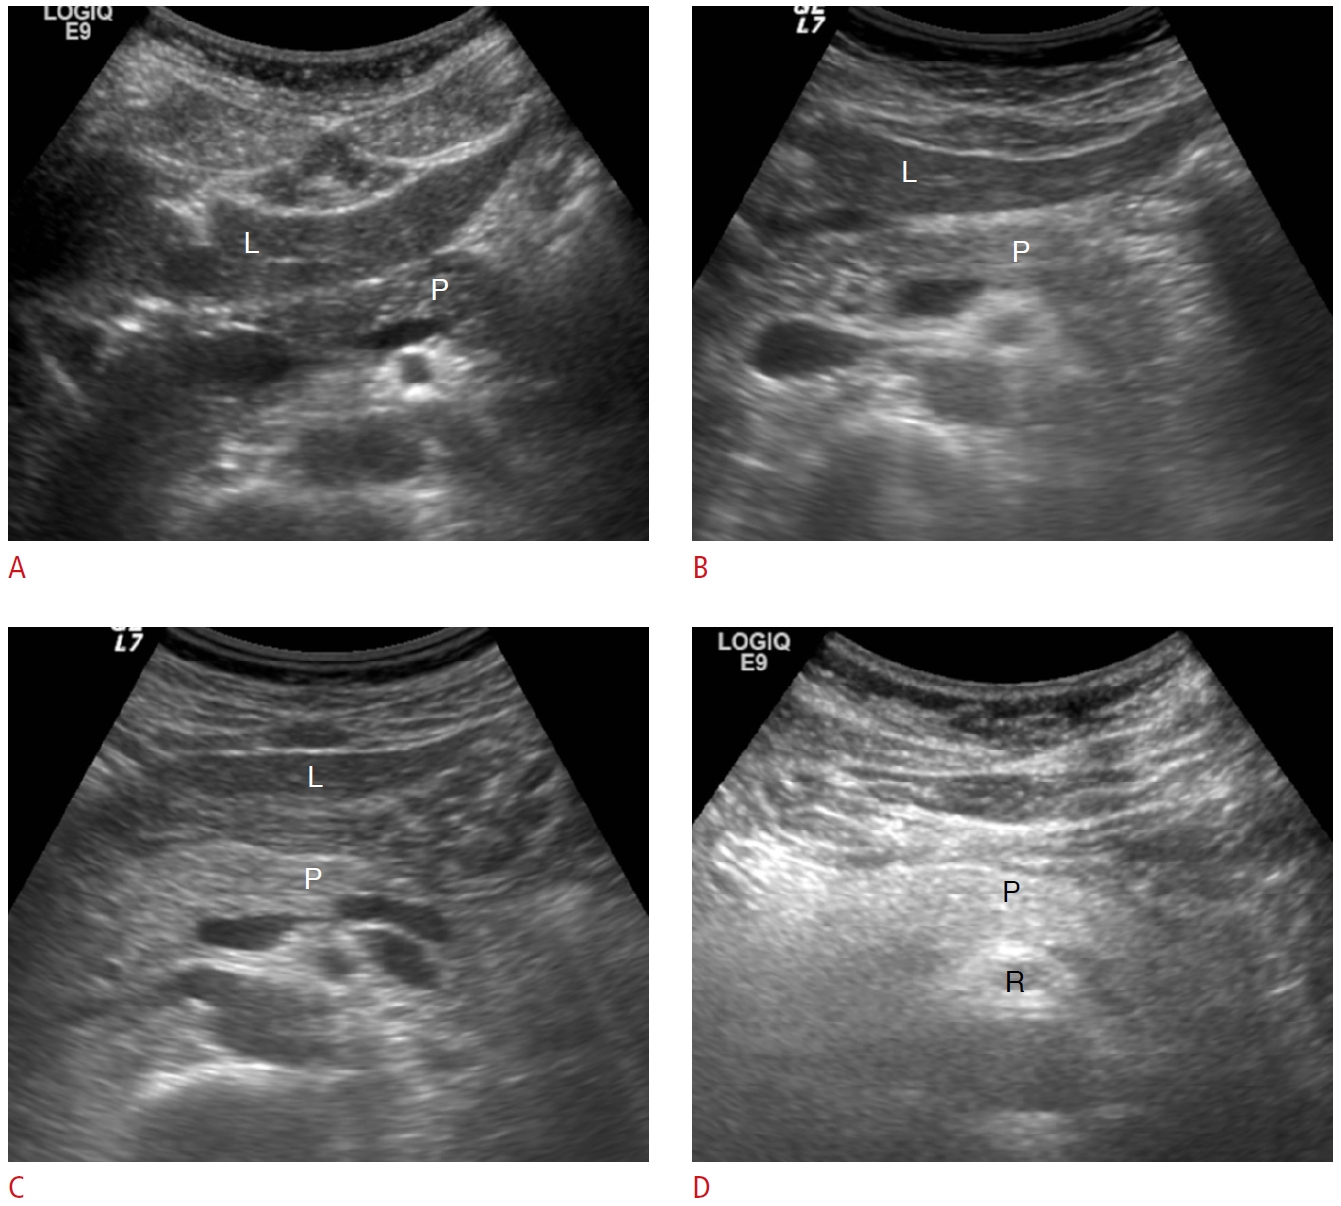
Compared with the normal echogenicity of the pancreas, which is similar to the normal liver or kidney parenchymal echogenicity, the US diagnostic criterion for HP was higher echogenicity in the pancreas than that in the left lobe of the liver under the same US window. If the left hepatic lobe was not displayed in the same window for a direct comparison or showed increased echogenicity, we compared the echogenicity of the pancreas with that of the right kidney and spleen indirectly under two parallel US windows as described by Choi et al. [6] and Al-Haddad et al. [18]. Pancreatic echogenicity was graded using a 4-point scale, comparing with the echogenicity of the adjacent left hepatic lobe and retroperitoneal fat: (1) normal, similar echogenicity to the liver; (2) mild, slightly higher echogenicity than the liver; (3) clearly higher echogenicity than the liver, but lower echogenicity than the retroperitoneal fat; and (4) similar or higher echogenicity compared with the retroperitoneal fat (Fig. 2).
Statistical Analysis
All continuous variables are expressed as mean±standard deviation. The study participants were divided into two groups based on glycemic status: the normal group and the glycemic progression group, defined as progression from normoglycemia to prediabetes or diabetes or progression from prediabetes to diabetes on follow-up. The interobserver agreements for the severity of NAFLD and HP on US between the two radiologists were analyzed using the κ statistic and interpreted as follows: poor, <0.20; fair, 0.20-0.39; moderate, 0.40-0.59; substantial, 0.60-0.79; and almost perfect, ≥0.80.
We divided HP using two criteria according to US severity for determining the optimal cutoff affecting glycemic progression as follows: the fatty pancreas 1 (FP1) criterion (normal vs. ≥mild HP) and the fatty pancreas 2 (FP2) criterion (normal and mild HP vs. moderate and severe HP). On the basis of the above criteria, the participants were subdivided into four groups according to the presence of NAFLD and HP (FP1 and FP2) (Table 1). Continuous variables among the four study groups were compared using analysis of variance. The Fisher exact test or the chi-square test was used to analyze differences in categorical variables among groups. To identify factors related to glycemic progression controlling for confounding factors, univariable and multivariable Cox proportional hazard regression models were applied. Additionally, to identify independent associations of glycemic progression with HP and NAFLD, we analyzed groups 1 and 2 as reference groups.
Survival curves for glycemic progression were drawn according to the status of NAFLD, HP, or combination groups of NAFLD and HP. The cumulative incidence of glycemic progression was compared using the log-rank test between groups according to the status of NAFLD, HP, or their combinations. Additionally, to identify the relationship with glycemic progression according to the severity of HP on US, a Cox proportional hazard model was applied.
All statistical analyses were performed using R version 3.5.0 (The R Foundation for Statistical Computing, Vienna, Austria). A P-value of <0.05 was considered to indicate statistical significance.
Results
Clinical and Ultrasonographic Characteristics of the Study Participants
In total, 1,386 participants were recruited for the database analysis (Fig. 1). Among them, 786 (56.7%) were men. The mean age and BMI were 47.2±10.6 years and 23.5±3.2 kg/m2, respectively, and 164 participants (11.8%) had metabolic syndrome. At the initial examination, 1,099 participants (79.2%) were normoglycemic and 287 participants (20.6%) had prediabetes. The number of participants with normal, mild, moderate, and severe degrees of echogenicity on US was 855 (61.7%), 283 (20.4%), 186 (13.4%), and 62 (4.5%) in the liver and 417 (30.1%), 405 (30.0%), 368 (26.6%), and 196 (14.1%) in the pancreas, respectively. Among the participants with mild fatty pancreas, 30.9% (125 of 405) showed concomitant NAFLD. The interobserver agreement for the severity of NAFLD and HP on US was almost perfect (κ=0.85) and substantial (κ=0.78), respectively.
Follow-up Analysis of Glycemic Progression
During the median follow-up period of 5.9 years (range, 2.0 to 10.4 years), 262 of the 1,386 participants developed glycemic progression (incidence rate, 189 per 1,000 person-years), including 19 participants who developed incident diabetes (incidence rate, 13.7 per 1,000 person-years).
The demographic characteristics and biochemical data stratified according to the four study subgroups are summarized in Table 2 (FP1 criterion) and Table 3 (FP2 criterion). Using the FP1 criterion, the prevalence of isolated HP (group 3) and all HP (groups 3 and 4) was 33.0% (458 of 1,386) and 36.9% (511 of 1,386), respectively. The prevalence of isolated NAFLD (group 2) and all NAFLD (group 2 and 4) was 1.4% (20 of 1,386) and 38.3% (531 of 1,386), respectively. Using the FP2 criterion, the prevalence of isolated HP (group 3) and all HP (groups 3 and 4) was 12.8% (178 of 1,386) and 27.8% (386 of 1,386), respectively. The prevalence of isolated NAFLD (group 2) and all NAFLD (group 2 and 4) was 10.5% (145 of 1,386) and 38.3% (531 of 1,386), respectively.
Using the FP1 and FP2 criteria, participants with isolated NAFLD had higher body weight, BMI, waist circumference, blood pressure, triglyceride levels, and cholesterol levels than those with isolated HP. However, participants with isolated HP showed higher fasting blood glucose levels and HbA1c values than those with isolated NAFLD. Among the participants with fatty pancreas, 52.7% (511 of 969) of those grouped using the FP1 criterion and 68.4% (386 of 564) of those grouped using the FP2 criterion showed concomitant NAFLD.
Cumulative Incidence of Glycemic Progression
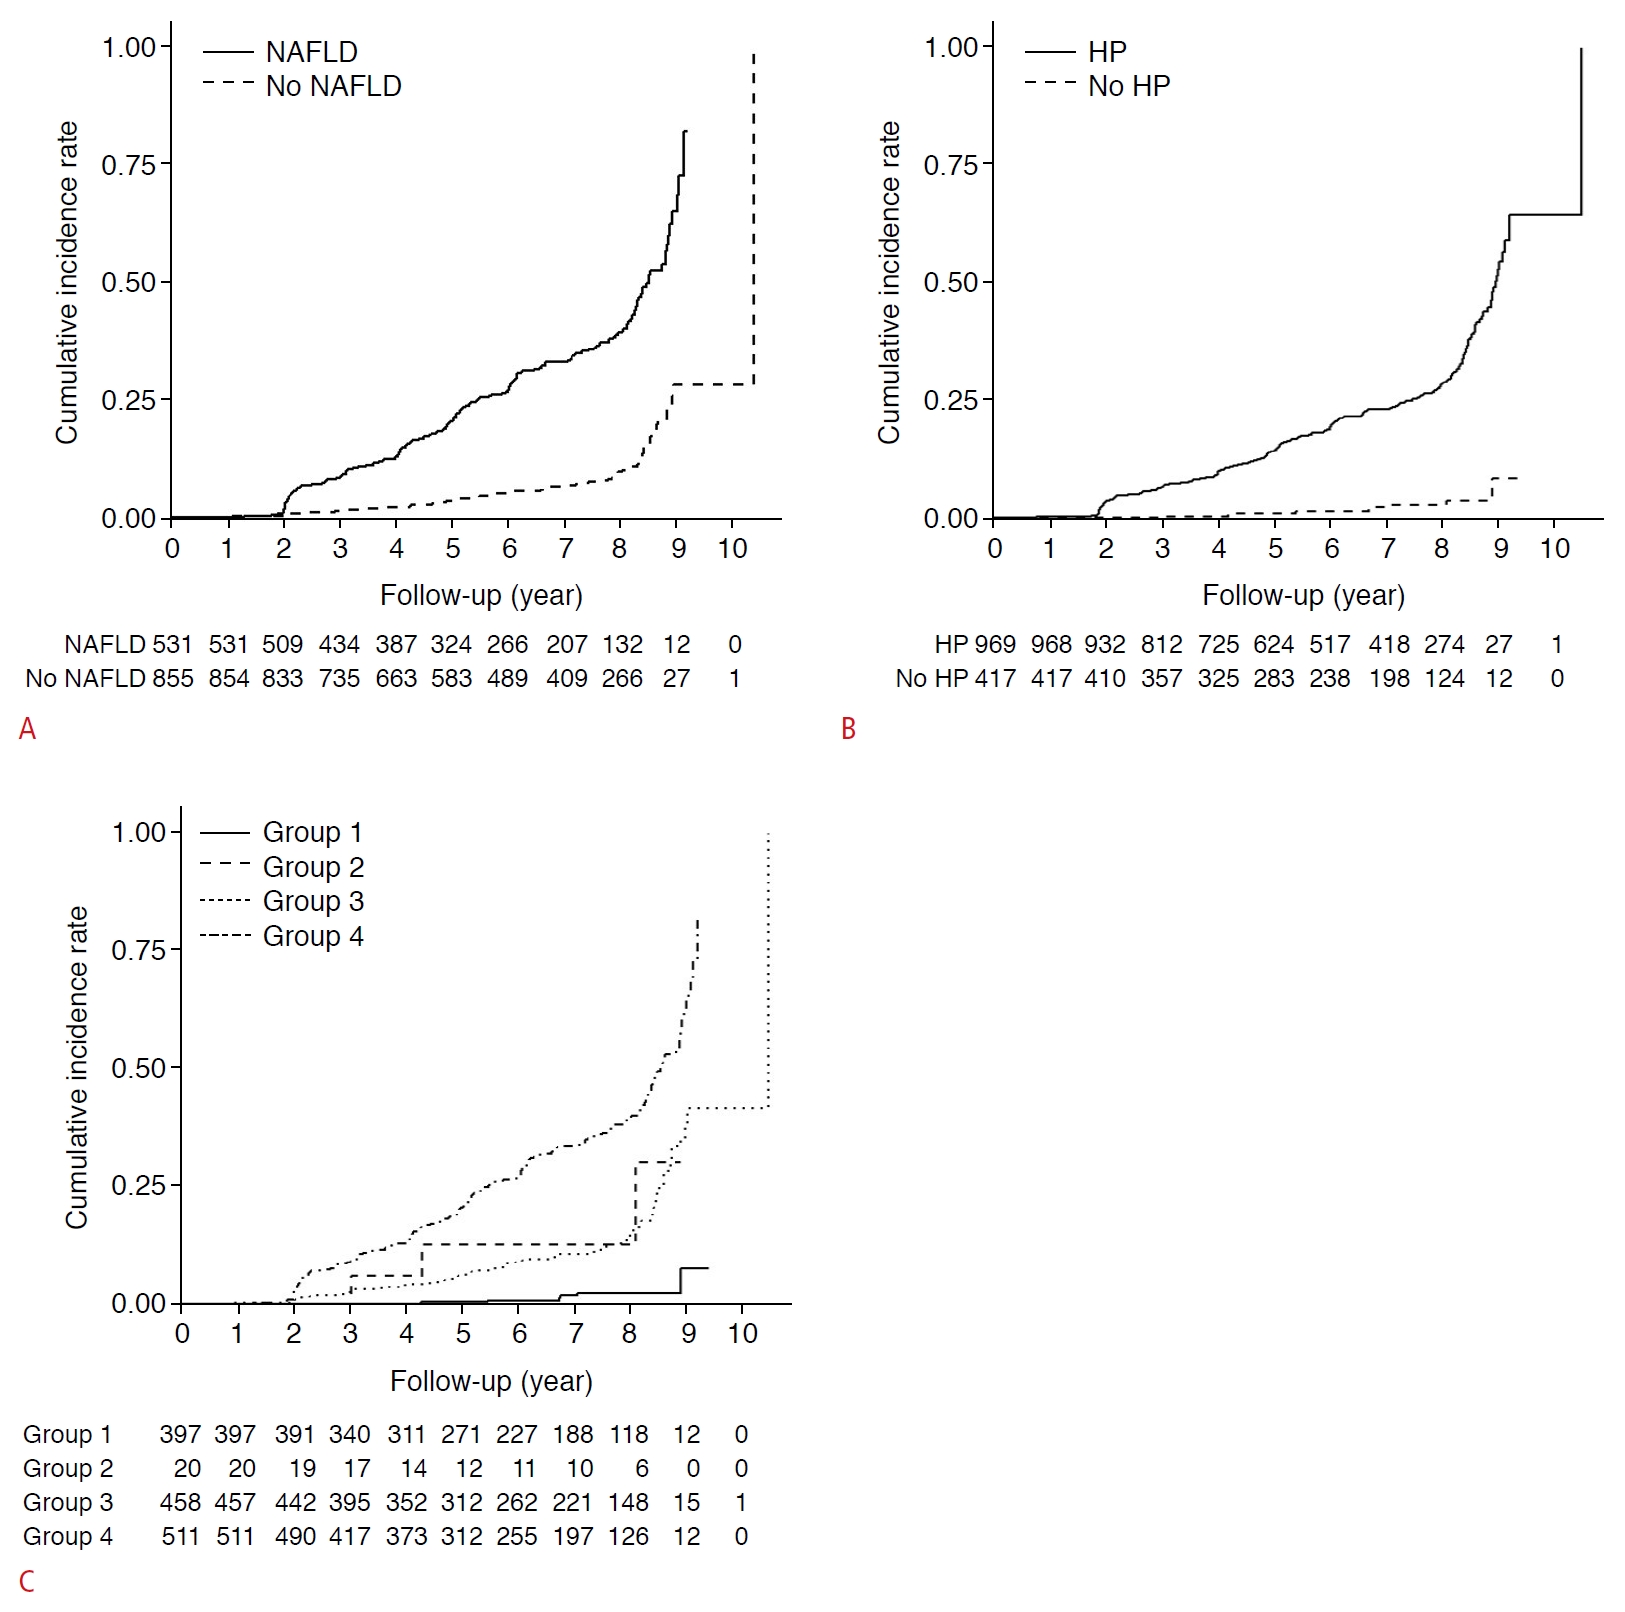
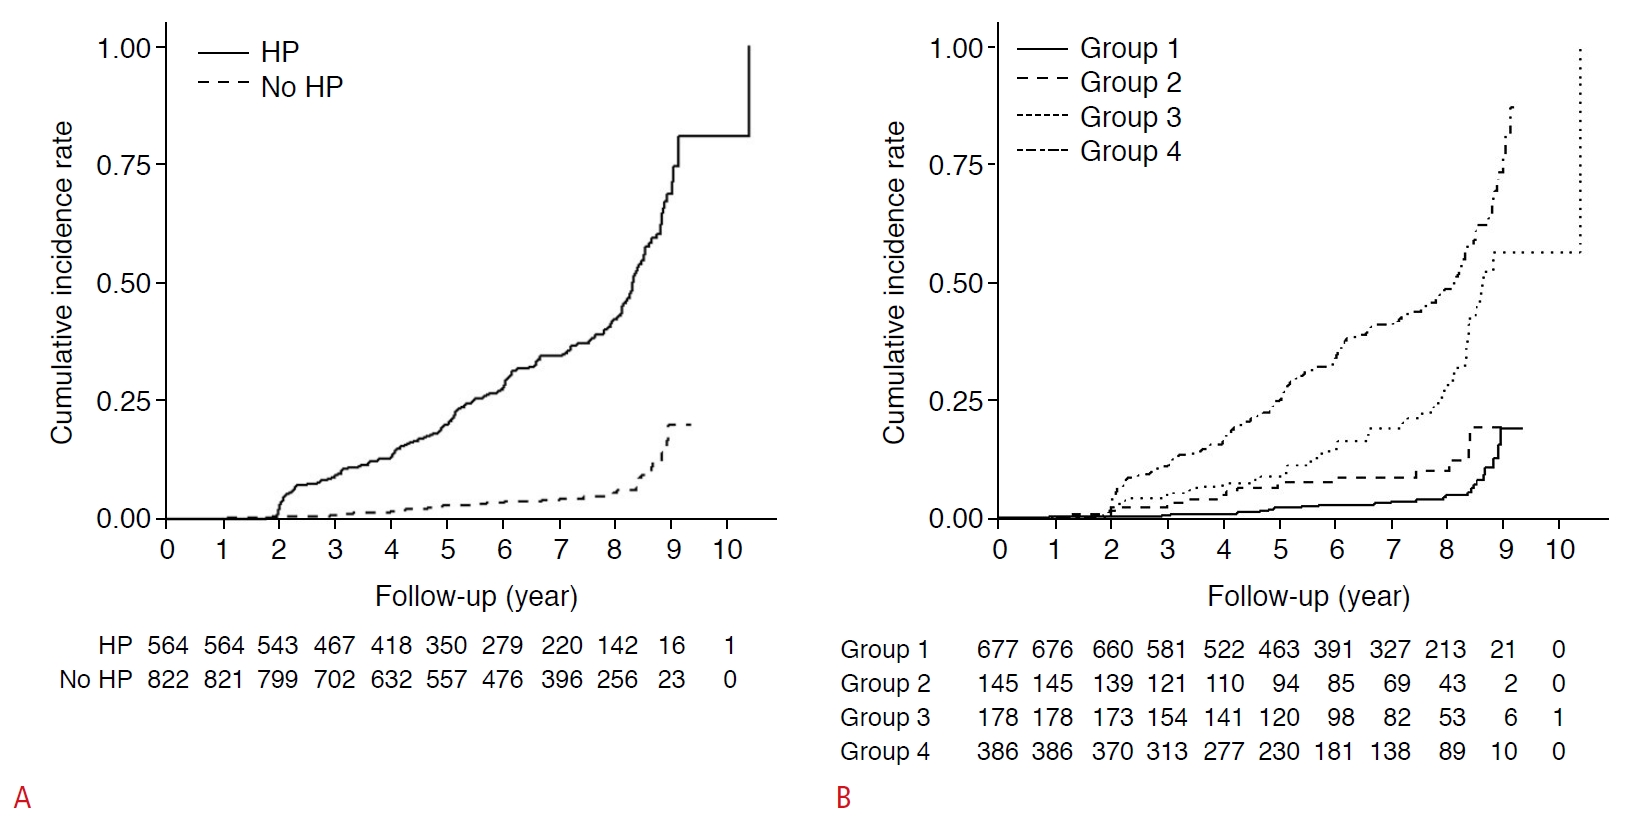
Table 4 and Figs. 3 and 4 show the cumulative incidence of glycemic progression among the four subgroups according to the FP1 and FP2 criteria. The presence of NAFLD or HP showed cumulative aggravation of glycemic progression and was associated with a higher probability of glycemic progression in both criteria (P<0.001 for both) (Figs. 3A, B, 4A). Using the FP1 criterion, although all subgroups showed cumulative aggravation for glycemic progression, no significant differences between groups 2 and 3 (P=0.793) and between groups 2 and 4 (P=0.141) were observed (Fig. 3C). Using the FP2 criterion, however, the probability of glycemic progression across the four subgroups showed cumulative aggravation for NAFLD and HP (all P<0.05) (Fig. 4B). Isolated HP showed a higher probability of glycemic progression than isolated NAFLD using the FP2 criterion (P<0.001). The highest probability of glycemic progression was observed in the subgroup with both NAFLD and HP (group 4, P<0.001) using the FP2 criterion.
Cox Proportional Hazard Regression Models
Table 5 show the results of univariable analysis performed to evaluate the associations of NAFLD and HP with the probability of glycemic progression. Using the FP1 and FP2 criteria, the other three subgroups showed a significant difference from group 1, used as the reference for glycemic progression (all P<0.05). However, using the FP1 criterion with group 2 as the reference, no significant difference was identified in group 3 (P=0.802) and group 4 (P=0.124) for glycemic progression. Conversely, using the FP2 criterion, these three subgroups showed a significant difference in glycemic progression (all P<0.05). In other words, isolated HP of more than a moderate degree (group 3) and the presence of both HP and NAFLD were associated with significantly higher probabilities of glycemic progression than isolated NAFLD (HR, 2.59; P=0.002 and HR, 5.26; P<0.001, respectively).
In the univariable analysis using the FP2 criterion, to clarify which factor and group could best explain the association with glycemic progression, further analyses were performed by adding variables in five steps (Table 6, Supplementary Table 1). In the first step (model 1), each group (groups 1, 3, and 4), age, and sex were used as the independent variables. In model 2, weight, BMI, and waist circumference were added to model 1. In model 3, triglyceride, low-density lipoprotein, high-density lipoprotein, and cholesterol, which are known factors related to fatty liver, were added to model 2. In model 4, plasma glucose and HbA1c were added to model 3. Model 5 was a fully adjusted model. The multivariable survival analysis found that isolated HP (group 3) and combined HP and NAFLD (group 4) had the highest positive associations with glycemic progression in models 1, 2, and 3. Even after adjusting for glycemic parameters, the groups showed a significantly higher probability of glycemic progression than group 2 as a reference. In the fully adjusted model, group 4 revealed a significantly higher probability of glycemic progression than HbA1c.
Effect of HP Severity on Glycemic Progression
The rate of glycemic progression according to the severity of HP was as follows: 8.1% (33 of 405) in patients with mild HP, 28.3% (104 of 368) in patients with moderate HP, and 59.2% (116 of 196) in patients with severe HP. To identify the relationship of glycemic progression according to the severity of HP on US, a Cox proportional hazard model was used. On univariable survival analysis, HP of all degrees and all clinical variables, except creatinine, were significantly correlated with glycemic progression (P<0.05). In the fully adjusted model, the HR for glycemic progression increased with the severity of HP (HR, 2.718; P=0.009 in mild HP; HR, 6.365; P<0.001 in moderate HP; and HR, 8.984; P<0.001 in severe HP) (Supplementary Table 2). Additionally, NAFLD, fasting glucose, HbA1c, and creatinine were also significant predictors of glycemic progression (P<0.05).
Discussion
Our study showed that the presence of NAFLD or HP was associated with a high probability of glycemic progression. Further, an independent association was identified between HP and glycemic progression independent of NAFLD during the follow-up. In particular, isolated HP of a moderate or higher degree was more highly associated with glycemic progression than isolated NAFLD (HR, 2.59; P=0.002). Additionally, the presence of both HP and NAFLD (FP2, group 4) showed the most significant association with glycemic progression independent of clinical parameters. Although isolated HP of a mild or higher degree (FP1) and isolated NAFLD were also associated with an increased probability of glycemic progression, there was no significant difference between the subgroups.
In this study, we divided the cutoff value of HP into mild and moderate degrees. The normal echogenicity of the pancreas is equal to or slightly greater than that of the liver [22,23]. However, in many previous studies, fatty pancreas was simply defined as higher echogenicity than that of the liver or renal cortex on US or endoscopic US. This diagnostic criterion for fatty pancreas is slightly vague and can occasionally be challenging with respect to the possible concurrence of NAFLD. The prevalence of fatty pancreas in previous studies varied widely, from 8.5% to 61.4% [6,17,24-28], probably owing to the lack of a widely accepted imaging modality or a cutoff point for diagnosing fatty pancreas. In this study, the prevalence of fatty pancreas was 69.9% using the FP1 criterion and 40.6% using the FP2 criterion, and this wide discrepancy was attributed to mild fatty pancreas (29.3%). Therefore, for an accurate diagnosis of fatty pancreas, we believe that a similar or mildly lower echogenicity compared with the retroperitoneal fat or a definite increase in echogenicity compared with the renal cortex can be suitable diagnostic criteria.
In humans, pancreatic fat deposition has a close association with insulin resistance, NAFLD, increased BMI, and metabolic syndrome [27,29]. Many previous studies have indicated that diabetes is independently associated with fatty pancreas and vice versa. Fat deposition in the pancreas may contribute to a loss of β-cell mass and function, which can lead to the development of diabetes [27,30]. Conversely, as a consequence of insulin resistance, β-cell apoptosis occurs with replacement by adipose tissue in the pancreas. In this study, we demonstrated that isolated HP was independently associated with glycemic progression, which is in close agreement with the result of Hung et al. [17].
Furthermore, obesity also leads to fat infiltration in the pancreas related to circulating free fatty acids, which also drive the development of NAFLD. A strong association between fatty pancreas and NAFLD has been reported in several studies [20,24,25,31,32], and the prevalence of concurrent NAFLD with fatty pancreas on US has been reported to be up to 67.9% [8]. This concomitant phenomenon is attributed to the same possible pathogenesis [33]. Similarly, a considerable number of participants with fatty pancreas in our study had concomitant NAFLD (52.7% and 68.4% using the FP1 and FP2 criteria, respectively). To identify the isolated effect of fatty pancreas on glycemic progression, we divided the study group into four subgroups. Although isolated NAFLD and isolated HP were both strongly associated with glycemic progression in our study and in a previous study [17], there was no significant difference regarding glycemic progression between the groups using the FP1 criterion in our study and in a previous study [17]. However, in our study, isolated HP of a moderate or higher degree showed a more significant association with glycemic progression than isolated NAFLD. This indirectly suggests that a moderate or higher degree of fatty pancreas can be considered a predictor of glycemic progression. In this respect, these findings are different from those of the previous study.
In the present study, participants with both NAFLD and HP (group 4, both the FP1 and FP2 criteria) showed the highest glycemic progression risk. Some researchers have shown a synergistic effect on glycemic progression [33,34]. Individuals with nonalcoholic steatohepatitis and fatty pancreas had a higher prevalence of prediabetes and diabetes as well as higher glucose parameters than those with nonalcoholic steatohepatitis alone. As shown in the above study, it is believed that fatty liver and fatty pancreas may influence pancreas islet cell function through mechanisms that act together or separately. A study of the effects of fatty pancreas on the pathogenesis of diabetes is still under way; however, studies on the effects of pancreas islet function coexisting with fatty liver are also needed.
In this study, the risk for glycemic progression significantly increased with the severity of HP independent of NAFLD or other clinical parameters (HR, 2.718 in mild HP; 6.365 in moderate HP; and 8.984 in severe HP). Although there is convincing evidence that fatty pancreas increases the risk of diabetes, no studies have evaluated glycemic progression according to the severity of HP. In studies on NAFLD, the incidence rate of diabetes progressively increased according to the severity of NAFLD on US, and more severe NAFLD was related to a higher risk of glycemic progression [35,36]. On the basis of the similar pathogenesis of fatty pancreas and NAFLD, we speculate that our results could be similar to those of studies on NAFLD. However, further validated analyses are needed with more participants.
This study had a few limitations. First, the prevalence of fatty pancreas was higher (69.9% using the FP1 criterion and 40.6% using the FP2 criterion) than has been reported in previous studies. However, as mentioned above, its prevalence has been reported to vary widely (8.5%-61.4%), which can be attributed to ambiguous diagnostic criteria and insufficient evidence for the severity of fatty pancreas. We believe that the prevalence of fatty pancreas in our study is acceptable and that a large sample size would be beneficial for generalization to a larger population of interest. Further studies are warranted to clarify the effects of fatty pancreas. Second, our study included a small number of patients with isolated NAFLD using the FP1 criterion. We speculate that a reason for this could be the considerable number of participants with concurrent NAFLD with mild HP (30.9%, 125 of 405). Additionally, the number of patients with diabetes was relatively very small. Because our study included only participants who attended health screening evaluations, these patients can be followed up at the department of endocrinology. Therefore, further studies with a larger number of participants are needed to validate our results. Third, this was single-center study on an Asian population and the follow-up period was relatively short (2.0-10.4 years). The follow-up period may not have been sufficient to evaluate the association between fatty pancreas and glycemic progression. Therefore, similar studies with a longer follow-up period are needed to verify our results in other populations. Fourth, as this study was conducted on participants who underwent health screening, the study sample is not fully representative of the general healthy population. Fifth, our study did not use the homeostatic model assessment of insulin resistance to evaluate insulin resistance because it is not routine laboratory data for health screening participants in our hospital. However, several previous studies [37,38] alternatively assessed fasting glucose levels or HbA1c as markers of insulin resistance. Therefore, we believe our results can be considered acceptable. Sixth, interobserver and intraobserver variability as well as variability of US measurements with different machines might have affected the overall outcomes. Although the interobserver agreement of fatty pancreas on US in our study was similar to that reported by a previous study [10], with substantial agreement (κ=0.78 vs. κ=0.63), research on intraobserver variability and variability across different US machines is insufficient. Therefore, further research is required to validate our results. Finally, we had no data on the histologic evaluation of the pancreas. However, a pancreatic biopsy is very invasive and, therefore, not suitable for practice in healthy participants. Instead, this study used one of the best noninvasive methods for evaluating fat in the liver and pancreas, which has been proven in previous studies to be a reliable, reproducible, and noninvasive screening tool for fatty pancreas [20,27,39,40].
In conclusion, an increasing severity of HP on US is significantly correlated with glycemic progression. Moreover, isolated HP of more than moderate severity is a relevant factor for predicting glycemic progression independent of NAFLD. Therefore, the severity of pancreatic echogenicity, particularly a more than moderate degree, can be considered as an early predictor of glycemic progression and could have potential benefits in clinical practice.
 Download Citation
 PDF Links
 PubReader
 ePub Link
 Full text via DOI
 Full text via PMC


