

 Print
Print facebook
 twitter
 Linkedin
 google+

Introduction
Chronic liver disease (CLD) stemming from hepatitis B or C viral infection, alcohol abuse, and nonalcoholic fatty liver disease is a serious health concern worldwide [1], as liver fibrosis, its most common outcome, often results in cirrhosis, liver failure, and portal hypertension [2]. The progression of fibrosis to cirrhosis is also accompanied by a number of sequelae, including distortion of the hepatic architecture and vasculature, deterioration of hepatic function, and increased risk of hepatocellular carcinoma (HCC) [3]. A previous investigation showed that the amount and progression of liver fibrosis were factors determining the prognosis and management of patients with this disease [4]. In addition, recent research on the molecular pathogenesis of liver fibrosis has shown that hepatic cellular recovery may be possible with the removal of fibrogenic stimuli [5]. Therefore, although it may be challenging, monitoring liver fibrosis remains an important clinical endeavor [6-8].
Liver biopsy has been considered the reference standard for the assessment of liver fibrosis to date. However, this assumption has recently been challenged owing to increasing awareness of its drawbacks [9,10] including invasiveness leading to severe complications [11], sampling error [12], and considerable interand intra-observer variability [13-15]. Thus, in recent years, the use of noninvasive assessments of liver fibrosis has experienced explosive growth, and numerous noninvasive methods, ranging from serum assays to imaging techniques, have been developed [10]. In particular, noninvasive imaging techniques such as transient elastography (TE), shear wave elastography (SWE), and magnetic resonance elastography have played increasingly important roles in assessments of liver fibrosis [16-19]. Indeed, several studies have already demonstrated that liver stiffness (LS) measurements from TE (FibroScan, Echosens, Paris, France) correlate well with advanced fibrosis of the liver [20,21] and that the diagnostic performance of point SWE (pSWE), and 2-dimensional SWE (2D-SWE) using an acoustic radiation force impulse to generate shear waves was similar to that of TE according to a meta-analysis [17]. The major benefit of ultrasound (US)-based SWE techniques over TE are their add-on function during B-mode imaging, which can allow the assessment of the underlying liver morphology and screening for HCC in addition to stiffness measurements [20]. Yet, although any systemic bias would be critically important to rule out during the diagnosis and follow-up of patients with CLD, few studies to date have explored the reproducibility of the numerous types of SWE systems [22,23]. According to a recent experimental phantom study performed by the Ultrasound Shear Wave Speed Technical Committee of the Radiological Society of North America Quantitative Imaging Biomarker Alliance, a statistically significant difference in shear wave speed estimates among commercial SWE systems was reported, on the order of 12%, although these findings have yet to be validated in clinical studies [1,24]. Furthermore, the percentage of unreliable LS measurements using SWE techniques was estimated to range between 6.7% and 10.4% for pSWE techniques and between 10.2% and 23% for 2D-SWE techniques [22,25-28]. Based on these results, we hypothesized that considerable variation between SWE systems would also be observed in patients.
Therefore, we prospectively evaluated the technical success rate, reliability of LS measurements, and inter-platform reproducibility of LS measurements for two kinds of pSWE techniques and 2D-SWE using the comb-push (CP) technique in patients with CLD.
Materials and Methods
This prospective study was performed with approval from our Institutional Review Board. This prospective study was planned to be performed for 4 months, and the expected number of patients was 90. Written informed consent was obtained from all patients prior to enrollment in this study.
Study Population
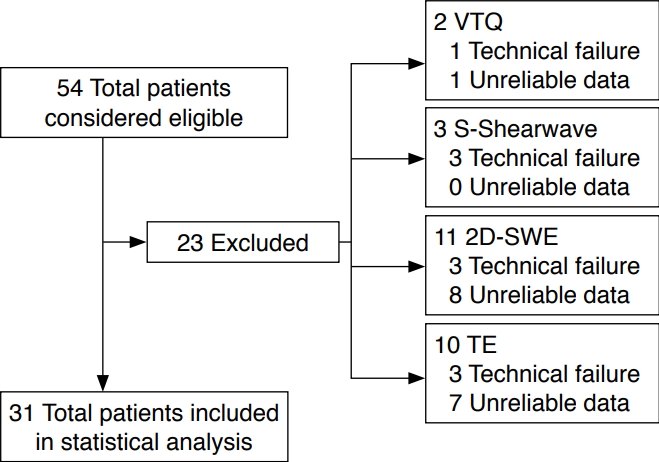
Among patients who were referred to the Department of Radiology at our institution for image-guided tumor ablation between May and September 2017, those with suspected CLD or liver cirrhosis who agreed to participate in this study were enrolled. The exclusion criteria were as follows: (1) age younger than 18 years; (2) patients who could not hold their breath for longer than 5 seconds; (3) patients who had undergone right hepatectomy; and (4) patients who had multiple treated tumors in the right lobe of the liver. In total, 54 patients were included in our study. US examinations including SWE were performed to estimate liver fibrosis and portal hypertension prior to tumor ablation.
The technical success rate and reliability of measurements of the three SWE techniques were assessed in all 54 patients. However, comparisons of LS measurements between the techniques were done only in patients in whom reliable LS values were obtained using all three SWE systems and TE. Therefore, only 31 patients (24 men, 7 women; mean age, 66.6┬▒9.49 years; age range, 38 to 80 years) were included for the comparison of inter-platform reproducibility of the SWE techniques after excluding seven cases of technical failure and 16 cases of unreliable results from one or more techniques (Fig. 1). The body mass index (BMI) of all patients was recorded (mean BMI, 23.5┬▒3.30 kg/m2; range, 18.2 to 30.7 kg/m2). The etiologies of CLD in our study patients were chronic hepatitis B (n=26, 83.9%), chronic hepatitis C (n=2, 6.5%), and chronic non-viral hepatitis such as nonalcoholic steatohepatitis, alcoholic liver disease, and primary biliary cirrhosis (n=3, 9.6%).
TE was used to assess the degree of liver fibrosis, as TE is the best-validated method for liver fibrosis evaluation [29-31]. The LS cut-off values using TE were selected according to the latest meta-analysis data [30]: 7.9 kPa for moderate fibrosis (FŌēź2), 8.8 kPa for severe fibrosis (FŌēź3), and 11.7 kPa for liver cirrhosis (F=4). In the 31 patients who had reliable LS measurements in all examinations, the most common fibrosis stage was liver cirrhosis (F4) (17 of 31, 54.8%), followed by severe fibrosis (F3) (6 of 31, 19.4%), mild (F1) or no liver fibrosis (F0) (5 of 31, 16.1%), and moderate (F2) liver fibrosis (3 of 31, 9.7%) (Table 1).
SWE Examinations
All patients underwent US examinations after fasting for more than 6 hours. All US examinations were performed by one radiologist (J.M.L) who had 6 years of experience in US-based elastography including pSWE, 2D-SWE, and TE (>200 examinations) and had 20 years of experience with abdominal US examinations.
At first, conventional B-mode sonography using a 4 MHz convex probe was used to assess the focal liver lesion during the planning US examination to determine the feasibility of ablation therapy. After that, LS measurements were performed using the intercostal approach while patients were placed in the supine position with their right arm in maximum abduction during the SWE examination. LS measurements of each patient were made with S-Shearwave using the Samsung RS 80A US system (Samsung Medison, Seoul, Korea), Virtual Touch Quantification (VTQ) using the Siemens Acuson S2000 Virtual Touch US system (Siemens AG, Erlangen, Germany), 2D-SWE with the CP technique using the LOGIQ S8 US system (GE Healthcare, Wauwatosa, WI, USA), and TE using FibroScan (Echosens, Paris, France) added to LOGIQ S8 within a 24-hour interval for each patient. For VTQ and S-Shearwave, a region of interest (ROI) was placed in the right anterior segment of the liver at a depth of 2.0 cm from the liver capsule to avoid including any focal liver lesions or vessels. Similarly, for 2D-SWE, a 1├Ś1 cm2 ROI was placed in the right anterior segment of the liver, taking care to avoid large vessels and areas with artifacts, 2.0 cm away from the Glisson capsule, and less than 6 cm deep from the transducer (Fig. 2).
The operator who conducted the SWE examinations performed all FibroScan examinations. The operator had performed more than 100 TE examinations and carried out all TE examinations according to the manufacturer's recommendations: the tip of the transducer probe (M+ probe or XL+ probe when prompted by the automatic probe selection tool) was placed on the skin between the ribs over the right lobe of the liver and valid LS measurements were obtained under the guidance of M-mode monographic images. During LS measurement, the patients were instructed to hold their breath while avoiding deep inspiration or expiration. At least 10 valid measurements were made in each patient for every method of SWE.
Definition of Technical Failure and Reliable (or Unreliable) Measurements
Technical failure of SWE methods and TE was defined as a failure to acquire 10 valid measurements after at least 15 trials [22]. If the interquartile range/median LS ratio was higher than 30%, the result was regarded to be an unreliable measurement [32]. To avoid any potential bias, the summary of the serial measurements of each technique was not made available to the operator until the three SWE techniques and TE examinations were completed [22].
Statistical Analysis
LS values were expressed in kPa for the S-Shearwave and 2D-SWE techniques, while the LS values in m/sec from VTQ were converted to the Young modulus [33]. Continuous data were summarized as mean values and data range, and categorical data were summarized as counts and percentages. The Friedman test with the Bonferroni correction was used to compare the technical failure rates and unreliable measurement rates between the three different SWE imaging systems. To compare BMI and fibrosis stage between patients with reliable LS and unreliable LS measurements, the Student t-test and the Mann-Whitney test were used. The Wilcoxon signed-rank test was used to compare LS measurements in a pairwise analysis. Spearman correlation coefficients and 2-way mixed model intra-class correlation coefficients (ICCs) with 95% confidence intervals (CIs) were obtained to evaluate the agreement between the different SWE techniques. Correlation coefficients were classified using the following definitions: 0-0.19, very weak; 0.2- 0.39, weak; 0.40-0.59, moderate; 0.60-0.79, strong; and 0.80- 1.0, very strong [34]. Agreement based on ICCs was classified using the following definitions: 0-0.39, poor; 0.40-0.59, fair; 0.60- 0.74, good; and 0.75-1.0, excellent [35]. In addition, Bland-Altman analysis was used to evaluate method-related variation using the mean values obtained using the different SWE systems. Furthermore, 95% limits of agreement and the coefficient of reproducibility (CR=1.96├Śstandard deviation of bias) were determined to assess the inter-platform variability of the LS measurements. The coefficient of variation (CV) of the LS values between the SWE techniques was also calculated. The area under the receiver operating characteristic curve (AUROC) was calculated for VTQ, S-Shearwave, and 2D-SWE for the detection of significant liver fibrosis (FŌēź2) using the LS values of TE as the reference standard. Optimal cut-off values were determined using the highest Youden index, and the DeLong test was used to compare AUROC curves. All statistical analyses were performed using commercially available software programs (SPSS version 23, IBM Corp., Armonk, NY, USA; or MedCalc version 16, MedCalc Software, Mariakerke, Belgium), with P-values of less than 0.05 considered to indicate a statistically significant difference.
Results
Technical Failure and Unreliable Measurement Rates
Ten LS measurements of the three SWE techniques and TE were made successfully in 47 of the 54 patients (87%) (Fig. 1). LS measurements were not able to be obtained with VTQ in one patient (1 of 54, 1.9%), with S-Shearwave in three patients (3 of 54, 3.7%), with 2D-SWE in three patients (3/54, 3.7%), and with TE in three patients (3 of 54, 3.7%). In addition, LS values could not be measured with both VTQ and TE in one patient, with both S-Shearwave and TE in one patient, and with both 2D-SWE and TE in one patient. There were no significant differences in the technical success rate between the SWE techniques and TE (P=0.682).
Among the 47 patients with technically successful LS measurements, reliable LS measurements were obtained in 97.9% (46 of 47) of patients with VTQ, 100% (47 of 47) with S-Shearwave, 83.0% (39 of 47) with 2D-SWE, and 85.1% (40 of 47) with TE. There was a significant difference in the reliable LS measurement rate between the SWE techniques (P=0.006). According to pairwise analysis, a significant difference (P<0.017 after the Bonferroni correction) was observed in the reliable measurement rate of S-Shearwave and 2D-SWE (P=0.005). Conversely, no significant differences were observed in the reliable measurement rate between VTQ and S-Shearwave (P=0.317) or between VTQ and 2D-SWE (P=0.020).
Correlation and Inter-platform Reproducibility of LS Values across Different SWE Techniques
The mean LS values for the two different pSWE techniques and 2D-SWE were significantly different from those of TE (P<0.001) (Table 2). According to pairwise analysis, significant differences were observed in the mean LS values between VTQ and TE (P<0.001), S-Shearwave and TE (P<0.001), and 2D-SWE and TE (P=0.001). The CVs for the SWE techniques ranged between 20.8 and 40.6 (Table 3).
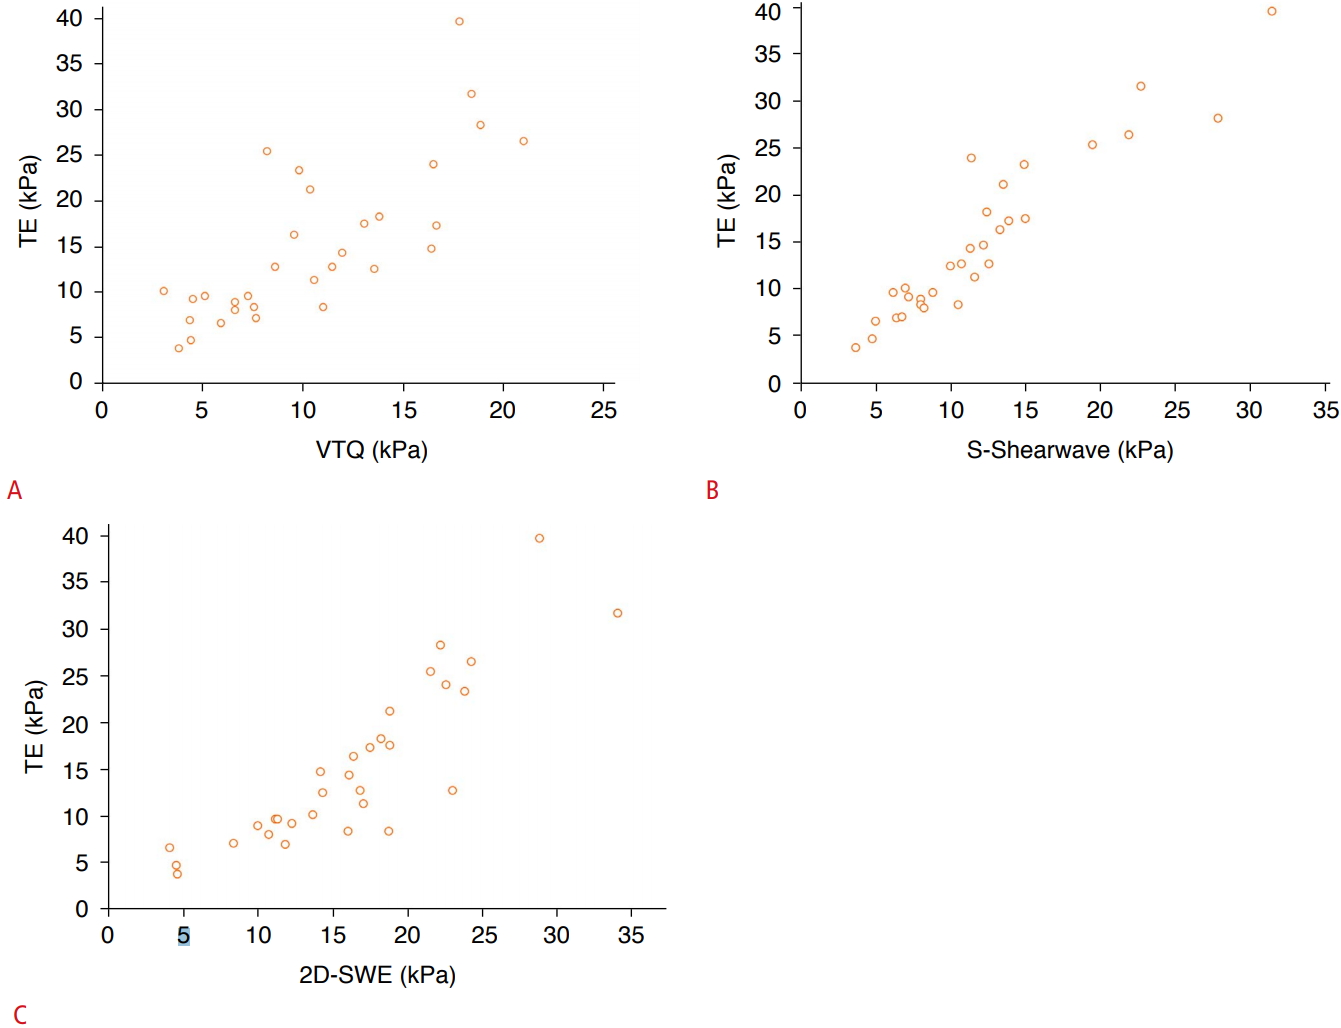
The ICC of the LS measurements for all SWE techniques was 0.87, indicating excellent agreement (95% CI, 0.16 to 0.94). When assessing the agreement between each of the three SWE techniques and TE (n=3), the pairwise ICCs ranged from 0.58 to 0.92. The best agreement was observed between S-Shearwave and TE (ICC, 0.92; r=0.94). The worst agreement was observed between 2D-SWE and TE (ICC, 0.58; r=0.88). In patients with F4 disease, S-Shearwave showed the best correlation with TE, and 2D-SWE showed the worst correlation with TE (Fig. 3). In addition, the Bland-Altman plots for reproducibility between TE and the other SWE techniques showed a tendency toward lower LS values with the three SWE techniques than with TE in patients with F3 and F4 disease (Fig. 4).
Performance of the Three SWE Techniques in Detecting Significant Fibrosis (FŌēź2)
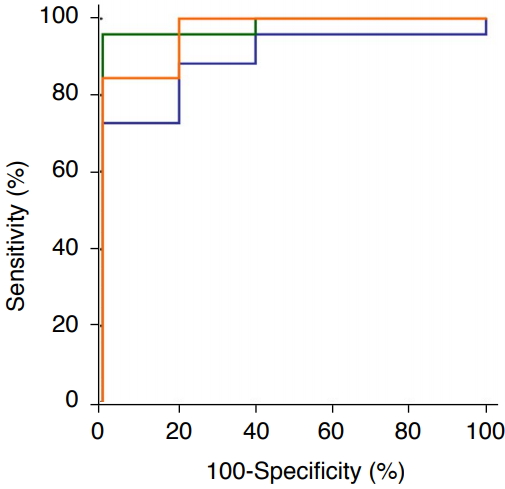
Using the LS values of TE as the reference standard, VTQ and S-Shearwave showed an AUROC of 0.90 (95% CI, 0.74 to 0.98) and an AUROC of 0.99 (95% CI, 0.860 to 1.000) in detecting significant fibrosis, respectively. 2D-SWE had an AUROC of 0.97 (95% CI, 0.835 to 0.999). In the pairwise AUROC curve comparison, the AUROCs of the three SWE techniques for the prediction of significant fibrosis were not significantly different (P=0.163-0.612) (Fig. 5).
Discussion
In our study comprising patients with CLD, we compared the LS measurements obtained from three commercially available SWE systems, each from a different manufacturer. From this comparison, we found that although there were no significant differences in the technical success rate, the pSWE methods (VTQ and S-Shearwave) showed significantly higher rates of reliable LS measurements than 2D-SWE. Our study results are in good agreement with that of a previous study by Sporea et al. [36], who also reported a significantly higher percentage of reliable LS measurements with VTQ than with TE and 2D-SWE (supersonic shear imaging [SSI]). Our study also demonstrated that the mean LS values of the two pSWE techniques and 2D-SWE were significantly different (P=0.006) although the overall ICC for LS measurements for all SWE techniques (n=4) was 0.87, indicating excellent agreement (95% CI, 0.16 to 0.94). In addition, the mean LS values obtained with the three SWE techniques were significantly lower than those obtained with TE. Our results are quite similar to those of a previous study by Bende et al. [37], which demonstrated substantially lower LS values with 2D-SWE than with TE. In addition, our study demonstrated that S-Shearwave and VTQ correlated with TE more closely than 2D-SWE in patients with liver cirrhosis (F=4). This inter-system variability could be attributed to a number of system-related factors, especially shear wave vibration frequency and bandwidth, as well as the softwareŌĆÖs method of calculating shear wave speed [38]. Therefore, we believe that as inter-system variability was consistently observed across the different SWE techniques, different cut-off values for fibrosis staging should be used for the two pSWE systems, 2D-SWE, and TE.
We also found in our study that although the three SWE techniques showed different optimal cut-off values (6.8-8.73 kPa) for diagnosing significant fibrosis (ŌēźF2), the AUROCs of the 3 SWE techniques were not significantly different for the detection of significant fibrosis (P=0.163-0.612) when using the cut-off values of TE as the reference standard. Our results are in good agreement with the results of other previous studies [22,36,39,40] including that of Gerber et al. [40], who reported no significant differences in AUROCs between 2D-SWE, pSWE, and TE in the diagnosis of significant fibrosis and Sporea et al. [36], who also published similar findings on the diagnostic accuracy of VTQ and 2D-SWE (SSI) in the diagnosis of significant fibrosis. Thus, although comparing the results obtained by different elastography techniques may be challenging due to non-standardized reported parameters, differing shear-wave frequencies, and other technical parameters [24], pSWE systems and 2D-SWE seem to show similar accuracy in fibrosis staging.
Some limitations of our study need to be mentioned. Because this study was intended for patients who were hospitalized for image-guided hepatic tumor ablation, the study population was relatively small and showed a disproportionate distribution of liver fibrosis grades. This may have limited our assessment of the diagnostic performance of each SWE system in fibrosis staging. Including outpatients might be helpful to overcome this limitation, but performing repeated SWE examinations, in addition to TE examinations, is difficult in an outpatient environment. In addition, one radiologist performed all SWE examination, so we did not analyze intra- or inter-observer variability. However, we believe that our study may serve as the first step toward a future study to evaluate the inter-platform reproducibility of SWE systems. Secondly, a histological diagnosis of fibrosis staging was not performed in our study. However, the primary goal of our study was to evaluate the inter-system variability of LS measurements, rather than comparing the diagnostic performance of each SWE system.
In conclusion, although the three commercially available SWE techniques showed similar technical success rates, significant inter-system variability was observed in LS measurements. Therefore, LS values measured using different SWE techniques should not be used interchangeably for longitudinal follow-up, and cut-off values established for one SWE technique should not be applied to other SWE techniques.


 Download Citation
 PDF Links
 PubReader
 ePub Link
 Full text via DOI
 Full text via PMC


