

 Print
Print facebook
 twitter
 Linkedin
 google+

Introduction
Acute cholecystitis is one of the most common causes of acute abdominal pain [1], with a prevalence of 5% among patients experiencing this symptom [2]. The treatment of choice is cholecystectomy, and if untreated, complications such as gangrenous changes or perforation are common [3]. Thus, in cases of acute cholecystitis, an accurate and early diagnosis is essential for timely treatment [2]. Among the several imaging modalities available, ultrasonography (US) is a useful tool for the initial evaluation of acute biliary disease, including acute cholecystitis [1,4], because of its high accessibility and diagnostic accuracy. Generally, the presence of gallstones, gallbladder (GB) wall thickening (>3 mm), GB distension, positivity for the sonographic Murphy sign, and pericholecystic fluid are well-known typical US features of acute cholecystitis [1]. In the previous literature, US has been shown to be slightly superior to other imaging modalities in terms of diagnostic performance for acute cholecystitis, with a pooled sensitivity of 88% and a pooled specificity of 80% [2].
Shear wave imaging (SWI), which simultaneously measures tissue viscosity and elasticity, is an emerging technique that uses acoustic radiation force to generate laterally propagating shear waves, and tracks them to determine their velocity. It consists of shear wave elastography (SWE) and shear wave dispersion (SWD) [5-7]. Through SWE, tissue stiffness can be measured quantitatively. However, the dispersion properties of shear waves are known to be an indirect method of measuring tissue viscosity. Inflammation and necrosis may lead to changes in tissue stiffness, in turn affecting the frequency dependence of both the speed and attenuation of shear waves [8-10]. In a previous study, using a rat model, shear wave speed was found to be strongly correlated with lobular inflammation of the liver, whereas dispersion was significantly associated with tissue necrosis [8]. Recently, a few preliminary studies have provided support for the correlation between necroinflammation and dispersion in human liver tissue [11]. However, to our knowledge, no studies have been published or preliminary results reported about both stiffness and dispersion, except in liver cirrhosis or steatohepatitis.
In acute cholecystitis, the GB bed of the liver shows hyperemic changes through arterioportal shunts, resulting from adjacent inflammatory processes, via the pericholecystic vein [12,13]. We hypothesized that these hyperemic changes might affect the viscoelasticity of the GB bed of the liver. Therefore, this study aimed to assess the diagnostic performance of SWI in evaluating acute cholecystitis.
Materials and Methods
Patients
This retrospective study was approved by the Institutional Review Board of Chung-Ang University Hospital, and the requirement for informed consent was waived. We searched for all patients with acute or chronic right upper quadrant pain referred for a US evaluation between April 2018 and March 2019 to rule out acute cholecystitis in their electronic health records. The inclusion criteria for this study were as follows: patients who (1) were older than 20 years of age, with an initial suspicion of acute cholecystitis; (2) underwent a US examination with grayscale imaging and 2-dimensional SWI (2D-SWI); (3) did not have underlying chronic liver disease; (4) underwent histopathologic confirmation, directly by surgery or indirectly by percutaneous cholecystostomy, or had follow-up images for suspected gallbladder lesions; and (5) had more than 3 months of clinical follow-up records when pathology results were not available. Patients with US images of inadequate quality were excluded. Finally, 44 patients were included in the study (Fig. 1).
US Examinations Using 2D-SWI
All patients underwent 2D-SWI during an evaluation for abdominal pain using a US scanner (Aplio i900, Canon Medial Systems, Tokyo, Japan) with a convex probe (PVI-475BX, 1-8 MHz) by a board-certified radiologist (E.S.L. with 13-years of experience in abdominal US imaging). All patients were asked to fast for at least 6 hours prior to the 2D-SWI examination, and the evaluation was performed with the patient in the supine position. To obtain the proper sonic window, patients were asked to raise their right arm above the head during the examination to stretch the intercostal muscles. We evaluated the GB to determine whether the patient had acute inflammation, and also examined general aspects of the hepatobiliary system with grayscale images. Thereafter, the 2D-SWI mode was activated, and a sample box measuring 2.5×2.5 cm was placed within the GB fossa of the liver parenchyma on the grayscale images. The area of liver parenchyma adjacent to the GB between the quadrate and the right lobes was defined as the GB fossa. The 2D-SWI images were obtained according to the guidelines for SWE of the European Federation of Societies for Ultrasound in Medicine and Biology [14] and the World Federation of Societies for Ultrasound in Medicine and Biology [15]. After acquisition of the shear wave propagation data, the US system automatically displayed the twin view of grayscale images and shear wave propagation maps, and then switched to the quad-view mode including four maps (namely, the grayscale image as a reference, the shear wave propagation map to visualize the confidence of the measurements, the elasticity map, and the SWD slope map for tissue viscosity) after 5 seconds of cooling time. Using an elasticity map, we measured liver stiffness expressed as kilopascals (kPa).
For each patient, we placed three circular regions of interest (ROIs), 1 cm in size, on each map in the GB bed of the liver, carefully avoiding large hepatic vessels. Under the guidance of the propagation map, we placed the ROIs to correspond with smooth and parallel lines on the propagation map, indicating stable measurement conditions. Activation of shear wave propagation and data filling of the sample box were performed 3 times for each patient, and each set of shear wave propagation data included one or two ROIs: Therefore, we measured liver stiffness and the SWD 3 to 6 times for each patient. If a bizarre pattern of shear wave propagation was observed or the color layer was absent in the ROIs, SWI was considered as a technical failure [16-18]. For each patient, we calculated an interquartile range interval (IQR), and considered measurements with IQR values less than 30% as reliable [16]. The median values of each SWE parameter were chosen for further analysis.
Imaging Analysis and Diagnostic Performance Test
To determine patients' eligibility for enrollment, a radiologist with 3 years of experience (A.K.) first reviewed the pathology reports and the US images. Regarding SWI, the reviewer conducted a receiver operating characteristic (ROC) curve analysis and obtained the optimal cut-offs for SWE and SWD to predict acute cholecystitis. In addition, the reviewer prepared anonymized and randomized imaging data sets for the subsequent diagnostic performance test: (1) grayscale US images and (2) grayscale US images with SWI.
After data preparation, two other board-certified abdominal radiologists (E.S.L. and H.J.P., both 13 years of experience in abdominal US) sequentially reviewed the imaging sets on a picture archiving and communication system workstation (M-view, INFINITT Healthcare, Seoul, Korea), with a 3-week interval between sessions. The readers, who were blinded to patients' clinical information and laboratory and pathologic findings, first reviewed the grayscale imaging set alone, assessing the images in terms of the presence of the typical imaging findings of acute cholecystitis: GB wall thickening (>3 mm), gallstone or sludge, hypervascularity (in adjacent liver parenchyma or the GB wall), pericholecystic fluid, and GB distension (>40 mm) [1]. Finally, the possibility of acute cholecystitis was assessed on a 5-point scale: 1, definitely not acute cholecystitis (if there is evidence of other pain focus or in the absence of any imaging findings of acute cholecystitis); 2, probably not acute cholecystitis (in the presence of only 1 of the imaging findings of acute cholecystitis); 3, indeterminate (2 imaging findings of acute cholecystitis); 4, probably acute cholecystitis (3 or more imaging findings of acute cholecystitis); 5, definitely acute cholecystitis (3 or more imaging findings of acute cholecystitis in agreement with the subjective judgement of the reader). After a 3-week interval, the readers evaluated the other imaging set, consisting of grayscale images with SWI. To help readers interpret the SWI images, the optimal SWI cutoff values, obtained by the statistical analysis, were provided as an additional finding to predict acute cholecystitis (SWE=8 kPa, SWD=10.8 [m/sec]/kHz, respectively). Both readers scored the possibility of acute cholecystitis again, using these proposed values.
Reference Standard
Of the 44 patients, 31 (70.5%) underwent surgery, and 3 (6.7%) underwent percutaneous cholecystostomy. One pathologist (H.S.K., 26 years of experience in hepatobiliary pathology) reviewed the surgical specimens and diagnosed acute cholecystitis based on the following histologic features: hemorrhage, edema, mucosal erosions, fibrin thrombi in small veins, reactive epithelial changes, or neutrophil infiltration [19]. The findings from patients who underwent percutaneous cholecystostomy were indirectly confirmed by the analysis of the bile fluid obtained during percutaneous cholecystostomy. Positive culture results or an elevated white blood cell count in bile fluid, with improvement of leukocytosis and elevated serum C-reactive protein after percutaneous cholecystostomy, was considered as an indicator of acute cholecystitis [12]. Ten patients who had unremarkable findings in the GB on the initial US evaluation, follow-up medical records, or US results were used as the reference standard.
Statistical Analysis
We used the independent-samples t test to compare continuous variables and the chi-square test to compare categorical variables.
The Fisher exact test was performed to select the predictive factors for acute cholecystitis. For SWE and SWD values, the median value was calculated for both factors. The independent-samples t-test was performed for median SWE and median SWD values. Cutoff values for SWE and SWD were calculated based on the ROC curves of each factor. Then, SWE and SWD values were categorized into two subgroups using their respective cutoff values. The Fisher exact test was also calculated for the categorized SWE and SWD values. Multivariate logistic regression analysis was performed using the predictive factors that showed P-values of <0.15 in the univariate analysis.
The ROC curves of the grayscale imaging sets and grayscale imaging with SWE and SWD sets were calculated for each reader. Additionally, to evaluate the efficacy of the SWE and SWD values, the ROC curves of the two sessions were compared for each reader by a pairwise comparison of ROC curves (the DeLong method). Quadratic-weighted kappa values were calculated to evaluate inter-reader agreement on the 5-point scale used to diagnose acute cholecystitis before and after the addition of SWE and SWD.
Two-sided P-values of <0.05 were considered to indicate statistical significance. The statistical analysis was performed using the MedCalc Statistical Software version 17.5.5 (MedCalc Software bvba, Ostend, Belgium).
Results
Patients
The 44 patients enrolled had a mean age of 57.2±19.7 years and showed a female predominance (61.4%). Acute cholecystitis was confirmed by surgery in 11 cases and by percutaneous cholecystostomy in three. The other cases were diagnosed as chronic cholecystitis (18 of 31, 58.0%), GB cancer (1 of 31, 3.2%) or unremarkable GB (1 of 31, 3.2%) (Table 1).
US Findings of Acute Cholecystitis and Diagnostic Performance
Clinical significance of typical US features and SWI values
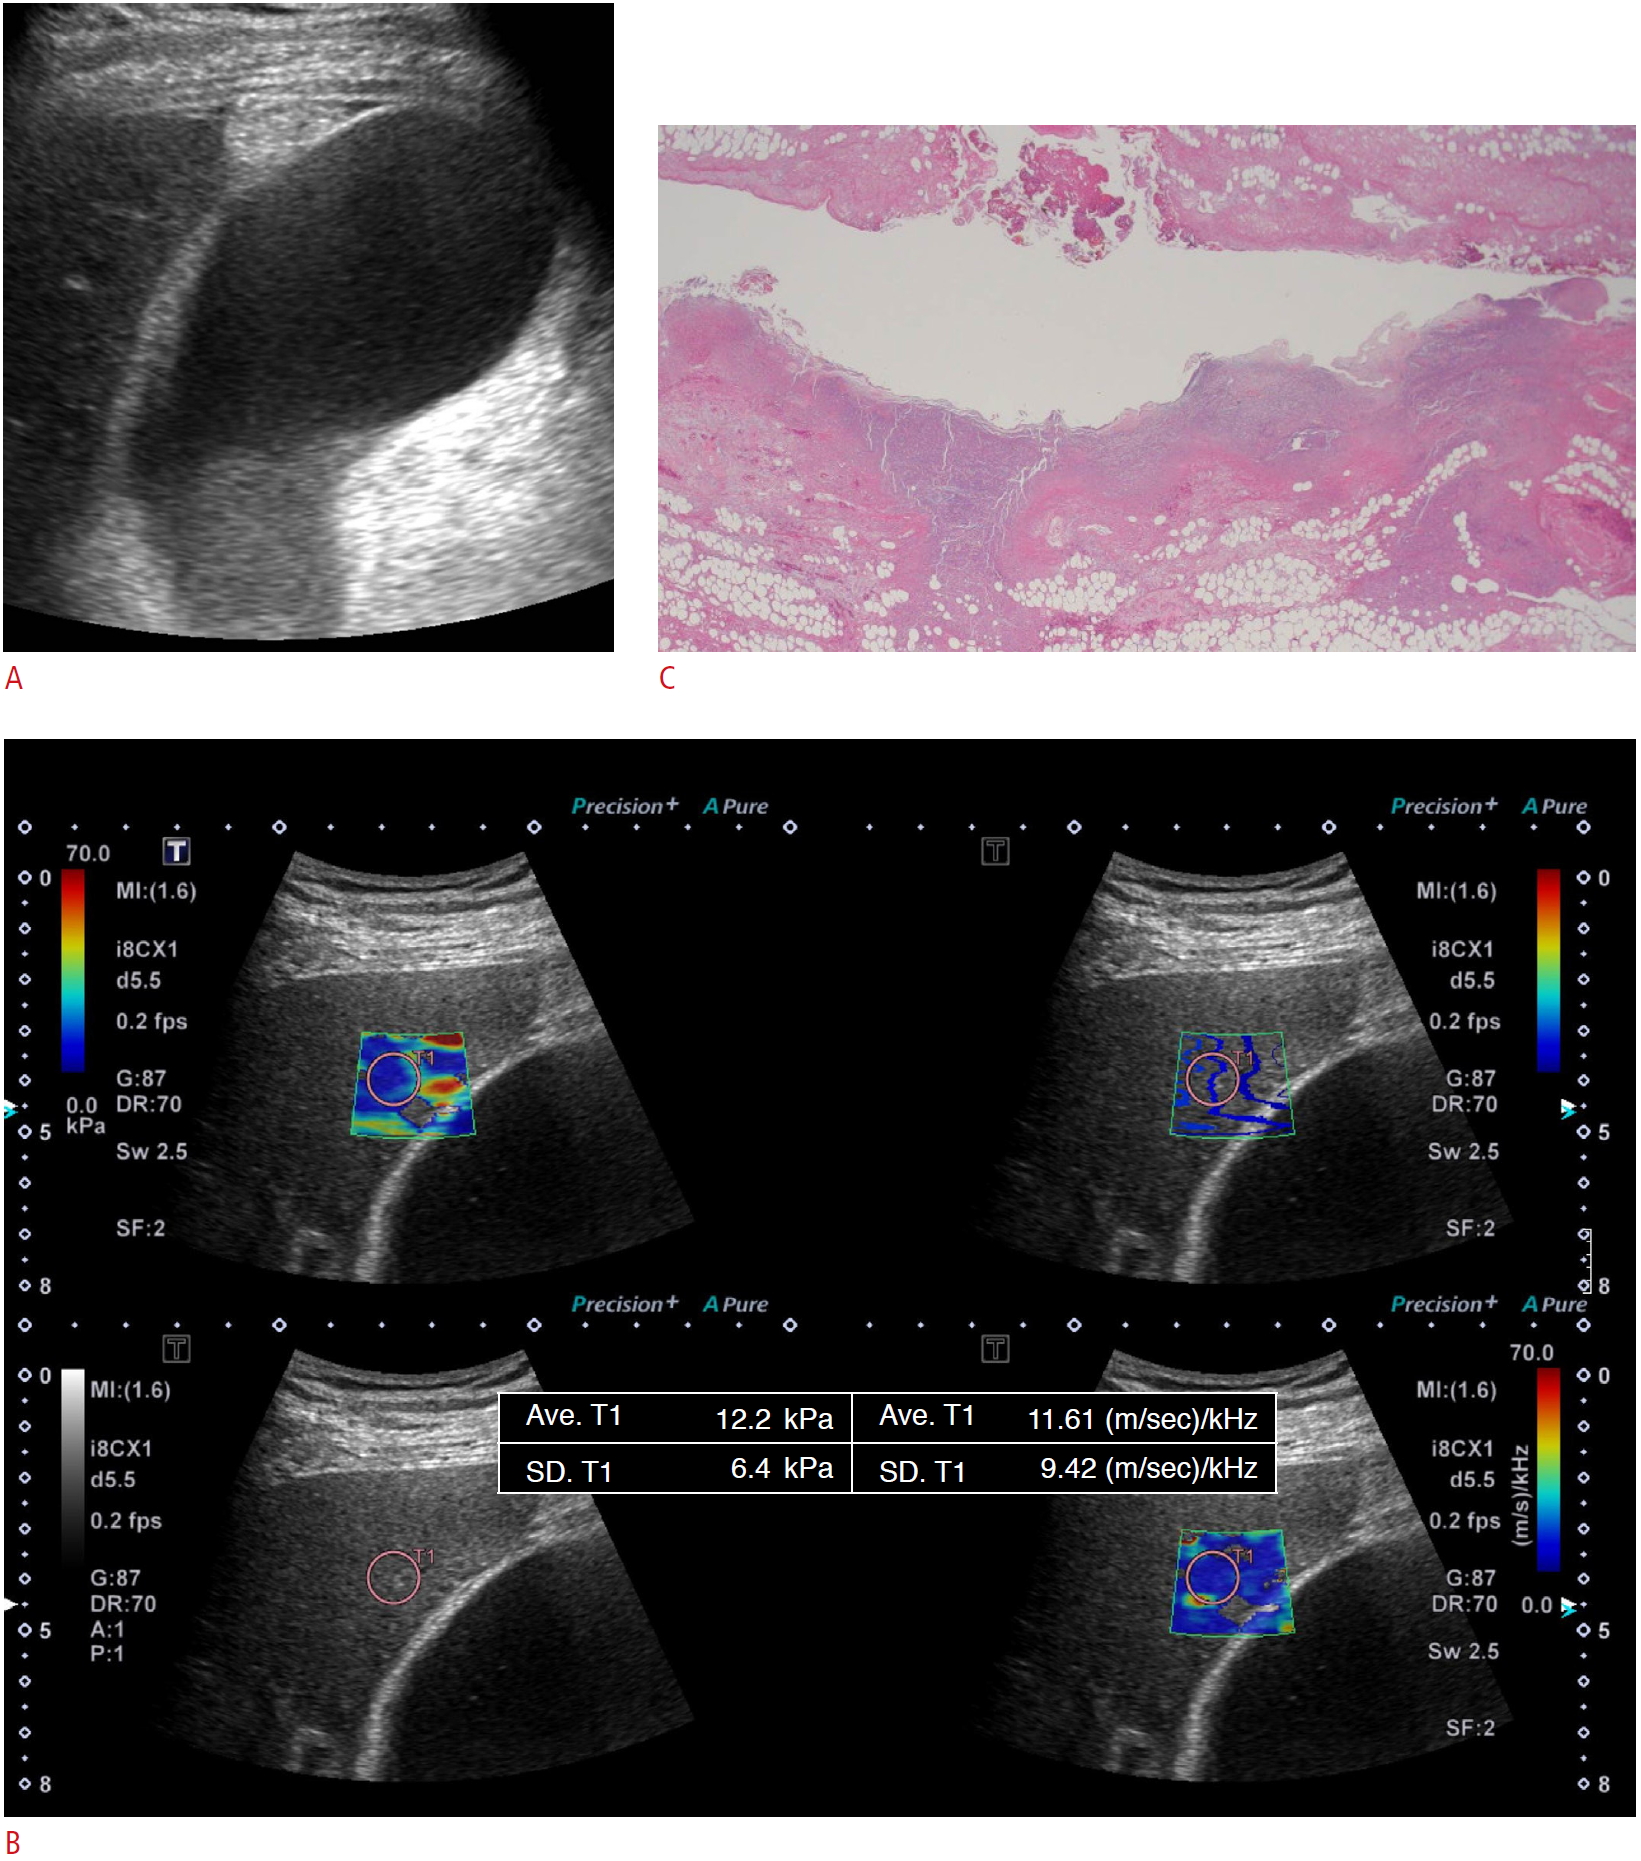
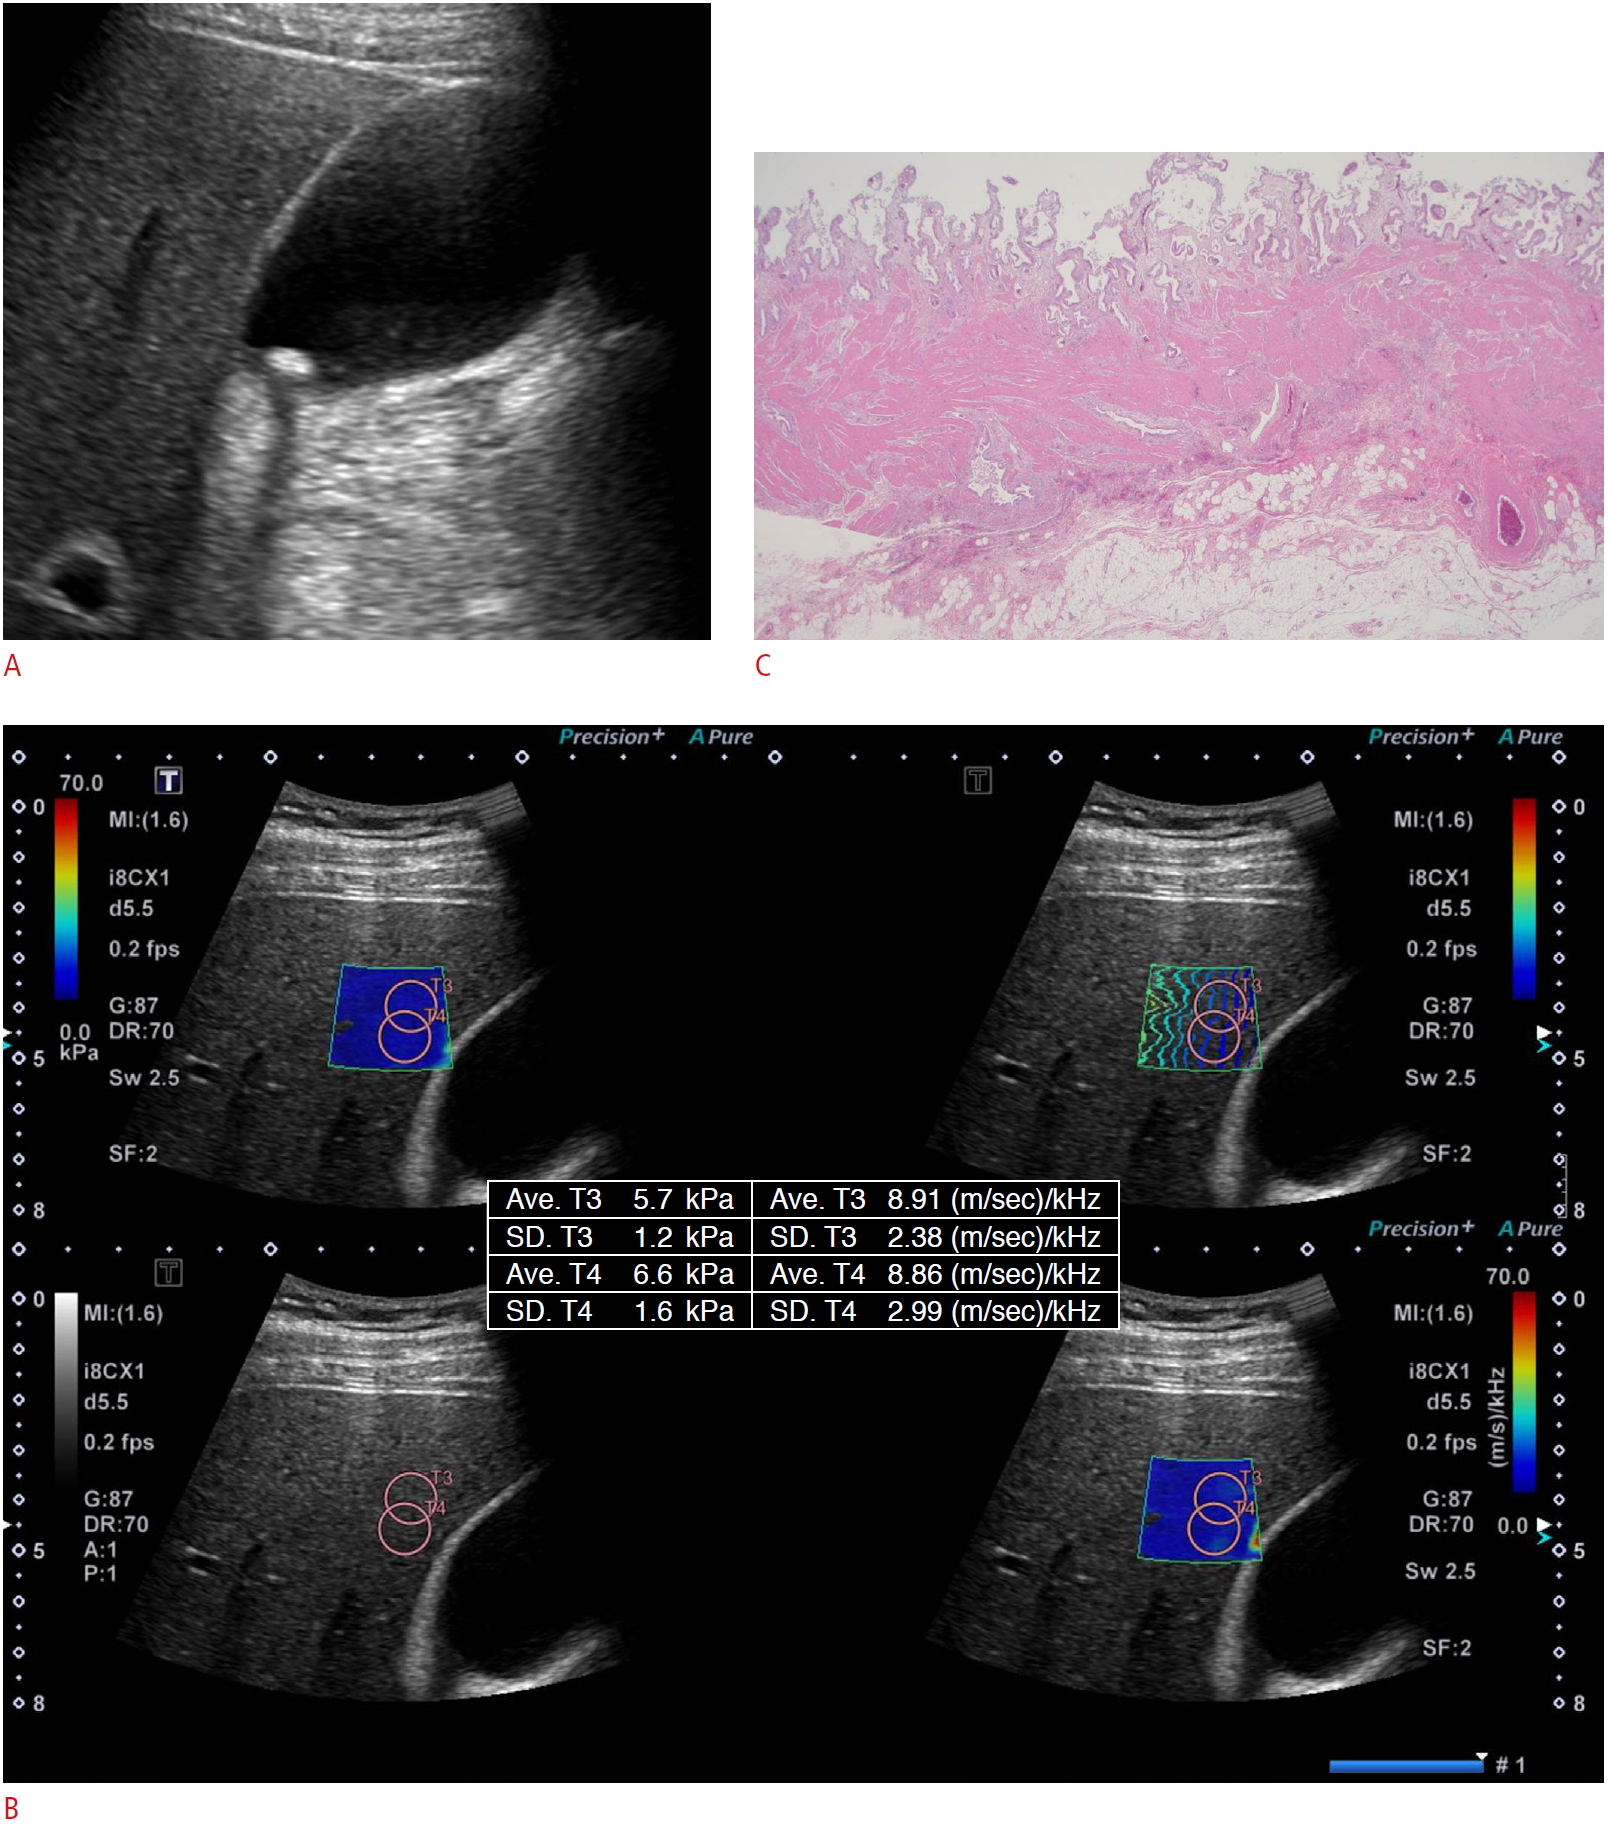
The typical US features and SWI values differentiating between the acute cholecystitis and non-acute cholecystitis groups are summarized in Table 2. Patients with acute cholecystitis were more likely to show typical US features of acute cholecystitis, except stones. The median SWE value of patients with acute cholecystitis was higher than those without acute cholecystitis, whereas the median SWD value did not show a significant difference (Figs. 2, 3). For SWI, the ROC curve revealed the optimal cutoff values to be 8 kPa and 10.8 (m/sec)/kHz for SWE and SWD, respectively. The SWE ROC curve showed a specificity of 90.0% and a sensitivity of 57.1% (area under the curve [AUC], 0.688; P=0.056), whereas SWD showed a specificity of 33.3% and a sensitivity of 85.7% (AUC, 0.550; P=0.592) (Table 3).
Among the typical imaging features, GB distension (P=0.021) and sludge (P=0.022) were associated with acute cholecystitis. Other features, including pericholecystic fluid collection (P=0.306), gallstones (P=0.748), wall thickening (P=0.155), and hypervascularity (P=0.051), did not show significant associations. SWE and categorized SWE were also predictive factors for acute cholecystitis (P=0.045 and P<0.004, respectively). However, in the multivariate analysis, only categorized SWE was a significant predictor of acute cholecystitis (P<0.001) (Table 2).
Comparison of diagnostic performance before and after adding 2D-SWI values
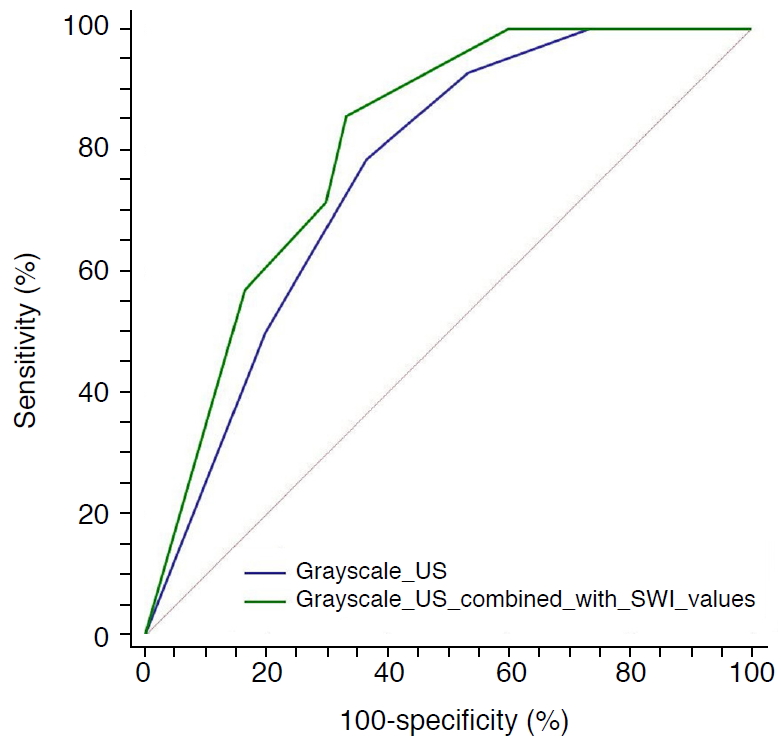
In terms of diagnostic performance, in the first session with grayscale US images only, the AUC values of the ROC curves for each reader were 0.760 and 0.776, respectively. In the second session, including SWE and SWD, the AUC of both readers slightly increased (from 0.760 to 0.807, and from 0.776 to 0.779, respectively) (Fig. 4), but the difference was statistically insignificant (P>0.05) (Table 4). However, the inter-reader agreement between the two readers improved (k=0.654-0.778) after SWI was provided.
Discussion
Our study showed that 2D-SWI could provide additional findings useful for diagnosing acute cholecystitis. In the multivariate analysis, the categorized SWE value (cutoff, 8.0 kPa) was the only factor independently associated with acute cholecystitis (P<0.01). Compared with computed tomography (CT) and magnetic resonance imaging, US has shown slightly superior diagnostic performance for acute cholecystitis [2,20]. Nonetheless, US tends to show a broad range of sensitivity and specificity, reflecting the heterogeneity of its diagnostic accuracy [2]. We hypothesized that 2D-SWI could improve diagnostic performance by providing quantitative values, compensating for operator-dependency and heterogeneity in interpretation.
As mentioned above, 2D-SWI comprises SWE and SWD. Theoretically, both tissue elasticity and viscosity affect shear wave propagation. However, tissue viscosity has been generally neglected due to the lack of a proper method to measure it independently. To solve this difficult problem, a method was developed to measure SWD, from which tissue viscosity can be derived by a new processing algorithm. Although this technique is in its initial stages of development, it is currently considered the only method to measure tissue viscosity to provide information about tissue necrosis and acute inflammation. To obtain SWD, all frequency domains must be taken into account. Using the fast Fourier transform algorithm, each displacement caused by shear waves can be transformed from the time domain to the frequency domain. Finally, from shear wave speed and frequency, SWD can be estimated as a phase domain, and is calculated in units of (m/sec)/kHz [8,11]. Since 2D-SWI was introduced, several preliminary studies have reported the clinical significance of SWD in various hepatic diseases, both in a rat model and in human patients [8,11,21,22]. To our knowledge, this is the first study to evaluate secondary changes in the liver by 2D-SWI, focusing on the GB.
Generally, the presence of gallstones, GB wall thickening (>3 mm), GB distension, positivity for the sonographic Murphy sign, and pericholecystic fluid are well-known typical US features of acute cholecystitis [1]. Of these factors, GB distension (P=0.021) and sludge (P=0.022) were predictive factors of acute cholecystitis in our study. Hypervascularity showed a high negative predictive value (82.6%), despite its lack of statistical significance in the univariate analysis (P=0.051). In contrast, the presence of gallstones (P=0.748) and wall thickening (P=0.155) turned out not to be significant predictors of acute cholecystitis. This might have been because these two imaging features are often associated with various other disease entities without active inflammation, such as chronic cholecystitis or adenomyomatosis. GB sludge can also present with the chronic diseases mentioned above. Usually, GB sludge disappears spontaneously within a relatively short time. However, without mitigation, 19.6% of patients with GB sludge developed gallstones or even acute cholecystitis [23]. In our study, eight patients had GB sludge without visible gallstones, of whom five patients were pathologically confirmed as having acute cholecystitis. We might consider GB sludge as incidental or causative. In terms of pericholecystic fluid collection, which may be associated with gangrene and perforation [1,24], we observed positive results in only five patients (P=0.306). The relatively small number of patients might have prevented the results from reaching statistical significance.
Regarding 2D-SWI, SWE (P=0.04) was a predictive factor, whereas SWD (P=0.368) was not, a result that contrasted with our initial hypothesis. This result might suggest that the increased tissue stiffness of the GB bed in the liver is caused by increased blood flow itself, rather than by the spread of inflammation, in acute cholecystitis. Hyperemic changes in the GB bed are a wellknown feature of acute cholecystitis. On CT, this phenomenon is known as transient hepatic attenuation difference (THAD). Through the pericholecystic vein, the GB bed of the liver shows a reactive hyperemic change in response to local inflammation [12,13]. THAD is a compensatory reaction to the decreased portal flow associated with hepatic pathologies [25,26]. Several studies have investigated the correlation between the degree of THAD and markers of inflammation such as C-reactive protein, leukocyte count, and the severity of acute cholecystitis, but have found discordant results [26-29]. Our study showed increased stiffness of the GB bed of the liver in acute cholecystitis, suggesting that only hyperemic changes, not necroinflammation, are associated with THAD.
With a cutoff value of 8.0 kPa, SWE showed higher specificity (90.0%) than the previously reported pooled specificity of typical US features (80.0%) [2]. In the multivariate analysis, categorized SWE (P<0.01) was the only predictor of acute cholecystitis. We thus propose that SWE might be useful to reinforce the diagnosis in case of equivocal grayscale images. Moreover, by providing quantitative values, SWI can also reduce operator-dependency and the subjectivity of interpretation in US examinations.
Our study has several limitations. First, it is a single-center retrospective study. Further prospective, multicenter studies with large populations would be needed to validate our results. Second, 10 patients did not undergo pathologic confirmation. These patients were not clinically and radiologically suspected to need surgery, despite the presence of right upper quadrant pain. Though their pathology was not available, we checked for non-acute cholecystitis by reviewing their electronic medical records containing information on more than 3 months of follow-up. Third, we used a specific US machine from a single vendor. Future studies with multi-vendor systems would be necessary to validate this technique. In conclusion, 2D-SWI, and especially SWE, could help in the diagnosis of acute cholecystitis.

 Download Citation
 PDF Links
 PubReader
 ePub Link
 Full text via DOI
 Full text via PMC


