

 Print
Print facebook
 twitter
 Linkedin
 google+

Introduction
Alzheimer's disease (AD) is the most common neurodegenerative disorder, and is characterized by progressive cognitive decline and neuropathologically by the presence of neuritic plaques and neurofibrillary tangles [1]. Plaques and tangles, which primarily consist of amyloid-beta and hyperphosphorylated tau, respectively, are highly concentrated in brain regions that are important for memory and cognition such as the hippocampus and cerebral cortex [2]. Despite the increasing prevalence and debilitating consequences of AD, current treatment methods have limited efficacy in preventing, slowing, or stopping the progression of the disease. It is therefore a high priority to find effective treatment strategies for AD.
Ultrasound has been shown to produce diverse biological effects via thermal/non-thermal, mechanical, or electrophysiological interactions with biological tissues, which may yield impactful therapeutic outcomes [3]. The advent of focused ultrasound technology has enabled the application of acoustic energy to highly specific intracranial areas, including deep brain regions, with spatial specificity on the order of millimeter to submillimeter resolution [4]. Low-intensity transcranial focused ultrasound (tFUS) is an emerging brain stimulation method, which could excite or inhibit neural activity in a reversible and non-invasive manner without raising tissue temperature [5]. In conjunction with intravenous injection of microbubble ultrasound contrast agents (MBs), the use of tFUS has also been investigated as a non-invasive means to transiently open the blood-brain barrier (BBB) in a region-specific fashion [6]. Although the exact mechanism requires further study, acoustic cavitation of MBs induced by tFUS is believed to amplify local pressure waves and thereby temporarily stretch the endothelial walls of the BBB around the targeted brain area [6].
tFUS-mediated BBB disruption has been utilized to enhance the delivery of exogenous therapeutics [7-9]. In a transgenic rodent model of AD, MB-tFUS-mediated delivery of antibodies against tau protein and amyloid across the BBB reduced tau and amyloid levels and had positive effects on memory performance [8]. Strikingly, in further investigations using an AD mouse model, BBB disruption alone, even without introducing exogenous therapeutic agents, led to a reduction in the plaque burden, promotion of neuronal plasticity, and improvement in spatial memory [10]. A similar tFUS-BBB disruption procedure, without the introduction of exogenous drug molecules, targeting the hippocampus in normal adult mice exhibited positive generation/proliferation of neurons [11]. Building upon this compelling preclinical evidence, tFUS-mediated human BBB disruption trials for AD patients are ongoing, targeting the dorsolateral prefrontal cortex [4], anterior right frontal lobe [12], and memory circuits (i.e., the hippocampus/entorhinal cortex) [13]. Such studies have demonstrated that repetitive BBB disruption sessions can be safely delivered in AD patients, prompting further studies to examine group-wise changes in clinical symptoms and function over time.
The purpose of this study was to evaluate the safety and efficacy of low-intensity tFUS under the threshold for BBB disruption in patients with AD. To do so, we applied low-intensity tFUS to the unilateral hippocampal area of patients with AD and evaluated the safety and presence of BBB disruption using magnetic resonance imaging (MRI). In addition, we assessed changes in the regional cerebral metabolic rate of glucose (rCMRglu) using 18F-fluoro-2-deoxyglucose positron emission tomography (FDG-PET) and cognitive function after tFUS.
Materials and Methods
Compliance with Ethical Standards
This single-center prospective study was approved by the Institutional Review Board of Incheon St. Mary's Hospital in Korea (OC18DESI0130). All participants and their legal guardians provided written informed consent.
Study Population
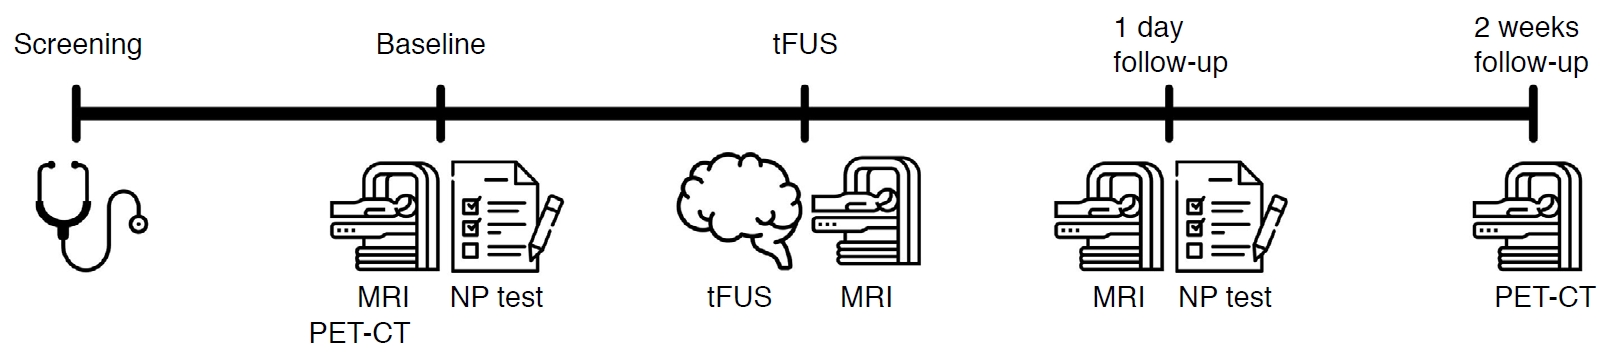
AD patients aged between 65 and 85 years were recruited from the neurology outpatient clinic between August 2019 and November 2019. The clinical diagnosis of AD was based on the Diagnostic and Statistical Manual of Mental Disorders-IV criteria [14] and the National Institute of Neurological and Communicative Disorders and Stroke and the Alzheimer's Disease and Related Disorders Association criteria [15]. The inclusion criteria also included a Clinical Dementia Rating (CDR) score between 1 and 3 and a Mini-Mental State Examination (MMSE) score below 20. The exclusion criteria were the following: radiological findings on MRI, epilepsy, stroke, mixed or vascular dementia, other neurological or psychiatric disorders, and contraindications to MRI, MRI contrast agents, or MBs. The overall process of the study is summarized in Fig. 1.
Clinical Assessments
The screening tests included medical history-taking, physical and neurological examinations conducted by a neurologist, routine blood biochemistry and blood count, blood lipid profile, 12-lead electrocardiography (ECG), and a chest X-ray examination.
The patient's general cognitive status and severity of dementia were evaluated by MMSE, CDR, and the CDR-Sum of Boxes (CDR-SOB). Moreover, a neuropsychological test battery was composed of subtests assessing attention (Digit Span Test: forward and backward), visuospatial function (Clock Drawing Test, Rey Complex Figure Test: copy), memory (Seoul Verbal Learning Test-Elderly's version [SVLT-E]: immediate recall, delayed recall, and recognition), and executive function (short form of the Korean-Color Word Stroop Test: word reading and color reading, Controlled Oral Word Association Test: Animal and Phonemic, Contrasting Program, and Go/No-Go Test). The neuropsychological assessment was conducted by a licensed neuropsychologist blinded to the purpose of this study.
Each patient was admitted to the hospital 1 day before the planned tFUS procedure and remained hospitalized for approximately 24 hours after the procedure to monitor adverse events such as vital sign abnormalities, skin changes, microhemorrhages on susceptibility-weighted imaging (SWI), and lesions on fluid-attenuated inversion recovery (FLAIR) imaging. To monitor delayed adverse events, the patient was followed up through subsequent outpatient care.
Baseline Imaging Acquisition
Before the tFUS procedure, MRI and computed tomography (CT) scans were conducted for image guidance of sonication targeting [16,17]. Four adhesive fiducial markers (visible in both MRI/CT scans, PinPoint, Beekley Corp., Bristol, CT, USA) were placed on spatially distributed locations over the head. The spatial coordinates of the fiducial markers in MRI/CT data were used to register the individualŌĆÖs physical space to the multi-modal data's virtual space in order to align the tFUS focus to the targeted hippocampal area.
The brain MRI data was obtained using a 3-T clinical MR scanner (MAGNETOM Skyra, Siemens, Enlargen, Germany) with a 32-channel head coil. High-resolution T1-weighted anatomical MRI was acquired using the 3D magnetization-prepared rapid gradient-echo sequence (repetition time [TR], 2,000 ms; echo time [TE], 2.49 ms; flip angle, 9┬░; field of view [FOV], 230├Ś230 mm2; matrix, 256├Ś256 [phase├Śfrequency]; voxel size, 0.9├Ś0.9├Ś0.9 mm3; bandwidth, 180 Hz/pixel; 224 sagittal slices). In addition, FLAIR imaging (TR, 9,000 ms; TE, 81 ms; inversion time, 2,500; flip angle, 90┬░; FOV, 224├Ś224 mm2; matrix, 256├Ś320 [phase├Śfrequency]; voxel size, 0.7├Ś0.7├Ś4.0 mm3; bandwidth, 289 Hz/pixel; 44 slices) and SWI (TR, 27 ms; TE, 20 ms; flip angle, 15┬░; FOV, 203├Ś224 mm2; matrix, 232├Ś256 [phase├Śfrequency]; voxel size, 0.44├Ś0.44├Ś1.50 mm3; bandwidth, 120 Hz/pixel; 104 slices) were performed to detect anatomical abnormalities and the presence of hemorrhage.
Brain FDG-PET and CT scans were performed using a Discovery STE PET-CT scanner (GE Healthcare, Milwaukee, WI, USA). All participants were injected with 185-222 MBq of FDG intravenously and rested in a supine position with eyes closed in a quiet and dark room for 45 minutes. A total of 47 transaxial emission images were obtained (pixel size, 1.95├Ś1.95 mm; slice thickness, 3.27 mm; matrix, 128├Ś128). CT images were also acquired (FOV, 250├Ś250 mm2; matrix, 512├Ś512; voxel size, 0.49├Ś0.49├Ś0.50 mm3). Standard filtering techniques and the ordered subset expectation maximization algorithm were applied to reconstruct the PET images. CT images were examined for the presence of large calcifications within the cranial cavity (>3 mm, one-half of the wavelength of the ultrasound waves), which may perturb the propagation of acoustic waves; none were found.
Low-Intensity tFUS
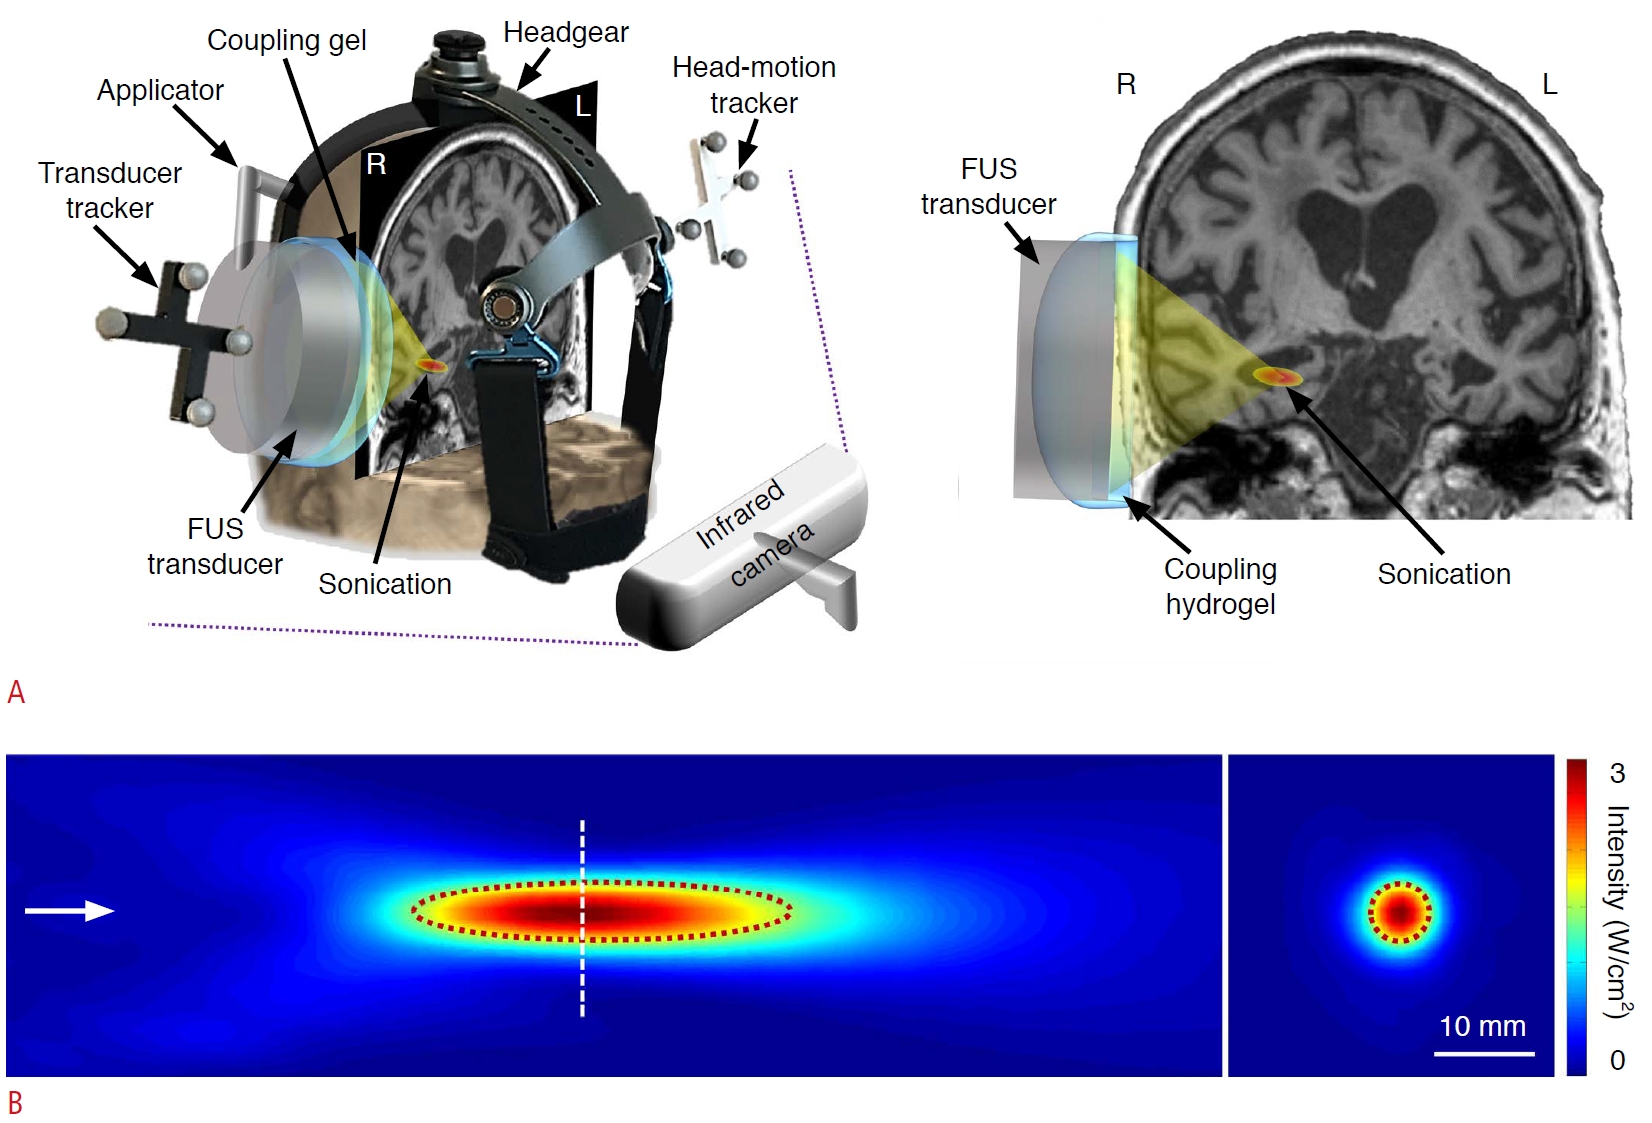
We applied low-intensity tFUS to the right hippocampus for 3 minutes using an image-guided tFUS system (NS-US100, Neurosona Co., Ltd., Seoul, Korea). For multi-modal neuroimaging guidance, MRI and CT data were spatially co-registered using the maximization of normalized mutual information [18]. The subject-specific coordinates of the hippocampus in the right hemisphere were identified as the tFUS target location. Based on CT data, the sonication path was planned to be perpendicular to the skull at the entry while avoiding the sinus and thick skull segments (> ~10 mm) along the beam path. A compressible cryogel (Bluemtech, Wonju, Korea) was applied between the transducer and the scalp to provide acoustic coupling (Fig. 2A).
The spatial acoustic intensity profile generated by the tFUS transducer showed that the size of the tFUS focus at full-width at half-maximum intensity was 5.8 mm in diameter and 37.3 mm in length (Fig. 2B). The center of the maximum intensity area was 70 mm away from the exit plane of the transducer on the beam path. The procedure of mapping the acoustic intensity field has been described elsewhere [17].
With the patient comfortably seated on a recliner chair, the physical space of the head was registered to the space of the T1-weighted images under optical tracking (NDI, Ontario, Canada) [16,17]. Ultrasound hydrogel (Aquasonic, Parker Laboratories, Fairfield, NJ, USA) was applied around the entry point on the scalp. Intravenous catheterization was prepared prior to the sonication session. The operator aligned the acoustic focus to the right hippocampus (Fig. 2B) and administered MBs (Definity, Lantheus Medical Imaging Inc., North Billerica, MA, USA) intravenously at a dose of 10 ╬╝L/kg over a ~1-minute period. Immediately after MB injection, low-intensity tFUS was delivered immediately afterward to the hippocampal target using the following sonication parameters: a fundamental frequency of 250 kHz, and a tone-burst-duration of 20 ms with a pulse repetition frequency of 2 Hz (i.e., a duty cycle of 4%). The acoustic intensity at the focal target had a spatial-peak pulse-average acoustic intensity of 0.5-3 W/cm2, resulting in a spatial-peak temporal-average acoustic intensity of 0.02-0.12 W/cm2.
Follow-up Imaging Acquisition
After the tFUS procedure, patients underwent additional MRI. The lead time between the end of the FUS procedure and the start of the MRI scan was approximately 30 minutes. After the SWI and FLAIR scans, T1-weighted images were acquired with two different flip angles of 2┬░ and 14┬░ (TR, 4.42 ms; TE, 2.01 ms; FOV, 224├Ś224 mm2; matrix, 224├Ś224 [phase├Śfrequency]; voxel size, 1.0├Ś1.0├Ś3.0 mm3; bandwidth, 450 Hz/pixel; 52 slices). For T1 dynamic contrast-enhanced (DCE)-MRI, a 3D gradient-echo sequence (3D CAIPIRINHA-controlled aliasing in parallel imaging results in higher acceleration) was used at TR, 3.32 ms; TE, 1.12 ms; flip angle, 9┬░, with 24 reference lines for both phase and partition encoding using an acceleration factor of 2├Ś2 (phase├Śpartition) with reordering shift 1, FOV, 224├Ś224 mm2; matrix, 224├Ś224 (phase├Śfrequency); voxel size, 1.0├Ś1.0├Ś4.0 mm3 (44 slices). In total, 48 volumes were acquired in a total scan duration of 10 minutes and 11 seconds. Intravenous injection of gadobutrol (Gadovist, Bayer Healthcare, Wayne, NJ, USA) was given at a dose of 0.1 mL/kg before the DCE-MRI sequence, using an automated injector with a flow rate of 2.5 mL/s, followed by a 25-mL saline flush with a flow rate of 2.0 mL/s. The MRI scans were repeated 1 day after the tFUS procedure using the same protocol. In addition, follow-up FDG-PET scans were performed approximately 2 weeks after the tFUS procedure.
Image Analysis
For each patient, the presence of BBB opening was evaluated by a visual inspection of contrast enhancement and independent component analysis (ICA) of DCE-MRI data. For the ICA analysis, all volumes of each patient were realigned using Statistical Parametric Mapping 12 (SPM; https://www.fil.ion.ucl.ac.uk/spm). The images were then skull-stripped and merged to obtain time-series of DCE-MRI images using FMRIB Software Library (https://fsl.fmrib.ox.ac.uk/fsl/fslwiki). The Group ICA of fMRI Toolbox (GIFT; https://trendscenter.org/software/gift) was used to decompose the preprocessed data from each patient into 20 independent components (ICs) based on the Infomax algorithm [19]. The stability of the estimated ICs was tested by repeating the ICA algorithm 20 times using the ICASSO toolbox [20], implemented in GIFT. Components that demonstrated an initial signal increase after gadobutrol injection followed by sustained elevation were selected and visually inspected.
All PET images were spatially normalized to the standard PET template, resliced with a voxel size of 2├Ś2├Ś2 mm3, and smoothed with an 8-mm full-width at half-maximum isotropic Gaussian kernel using SPM. Relative tracer activity at each voxel was estimated as the ratio to mean cerebellar activity using proportional scaling. For voxel-wise analysis, the paired t test was performed to assess changes in rCMRglu before and after sonication. The voxel-wise significance threshold was set at P<0.005 (uncorrected) with a minimum cluster size of 50 contiguous voxels.
Results
Four patients (mean age┬▒standard deviation, 78.8┬▒3.3 years; 3 women) with probable AD were enrolled in this study. No patients showed any abnormalities on blood biochemistry and count, ECG, or the chest X-ray examination before the tFUS procedure. The visual inspection and ICA analysis of the DCE-MRI data revealed no evidence of contrast enhancement related to BBB disruption. No adverse events were observed after the procedure or in outpatient follow-up visits for up to 1 year.
The results of the neuropsychological tests before and after tFUS are summarized in Table 1. Overall, mild improvement was observed in global cognitive function (MMSE), executive function (Contrasting Program, Go/No-Go Test), and memory (SLVT-E: immediate recall and recognition).
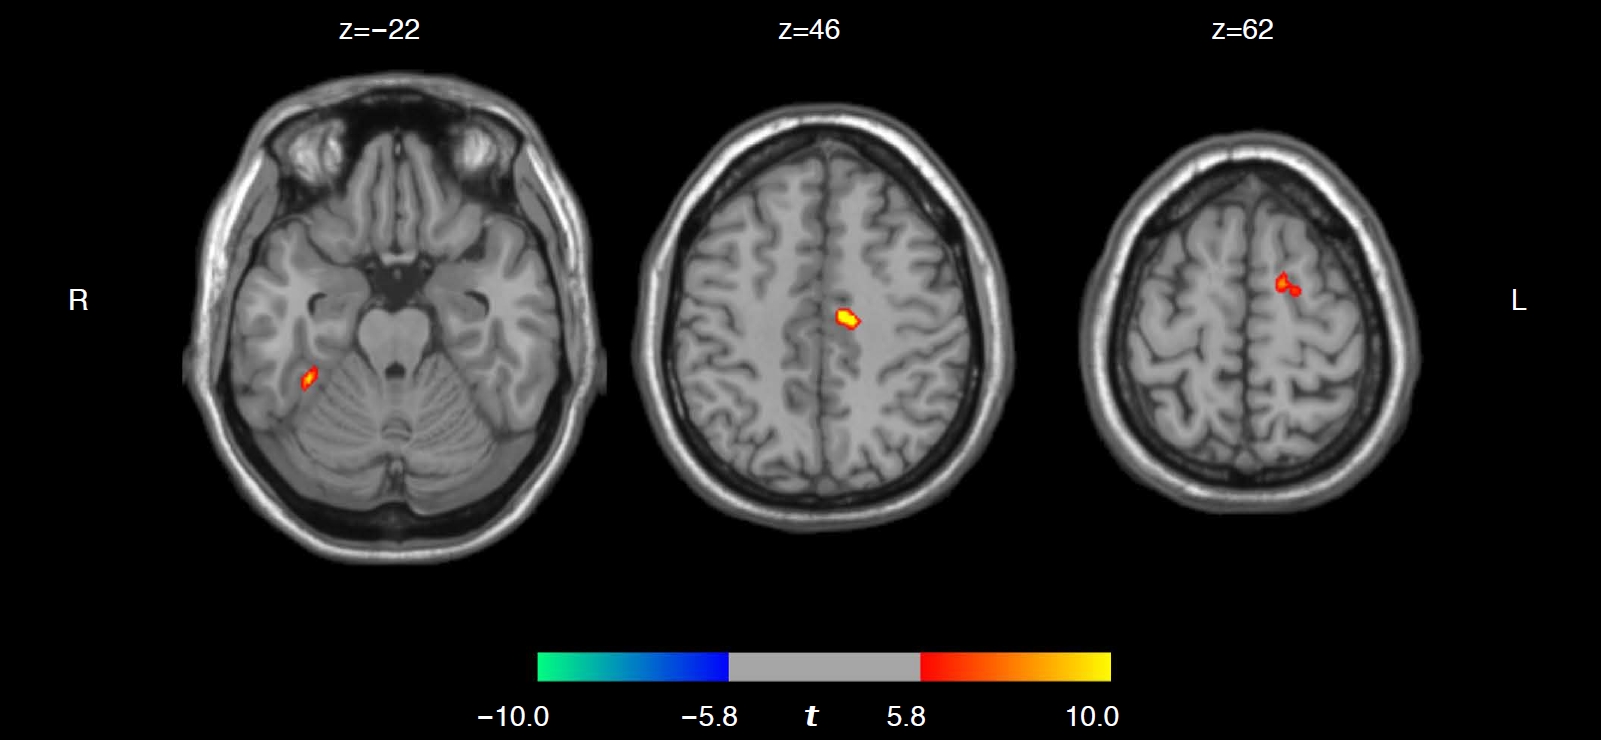
The PET analysis revealed a significant increase in rCMRglu following low-intensity tFUS in the right superior frontal gyrus (6.6%, P<0.001), right middle cingulate gyrus (5.5%, P<0.001), and left fusiform gyrus (5.4%, P=0.001) (Table 2, Fig. 3). No significant decrease in rCMRglu was observed following tFUS.
Discussion
We applied low-intensity tFUS to the unilateral hippocampal area in AD patients who received intravenous ultrasound contrast agent. As expected, since we used an ultrasound pressure level under the threshold for BBB opening, we found that tFUS did not result in BBB opening. Even without BBB opening, tFUS increased rCMRglu in the frontal, cingulate, and temporal lobes, and improved general cognitive function, executive function, and memory in patients with AD. Moreover, no acute or delayed adverse events were observed following tFUS. To the best of our knowledge, our study is the first report of tFUS-induced effects on cerebral glucose metabolism and cognition in patients with AD.
In our study, DCE-MRI following the tFUS session showed no evidence of BBB disruption. As pressure and the associated mechanical index (MI) are important indicators for achieving BBB disruption [6], we conjecture that the acoustic pressure level used in this study (in situ pressure of ~135 kPa and MI of 0.27), which was under the threshold for creating stable cavitation of MBs, was not high enough to cause BBB disruption. This conjecture is consistent with a previous investigation involving sheep in which localized enhancement of BBB permeability occurred in regions subjected to acoustic pressure levels greater than 480 kPa (MI, 0.96) after intravenous injection of the same type of MBs [21]. It is also in agreement with a study by Hynynen and colleagues [22], which reported that an in situ pressure of 200 kPa (MI of >0.4) was needed to induce BBB disruption when 0.05 mL/kg dose of MBs (Optison, GE Healthcare, Princeton, NJ, USA) was used in rabbits at a similar tFUS frequency (i.e., 260 kHz) and pulsing scheme (10 ms tone-burst duration, 1 Hz sonication for 20 s). As successful BBB disruption depends on many factors, such as the type of MBs, sonication parameters, and transducer configuration, and given that excessive disruption may cause deleterious effects such as microhemorrhage [6], cautionary countermeasures such as acoustic emission detection of undesirable inertial cavitation [23] are needed to promote the safety of the procedure.
We showed that hippocampal sonication with low-intensity tFUS improved rCMRglu in the temporal, cingulate, and frontal cortices. Moreover, mild improvement was noted in measures of global cognitive function, memory, and executive function. Although previous studies reported tFUS-induced BBB opening and ╬▓-amyloid plaque reduction in patients with AD, improvements in cognition or brain function were not observed [4,13]. Previous FDG-PET studies reported that AD patients show reduced rCMRglu in the parietal-temporal and frontal cortices in advanced stages [24]. Our results suggest that low-intensity tFUS may have exerted potential therapeutic effects on impaired brain function, which is related to cognitive decline. Although it is not clear how the effects of hippocampal sonication extended beyond the close proximity of the target site, we suspect that improvement in frontal lobe function may be related to potential functional modulation of the hippocampal-prefrontal cortex (H-PF) pathway by the application of tFUS. The H-PF pathway is a major monosynaptic input to the prefrontal cortex originating in the hippocampal formation [25]. The literature based on animal and human experiments supports the theory that the pathway is involved in fundamental cognitive processes including executive function and memory and contextually-dependent emotional regulation [26]. Although the exact mechanism behind tFUS-mediated neuromodulation remains to be elucidated, it is plausible that FUS application to the hippocampal area, even without changing BBB permeability, may increase activity in the hippocampal area and modulate neural activity of the H-PF pathway, resulting in the observed improvement in memory.
Some limitations of this study need to be addressed. First, this study was conducted among a small number of patients. For this reason, we did not perform a quantitative analysis of the neuropsychological data. Another potential limitation is that we only included AD patients with an overall symptom severity of moderate or severe. Future studies with larger samples and inclusion of patients with mild symptom severity are warranted. Moreover, further parameter exploration and safety assessment are needed to provide more convincing evidence of the therapeutic effects of low-intensity tFUS in AD.
In conclusion, our findings suggest that low-intensity tFUS under the threshold for BBB disruption was safely delivered and may have beneficial effects on cerebral glucose metabolism and cognitive function in patients with AD. With its exquisite spatial selectivity and significant depth penetration, tFUS may have the potential to serve as a novel non-invasive brain stimulation tool of both cortical and deep brain areas for the treatment of AD. As the field of tFUS-mediated neuromodulation is still in its developmental infancy, further studies are warranted to understand its therapeutic mechanism, safety, and efficacy.
 Download Citation
 PDF Links
 PubReader
 ePub Link
 Full text via DOI
 Full text via PMC


