

 Print
Print facebook
 twitter
 Linkedin
 google+

Introduction
Increasing clinical attention is being paid to nonalcoholic fatty liver disease (NAFLD) because of its increasing prevalence, which has reached 16%-45% in Western countries and 9%-29% in Eastern countries [1,2]. As NAFLD can progress to cirrhosis through nonalcoholic steatohepatitis (NASH), and NASH is the most common cause of liver transplantation for women in North America [3,4], the detection and quantification of hepatic steatosis are crucial for the management of patients with NAFLD.
Liver biopsy is still considered the gold standard for the assessment of hepatic steatosis. However, as liver biopsy is subject to several limitations such as procedural invasiveness, sampling error, and interobserver variability [5-7], there have been many efforts to develop a reliable noninvasive diagnostic test for the assessment of hepatic steatosis. In this regard, the controlled attenuation parameter (CAP) obtained from transient elastography was introduced and has been widely used in clinical practice. Although it can be used to quantify hepatic steatosis, it has several limitations including suboptimal diagnostic performance for hepatic steatosis (≥S1; 69% sensitivity and 82% specificity) [8] and a large number of invalid measurements in patients with obesity [9]. Of late, the noninvasive quantification of hepatic steatosis using magnetic resonance imaging (MRI) has been considered comparable to liver biopsy in terms of accuracy [10,11]. Nonetheless, it also has drawbacks of high cost and limited availability.
In recent years, imaging methods for measurement of the attenuation coefficient (AC) have been developed and commercialized by several vendors [2,12,13]. These AC measurements are similar to CAP in that they are ultrasound-based, but AC differs from CAP in that it is incorporated with B-mode ultrasonography, which enables the simultaneous visualization of hepatic parenchyma. B-mode ultrasound-guided measurements allow the echo signal transmitted by the probe to be delivered to the liver more directly and precisely, which may result in more reliable and accurate measurements. Given the advantages of AC over CAP, several studies have reported the diagnostic performance of AC, but the reported results are limited by small study populations (<100) [2,14,15], and there are conflicting results as to whether AC has better diagnostic performance than CAP [14,15].
Therefore, we considered it timely and important to determine the diagnostic performance of AC in the assessment of hepatic steatosis, and performed a systematic review and meta-analysis of prospective studies on the accuracy of AC for noninvasive grading of hepatic steatosis.
Materials and Methods
This study was conducted and reported following the Preferred Reporting Items for Systematic Reviews and Meta-Analysis of Diagnostic Test Accuracy Studies (PRISMA-DTA) guidelines [16].
Literature Search
A comprehensive literature search of the MEDLINE, Embase, and Cochrane databases was performed to identify relevant original research investigating the performance of ultrasound attenuation imaging for evaluating hepatic steatosis. The search terms included "fatty liver," "ultrasonography," and "attenuation," and a detailed list of the search terms is provided in Supplementary Table 1. Because attenuation imaging implemented using B-mode ultrasonography was first commercialized in 2017, the literature search was performed on studies published from January 1, 2017 to October 21, 2020. The searches were limited to articles published in the English language and concerning only human subjects.
Inclusion and Exclusion Criteria
After removing duplicates, the eligibility of each article was evaluated according to predefined inclusion and exclusion criteria. The study inclusion criteria were as follows: (1) patients: adult patients (≥18 years) potentially at risk of hepatic steatosis; (2) index test: attenuation imaging on ultrasound for measurements of AC; (3) comparison: biopsy or MRI; (4) outcomes: sensitivity and specificity of AC for diagnosing any grade of steatosis (≥S1) or advanced steatosis (≥S2); and (5) study design: prospective cohort studies or clinical trials. The exclusion criteria were as follows: (1) articles that did not address the topics of interest of this study; (2) case reports, review articles, editorials, letters, conference abstracts, and proceedings; (3) articles with a patient cohort and data overlapping with another published study (in such cases, the study with the more comprehensive results for the purpose of this study was selected); and (4) articles written in languages other than English. Articles were first screened by reviewing their titles and abstracts, and were removed if any of the exclusion criteria were met. The full texts of the remaining articles were then reviewed to determine their eligibility. The reviewers selected studies independently in two sequential review sessions. Articles with any degree of ambiguity or that generated differences in opinion between the two reviewers were re-evaluated at a consensus meeting to which a third reviewer was invited.
Data Extraction
The following data were extracted onto a predefined data form: (1) study characteristics, including authors, year of publication, institution, and subject enrollment (consecutive or selective); (2) patient characteristics including age, sex, body mass index (BMI), and the number of patients with NAFLD, significant fibrosis (≥F2) [17], and hepatic steatosis (≥S1, ≥S2) [18]; (3) ultrasound characteristics including scanner model and vendor, and AC cutoff values for ≥S1 and ≥S2; and (4) reference standard characteristics, including the type of reference standard used to evaluate hepatic steatosis and the interval between the reference standard and ultrasound measurements.
To determine the sensitivity and specificity of AC, the number of true-positive, true-negative, false-positive, and false-negative results were extracted using two-by-two diagnostic tables. When not explicitly reported, data were manually retrieved from the text, tables, and figures. Only results for at least 10 patients with hepatic steatosis (either ≥S1 or ≥S2) were extracted. If a study contained multiple AC measurements performed using different ultrasound transducers or by different operators, the results yielding the highest Youden index value were selected. Two reviewers independently performed data extraction, and any discrepancies were resolved by consensus between the two reviewers and a third reviewer.
Study Quality Assessment
Two independent reviewers assessed study quality using the Quality Assessment of Diagnostic Accuracy Studies (QUADAS-2) criteria [19]. The QUADAS-2 criteria consist of the four domains of patient selection, index test, reference standard, and flow of patients through the study and timing of the index test and reference standard, which were assessed using suggested questionnaires. Two reviewers determined the risk of bias and applicability of each individual study, with all discrepancies resolved by consensus between the reviewers and a third reviewer.
Statistical Analysis
When results for both ≥S1 and ≥S2 were available within a single study, the two results were analyzed as separate studies. The summary sensitivity and specificity of AC for diagnosing ≥S1 and ≥S2, as well as their 95% confidence intervals (CIs), were estimated using a bivariate random-effects model [20,21]. A summary receiver operating characteristics curve was obtained using a hierarchical summary receiver operating characteristics (HSROC) model. The heterogeneity of the summary statistics was evaluated using the Higgins I2 statistic, with an I2 value exceeding 50% considered to indicate substantial heterogeneity [22]. The presence of a threshold effect was evaluated by a visual assessment of a coupled forest plot of sensitivity and specificity, and the Spearman correlation coefficient between sensitivity and 1-specificity. A correlation coefficient exceeding 0.6 was taken to indicate the presence of a significant threshold effect [20,23]. Head-to-head comparison of diagnostic accuracy between AC and CAP was also performed using available studies.
Causes of study heterogeneity were investigated using meta-regression analysis with the following covariates: (1) study location (Asia vs. others), (2) ultrasound vendor (Canon vs. others), (3) BMI (≥25 kg/m2 vs. <25 kg/m2), (4) the proportion of patients with significant fibrosis (≥F2; ≥50% vs. <50%), (5) the proportion of patients with hepatic steatosis (≥S1; ≥50% vs. <50%), (6) the type of reference standard (biopsy vs. MRI), and (7) the interval between ultrasound measurements and the reference standard (same day vs. others).
Publication bias was visually assessed with a funnel plot, and statistical significance was evaluated using the Deeks asymmetry test, with P-values <0.05 considered indicative of statistical significance. All statistical analyses were performed using Stata version 15.1 (StataCorp LP, College Station, TX, USA).
Results
Literature Search
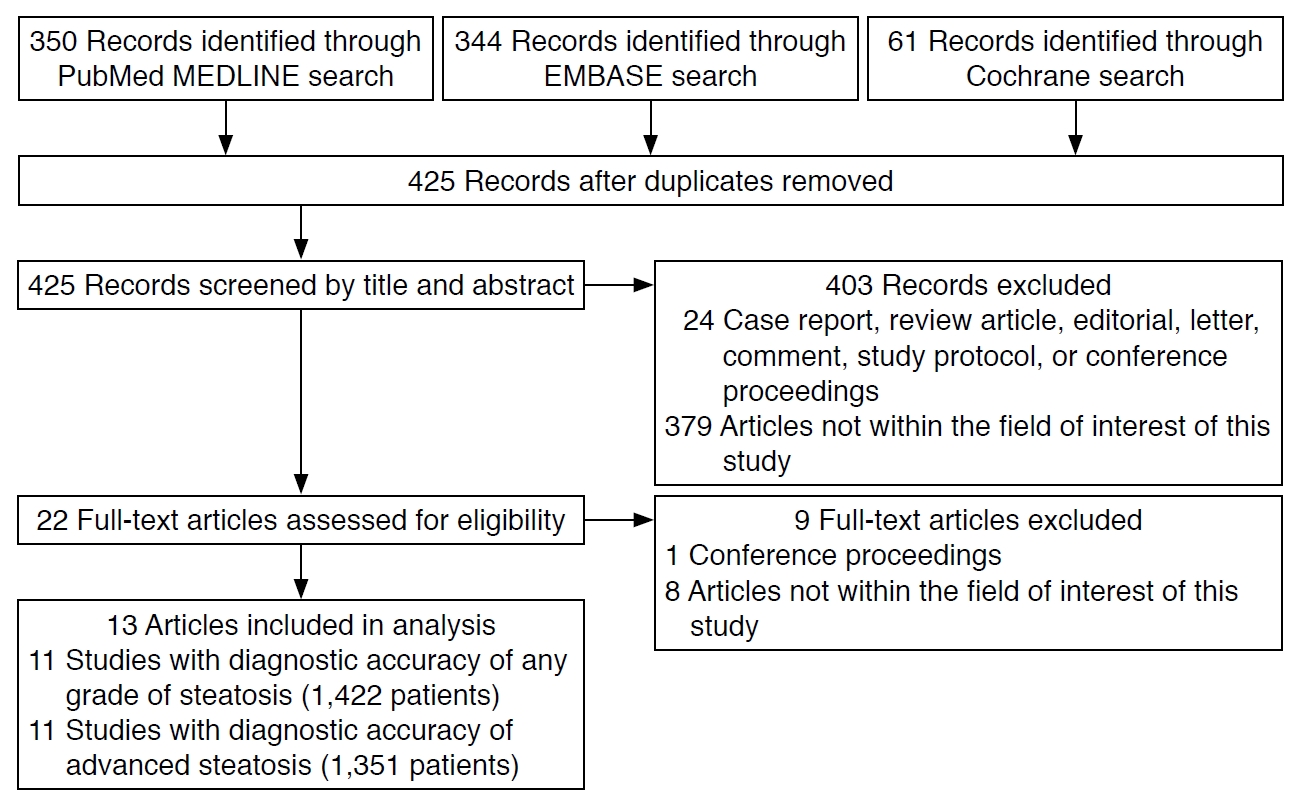
The article screening and selection process is illustrated in Fig. 1. Of the 425 articles identified after the removal of duplicates, 403 articles were excluded after screening their titles and abstracts. The remaining 22 articles were assessed for eligibility according to their full text, leading to 13 articles being finally included after the exclusion of nine articles. Nine of the included articles reported the diagnostic accuracy of AC for diagnosing both ≥S1 and ≥S2 [2,12,24-30], two articles reported it only for ≥S1 [14,15], and two reported it only for ≥S2 [13,31].
Article Characteristics
The characteristics of the included studies are shown in Table 1. Eight studies were conducted in Asia [2,12,14,24,25,28-30]. Nine studies performed AC measurements using a Canon ultrasound scanner [2,15,25-31]. Nine studies used liver biopsy as a reference standard to quantify hepatic steatosis [12-14,24,25,27-29,31], and seven performed liver biopsy and ultrasound on the same day [12,14,24,25,27-29]. Four studies used MRI with proton density fat fraction as the reference standard, with the mean/median interval between ultrasonography and MRI ranging from 7 to 32 days [2,15,26,30]. The mean BMI was over 25 kg/m2 in eight studies [2,13,15,24,26,27,29,31] and over 30 kg/m2 in two studies [13,15]. In nine studies [2,13,15,24-29] at least 50% of patients had hepatic steatosis, and in three studies at least 50% of patients had significant fibrosis [2,27,29]. The proportion of patients with NAFLD varied across studies (range, 3.4 to 100).
Study Quality
The study quality of the 13 articles is summarized in Supplementary Fig. 1. In the assessment of the risk of bias, one article that investigated the accuracy of AC in a biopsy-proven NAFLD cohort had an unclear risk in patient selection, as there were no details of the definition of significant alcohol consumption when excluding patients [13]. All articles had an unclear risk in index test domains because all used their own threshold of the index test determined in each cohort rather than prespecified one [2,12-15,24-31]. Two studies had an uncertain risk of bias in the reference standard domain because of the absence of information on whether the analysis was performed without knowledge of the results of the index test [27,30]. Three studies had an uncertain risk of bias in the flow and timing domain because of uncertainty in the appropriateness of the time interval between the index test and reference standard [2,13,31]. Regarding concerns over applicability, one study showed uncertainty in the patient selection domain as it included only patients with biopsy-proven NAFLD, and the full range of steatosis was not evaluated, which might have given rise to spectrum bias [13].
SAccuracy of AC for Diagnosing ≥S1 and ≥S2 Hepatic Steatosis
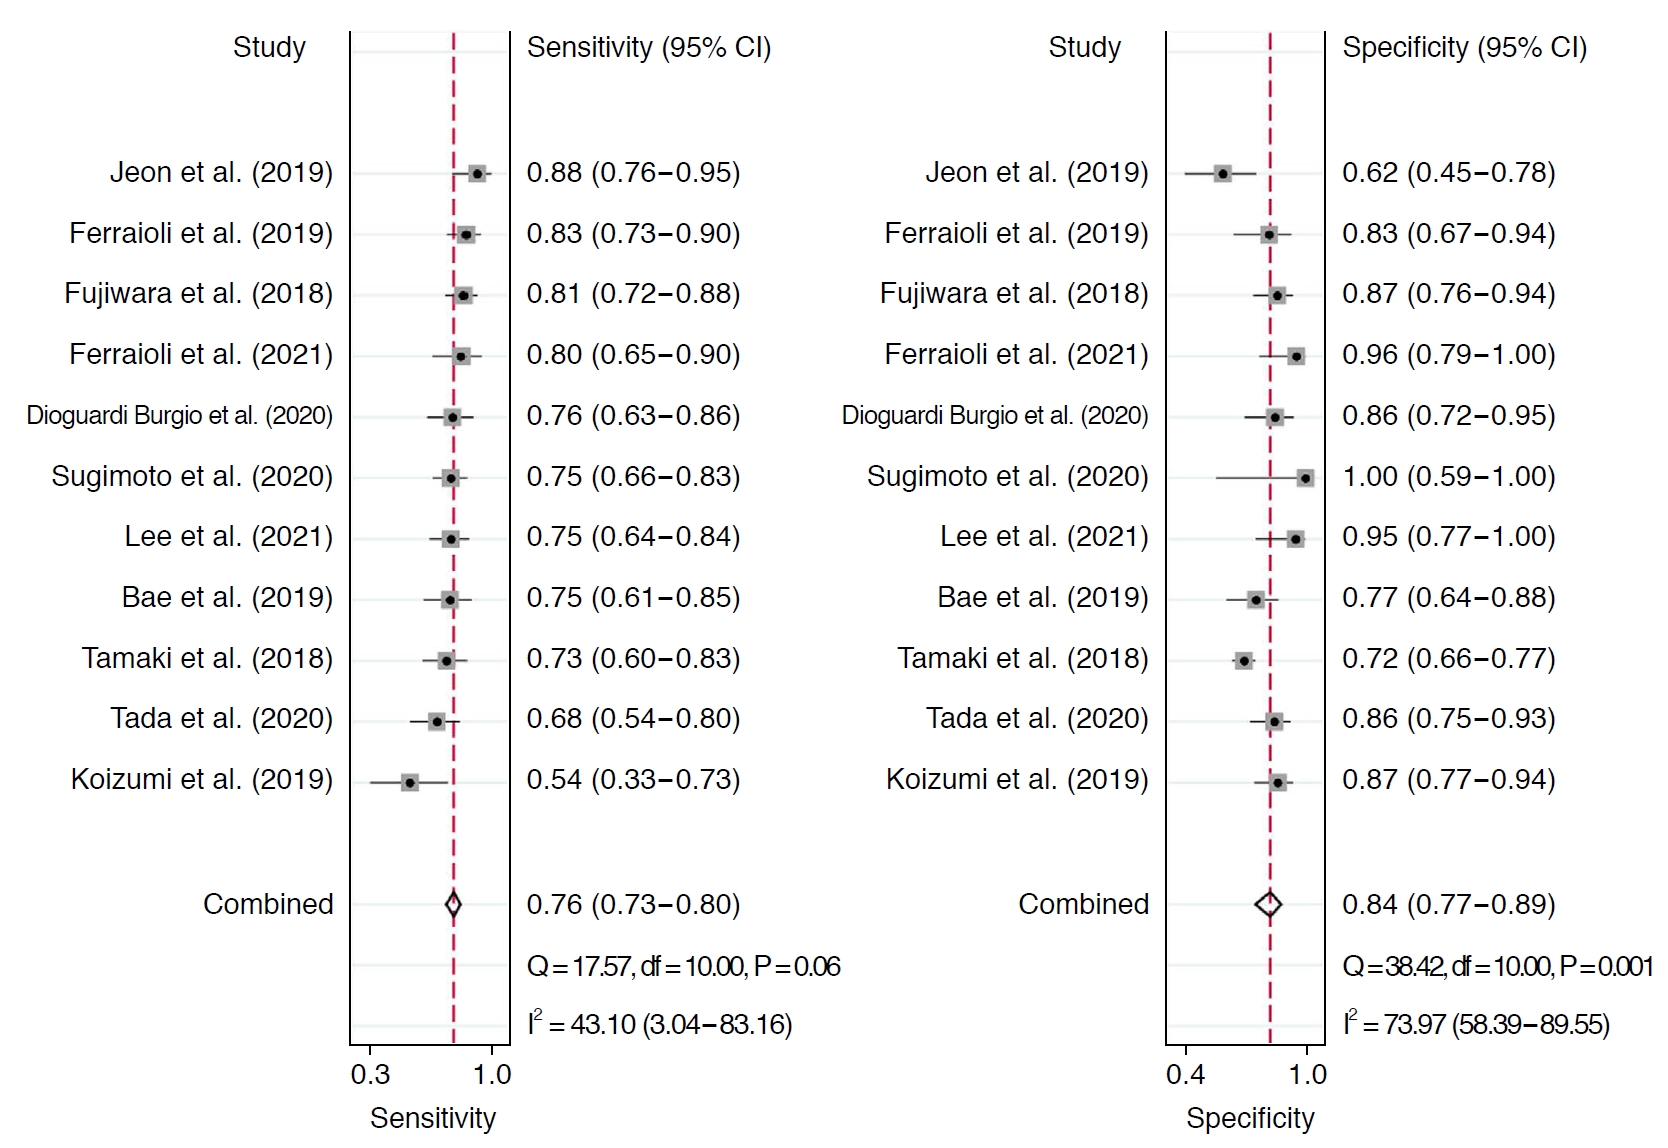
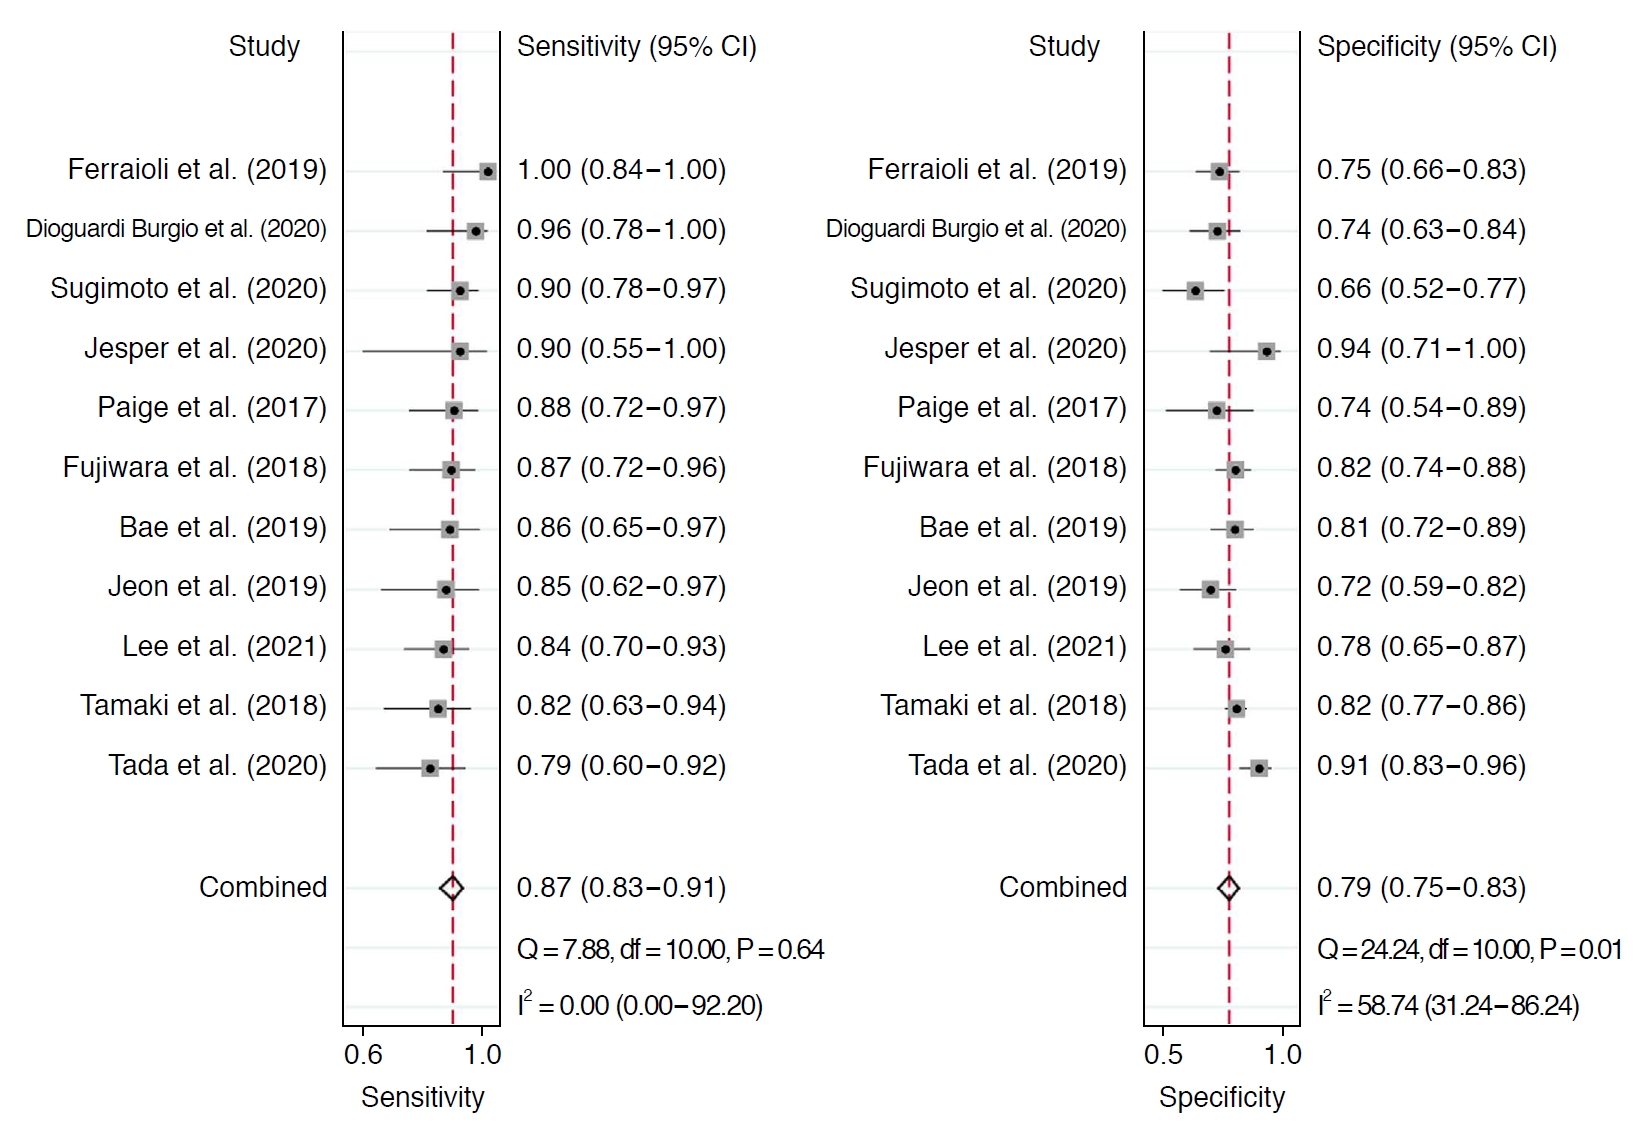
Table 2 summarizes the sensitivity and specificity of AC for diagnosing ≥S1 and ≥S2 in each individual study. In 11 studies including 1,422 patients, the pooled sensitivity and specificity of AC for the diagnosis of stages ≥S1 were 76% (95% CI, 73% to 80%) and 84% (95% CI, 77% to 89%), respectively (Fig. 2). Sensitivity did not show significant heterogeneity across studies (I2=43%), but substantial heterogeneity was noted in specificity (I2=74%). The coupled forest plots did not reveal a threshold effect, nor did the Spearman correlation (coefficient, 0.13; P=0.709). The median AC cutoff for diagnosis of ≥S1 was 0.63 (range, 0.53 to 0.69). In 11 studies including 1,351 patients, the pooled sensitivity and specificity of AC for stages ≥S2 were 87% (95% CI, 83% to 91%) and 79% (95% CI, 75% to 83%), respectively (Fig. 3). Sensitivity was not affected by study heterogeneity (I2 =0%), but marginal study heterogeneity was present in specificity (I2 =59%). No threshold effect was indicated by visual assessment of coupled forest plots or the Spearman correlation (coefficient, 0.37; P=0.258). The median AC cutoff for diagnosis of ≥S2 was 0.69 (range, 0.60 to 0.77). The areas under the HSROC curves for ≥S1 and ≥S2 were 0.83 (95% CI, 0.80 to 0.86) and 0.91 (95% CI, 0.88 to 0.93), respectively (Supplementary Fig. 2A, B).
The head-to-head comparative result of diagnostic accuracy between AC and CAP was reported in three studies for ≥S1 [15,24,26] and two studies for ≥S2 [24,26], respectively. The pooled sensitivity, specificity, and the area under the receiver operating characteristic curve (AUROC) of AC were 81% (95% CI, 76% to 86%), 88% (95% CI, 82% to 94%), and 0.91 (95% CI, 0.87 to 0.95) for ≥S1, and 92% (95% CI, 84% to 99%), 79% (95% CI, 73% to 84%), and 0.89 (95% CI, 0.82 to 0.96) for ≥S2, respectively. The pooled sensitivity, specificity, and AUROC of CAP were 74% (95% CI, 68% to 79%), 83% (95% CI, 76% to 89%), 0.85 (95% CI, 0.80 to 0.90) for ≥S1, and 84% (95% CI, 75% to 94%), 74% (95% CI, 68% to 79%), 0.87 (95% CI, 0.82 to 0.92) for ≥S2, respectively. Although AC had higher sensitivity (81% vs. 74% for ≥S1, 92% vs. 84% for ≥S2) and AUROC (0.91 vs. 0.85 for ≥S1, 0.89 vs. 0.87 for ≥S2) than CAP, the difference was not statistically significant (P>0.05).
Meta-regression Analysis
The results of the meta-regression analysis are summarized in Table 3. Among the seven covariates, the proportion of patients with significant fibrosis, hepatic steatosis, and BMI were significant factors associated with study heterogeneity (P≤0.03). For the diagnosis of ≥S1, AC showed a higher sensitivity in studies with ≥50% of patients with hepatic steatosis (79% vs. 67%) and in studies with patients with a high BMI (≥25 kg/m2) (80% vs. 67%). For diagnosis of ≥S2, AC showed a lower specificity in studies with ≥50% of patients having significant fibrosis (71% vs. 81%) and in studies with patients with a high BMI ≥25 kg/m2 (76% vs. 86%).
Publication Bias
There was no significant publication bias in the analyses of either ≥S1 or ≥S2 (P=0.07 and P=0.15, respectively) (Supplementary Fig. 3A, B).
Discussion
In this meta-analytic study evaluating the diagnostic value of AC for hepatic steatosis, AC had good overall diagnostic accuracy for grades ≥S1 (76% sensitivity and 84% specificity) and grades ≥S2 (87% sensitivity and 79% specificity). In our head-to-head comparison of diagnostic accuracy between AC and CAP, AC showed a tendency for higher sensitivity for both ≥S1 (81% vs. 74%) and ≥S2 (92% vs. 84%) than CAP. When we consider our head-to-head comparative results between AC and CAP and the diagnostic accuracy of CAP reported in a recent meta-analysis (69% sensitivity and 82% specificity for ≥S1, and 77% sensitivity and 81% specificity for ≥S2) together [8], AC has higher sensitivity than CAP, but similar specificity. The better diagnostic performance of AC compared with CAP can be explained by the image-guided method for the measurement. The AC measurement procedure also involves grayscale B-mode ultrasound images, which can help in the accurate placement of regions of interest within the liver parenchyma. This helps to avoid structures such as large hepatic vessels or focal liver lesions that might affect the measurement results, and also helps to reduce undesirable attenuation of the echo signal by the skin and subcutaneous tissue, which may adversely affect measurements [9,27,28,32]. Therefore, AC may be a more accurate and reliable diagnostic tool than CAP for the assessment and quantification of hepatic steatosis.
In this meta-analysis, study heterogeneity ranging from marginal to substantial was noted for specificity, and the meta-regression analysis found three factors significantly associated with heterogeneity: the proportion of patients with significant fibrosis, the proportion of patients with hepatic steatosis, and BMI. Because the speckled pattern of the liver parenchyma may change from homogeneous to heterogeneous during the progression of hepatic fibrosis [33], the presence of fibrosis may change the US attenuation of the liver [34], and the reported performance of AC may differ according to the proportion of patients with significant fibrosis. The proportions of patients with hepatic steatosis and high BMI were also significantly associated with study heterogeneity. Considering that diagnostic test accuracy can vary according to patient subgroups, the spectrum of disease, the clinical setting, and the test interpreters [35], the accuracy can depend on differences in the targeted subjects. In addition, as AC is generally estimated from the slope of the ultrasound echo signal intensity obtained [2,36], it can be conjectured that patients with a higher BMI would have a longer distance between the skin and liver capsule, which could result in overestimates of the AC (i.e., high sensitivity but more false-positive cases at a given cutoff) [25,37].
The AC cutoff values for diagnosing ≥S1 and ≥S2 ranged from 0.53 to 0.69 and 0.60 to 0.77, respectively. Although the cutoff value used in each individual study was different, there was no threshold effect in the diagnosis of grades of either ≥S1 or ≥S2. However, because the optimal cutoff value was determined using the highest Youden index in the 13 included studies [2,12-15,24-31], the general applicability of the AC would be limited. In addition, the study cohort in all studies consisted of patients with various liver diseases and different spectrum of steatosis, which might also affect the different cutoffs [8,38]. Considering that hepatic steatosis requires longitudinal follow-up, a further study with a large number of homogeneous study subjects is required to determine the appropriate cutoff value for assessing hepatic steatosis.
This study has several limitations. First, the study was not preregistered before it was conducted. Second, although we summarized the median cutoff values for diagnosing ≥S1 and ≥S2, there may be limitations in distinguishing ≥S1 and ≥S2 in clinical practice. Through this study, it was not possible to obtain the exact optimal cutoff for assessing hepatic steatosis because of the different cutoff values used in the included studies and the insufficient details provided. An individual patient data meta-analysis of AC is required to investigate the optimal cutoff value. Third, marginal to substantial study heterogeneity was noted for specificity, which could preclude the creation of solid meta-analytic summary estimates. On the contrary, statistical heterogeneity was not found for sensitivity, which is generally considered to be of more importance than specificity in a screening test for the detection of hepatic steatosis. In addition, an attempt was made to minimize study heterogeneity by including only prospective studies.
In conclusion, AC can be clinically useful for assessing hepatic steatosis and showed good overall diagnostic performance. The data reported in published studies differed according to the prevalence of steatosis or significant fibrosis and BMI, and careful interpretation with consideration of these factors might be needed.
 Download Citation
 PDF Links
 PubReader
 ePub Link
 Full text via DOI
 Full text via PMC


