

 Print
Print facebook
 twitter
 Linkedin
 google+

Introduction
Cardiovascular risk in asymptomatic individuals is assessed on the basis of conventional cardiovascular risk factors (CVRFs), and most cardiovascular events are linked to elevated CVRFs [1]. However, previous studies, such as the Progression of Early Subclinical Atherosclerosis (PESA) study [2], have prospectively shown that individuals with a low CVRF burden may still have subclinical atherosclerosis, especially young people and women. CVRFs underlie most cardiovascular events, and even in healthy individuals, their rational evaluation determines strategies to arrest disease development [2,3]. European guidelines recommend using Systematic COronary Risk Evaluation (SCORE) charts to assess overall 10-year cardiovascular risk for risk factor management [4]. The SCORE algorithm includes age, sex, smoking status, systolic blood pressure (SBP), and serum total cholesterol (TC), enabling a rapid calculation of risk [4]. Previous studies have shown that SCORE-estimated risk is highly associated with cardiovascular disease progression [5] and prevalent subclinical atherosclerosis [6] in the general population. However, up-to-date evidence showing that the sole use of SCORE-estimated risk stratification translates into a reduction in cardiovascular disease morbidity and mortality is scarce [7].
Increasingly many studies are reinforcing the potential value of risk assessment to detect atherogenesis using non-invasive imaging techniques, including various ultrasound modalities [8]. For decades, carotid intima-media thickness (cIMT) has been more widely explored in terms of its relationship with cardiovascular risk than direct evaluation of atheromas [9]. However, a recent large-scale meta-analysis (119 clinical trials involving 100,667 patients) revealed the final missing link supporting the usefulness of cIMT progression as a surrogate marker for cardiovascular risk [10]. Moreover, the prevalence of abnormal cIMT was low (9%) in the PESA study, despite the overall high prevalence of early atherogenesis (63%) [2]. Consequently, an appropriate enhanced modality is clearly needed to evaluate the subclinical phase before morphological alterations that manifest as cIMT thickening or plaques.
Atherogenesis with microstructural remodeling of arterial walls in the very early stages can lead to increased arterial stiffness [11,12], which is directly associated with increased cardiovascular and all-cause mortality risk [13,14]. Ultrafast pulse wave velocity (ufPWV) is a novel modality of ultrafast ultrasound imaging that can assess arterial stiffening in vivo. It is non-invasive, reproducible, and relatively inexpensive [15]. Unlike all prior pulse wave velocity (PWV) techniques, such as brachial-ankle PWV or carotid-femoral PWV, ufPWV directly photographs the propagation of heart pulse waves with ultrafast speeds (>2,000 frames/s). Afterwards, it calculates carotid PWV almost in real time [16]. Prior studies have shown that increased arterial stiffness detected by ufPWV is highly associated with atherosclerotic risk factors, including dyslipidemia [17], hypertension [18], diabetes mellitus [19], and coronary artery disease [20]. The authors’ previous studies have shown that ufPWV can be utilized in healthy individuals with non-thickened cIMT [17] or with no major CVRFs [21] to identify notable carotid stiffening, suggesting that ufPWV could be used for the early phase of atherogenesis risk assessment. However, to date, it is still not clear whether carotid stiffness quantified by ufPWV is associated with the SCORE, which is routinely used to identify 10-year overall cardiovascular risk in clinical practice.
The aim of this study was to utilize ufPWV to quantify arterial stiffness and compare ufPWV findings with the SCORE algorithm to explore the association between arterial stiffening and the presence of overall atherogenesis risk in a middle-aged population.
Materials and Methods
Compliance with Ethical Standards
This study was approved by the ethics committee of the Affiliated Hospital of Nanjing University of Chinese Medicine (2017NL-048-02), and the methods were carried out in accordance with the Declaration of Helsinki. Written informed consent was obtained from all patients.
Study Participants
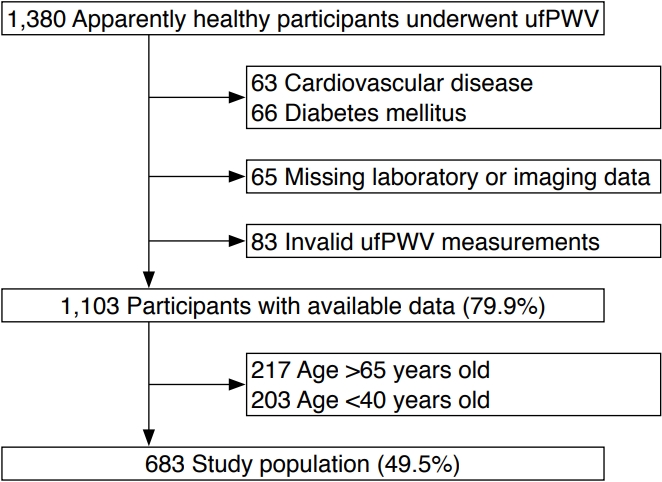
SCORE charts are recommended for assessing apparently healthy people, not those with cardiovascular disease or at a very high or high risk of other conditions, such as diabetes mellitus [4]. In this cohort, the definition of apparently healthy people was (1) no history of known cardiovascular disease, cancer, chronic liver, autoimmune or kidney disease, or any disease expected to decrease life expectancy; and (2) an ability to undergo an ultrasonography examination of both sides of the carotid. Between May 2017 and April 2021, 1,380 apparently healthy participants were prospectively and consecutively enrolled in this study to undergo heath checkups and ufPWV examinations. Of those, 1,103 participants with available data were included in the analysis after excluding those with known cardiovascular disease or diabetes mellitus (n=129) due to missing laboratory or imaging data (n=65) or invalid ufPWV measurements (n=83, detailed in the ufPWV protocol) (Fig. 1). To assess the association between ufPWV and SCORE, which is recommended for use in middle-aged individuals (40-65 years of age) [4], 420 individuals were excluded because they were aged <40 years or >65 years (Fig. 1). Finally, 683 participants (49.5% of all enrolled participants) were included for further analysis (Fig. 1). The estimated glomerular filtration rate (eGFR) was calculated according to the Chronic Kidney Disease Epidemiology Collaboration equation [22].
SCORE
The 2016 SCORE risk chart [4], which requires data on sex, age, smoking, SBP, and TC, was used to calculate a score for each participant. Smoking was defined in accordance with the European Society of Cardiology guidelines for cardiovascular disease prevention [4]. SBP and diastolic blood pressure (DBP) were assessed in each arm thrice using an automatic device (Omron, Kyoto, Japan). The mean highest blood pressure value from each arm was used for analysis. Laboratory findings, including hemoglobin, fasting blood glucose, uric acid, low-density lipoprotein (LDL), high-density lipoprotein (HDL), triglyceride (TG), and TC, were analyzed in the hospital laboratory using a venous blood sample collected after an overnight (8 hours) fast. Based on the calculated SCORE, each participant was assigned to one of four risk groups: low risk, <1%; moderate risk, 1%-4%; high risk, 5%-9%; and very high risk, ≥10% [4].
cIMT and ufPWV Protocol
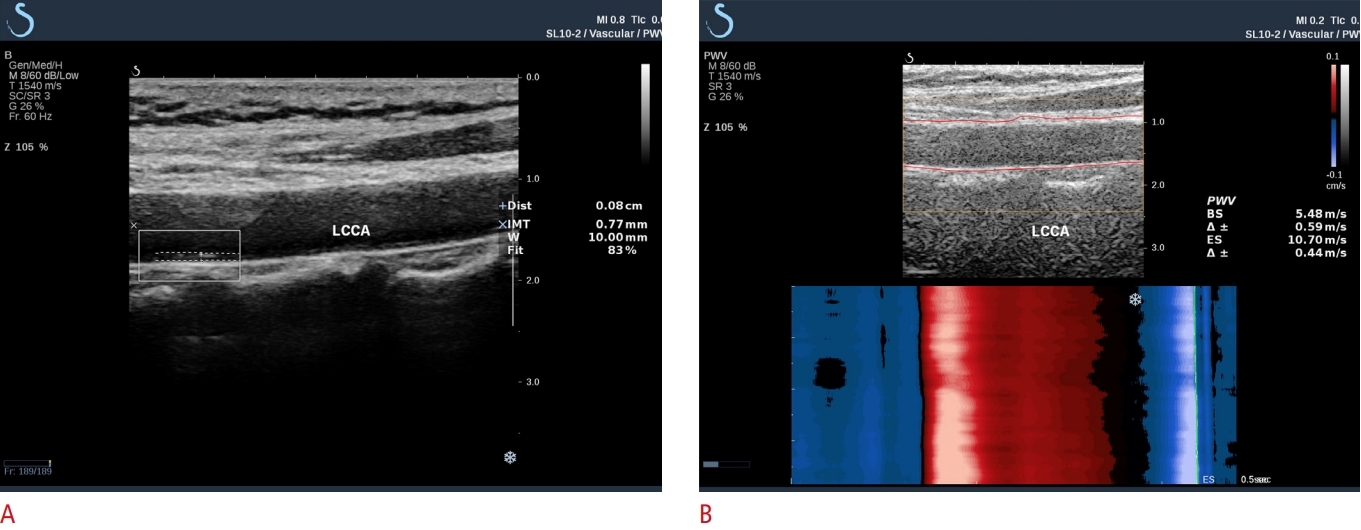
All carotid ultrasound examinations were performed according to a standardized protocol [23] by sonographers specifically trained in carotid ultrasound techniques. cIMT and ufPWV were performed in all participants using a Supersonic Imagine ultrasound device equipped with an SL10-2 linear array probe (Supersonic Imagine, Aix-en-Provence, France). cIMT was measured with the Aixplorer cIMT automatic measurement system (ACAMS), as described previously [17,21] (Fig. 2A). The width of the automatically traced cIMT region divided by the region of interest (ROI; 1.0 cm) formed a ratio termed "fit" (Fig. 2A). A fit of ≥70% was considered a valid measurement. Three valid cIMT values were obtained in the left and right common carotid arteries (CCAs), respectively. For each participant, the mean of all cIMT values was recorded as the final cIMT value.
The ufPWV protocol is illustrated in Fig. 2B. The detailed ufPWV acquisition process and methodology have previously been reported by the authors of the present study, together with satisfactory validation of intra- and inter-operator reproducibility of this novel technique [17,21]. In brief, the probe was placed at the carotid non-plaque region to include the main CCA segment, ~1.0-1.5 cm away from the bulb. Participants were instructed to hold their breath for 5 seconds while ufPWV was measured. After stable ufPWV imaging was achieved (~3 seconds), the ROI box automatically covered and tracked the carotid walls. Then, the PWV at the beginning of systole (PWV-BS), the PWV at the end of systole (PWV-ES), and the variance of each (Δ±) were calculated, respectively (Fig. 2B). A variance of ≤1.0 m/s in ufPWV was considered indicative of a valid measurement. Invalid measurements included those with (1) failure to calculate PWV-BS or PWV-ES; (2) Δ± of >1.0 m/s; (3) improper ROI localization with the tracing line outside of the arterial wall [17,21]. For each participant, three valid ufPWV measurements were recorded, and the mean of the left and right CCAs was used as the final ufPWV value.
Statistical Analysis
All statistical analyses were conducted using SPSS version 18 (SPSS Inc., Chicago, IL, USA). Baseline characteristics are presented as mean±standard deviation for continuous variables, and as counts and proportions for categorical variables. The distribution of continuous variables was assessed by the Kolmogorov-Smirnov Z test. Differences between normally distributed continuous variables, non-normally distributed continuous variables, and categorical variables were analyzed using the independent-sample Student t-test, Mann-Whitney U test and chi-square test, respectively. The Levene homogeneity test of variance was performed, and if its P-value was <0.05, a corrected P-value of the t-test was reported. Histograms were performed to compare cIMT, PWV-BS, and PWV-ES between age and SCORE subgroups. For detailed analyses of the associations between cIMT, ufPWV, major CVRFs, and SCORE, Pearson correlation coefficients were employed (except for sex and smoking, since dichotomous variables cannot be assessed with a linear correlation analysis). Percent stacked area charts were used to assess the distribution of SCORE in age and sex subgroups. To compare the effects of different ufPWV values on SCORE-estimated risk in this cohort, univariable and multivariable analyses were conducted to calculate crude and adjusted odds ratios (ORs) with 95% confidence intervals, respectively. The candidate adjusted variables in the multivariable models were age, sex, smoking, SBP, and TC, which were major CVRFs in the SCORE assessment system. A P-value of <0.05 was considered to indicate statistical significance.
Results
Baseline Characteristics of the Study Cohort
Our study consisted of 683 individuals (mean age, 53.4±7.1 years), of whom 50.4% were women (n=344; mean age, 52.5±7.0 years), and 49.6% were men (n=339; 54.3±7.2 years). Baseline demographic, clinical, and laboratory findings are summarized in Table 1. All measurements differed significantly according to sex subgroups (all P<0.05). Men had a notably higher body mass index, current smoking proportion, SBP, DBP, hemoglobin, fasting blood glucose, uric acid, LDL, TG, and TC levels, but a lower eGFR and HDL than women (all P<0.05).
Associations between Age, Sex, cIMT, and Carotid Stiffening
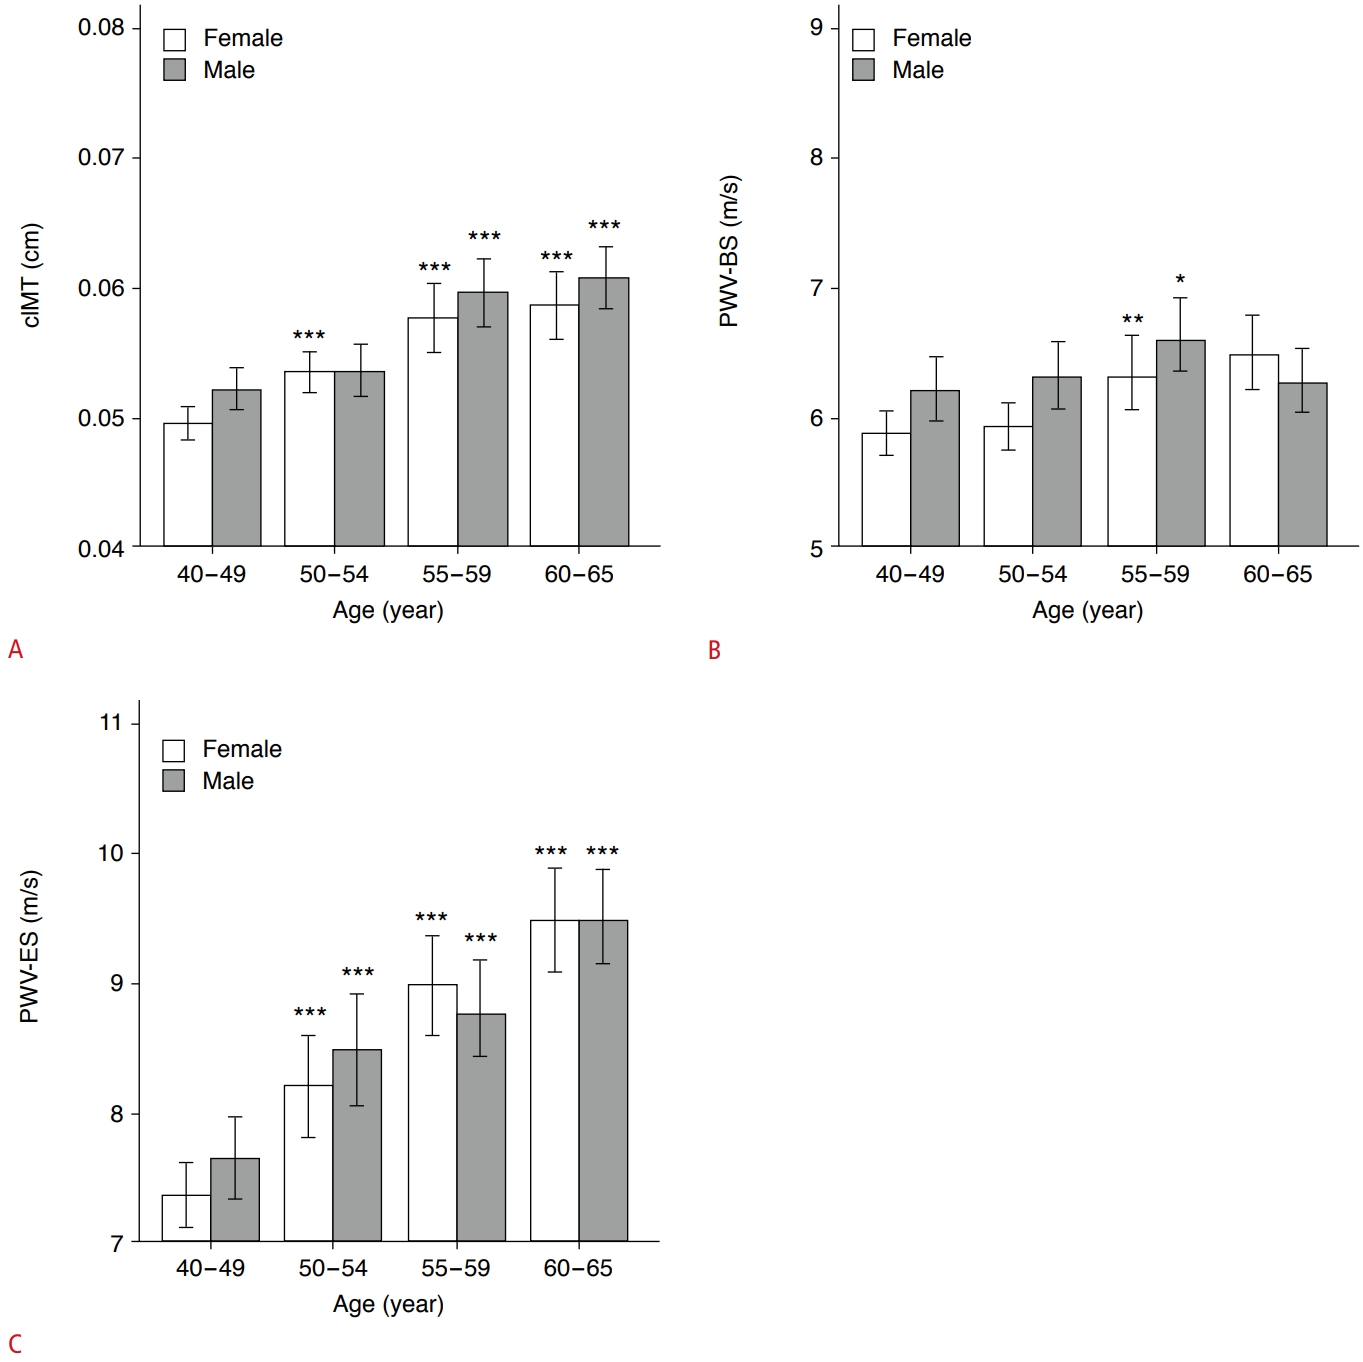
Table 2 shows that men had a remarkably higher cIMT (P<0.001), PWV-BS (P=0.005), and PWV-ES (P=0.028) than women. To assess the association between cIMT, carotid stiffening and age, respectively, the middle-aged participants were further subdivided into four age subgroups as follows: 40-49 years (n=200 [29.3%]; men, n=85; women, n=115; as a control group), 50-54 years (n=162 [23.7%]; men, n=70; women, n=92), 55-59 years (n=147 [21.5%]; men, n=82; women, n=65), 60-65 years (n=174 [25.5%]; men, n=102; women, n=72). Compared with the 40- to 49-year subgroup, men and women in the 50- to 65-year subgroups demonstrated markedly higher cIMT values (all P<0.001), except for 50- to 54-year-old men (P=0.275) (Fig. 3A). Participants in the 55- to 59-year subgroup had significantly higher PWV-BS values than control participants (all P<0.05) (Fig. 3B). However, PWV-ES gradually increased with age in both men and women (all P<0.001) (Fig. 3C). Furthermore, cIMT (r=0.408, P<0.001), PWV-BS (r=0.152, P<0.001), and PWV-ES (r=0.429, P<0.001) were all positively correlated with age in middle-aged participants (Table 3).
Relationship of SCORE with Age, Sex, cIMT, and Carotid Stiffening
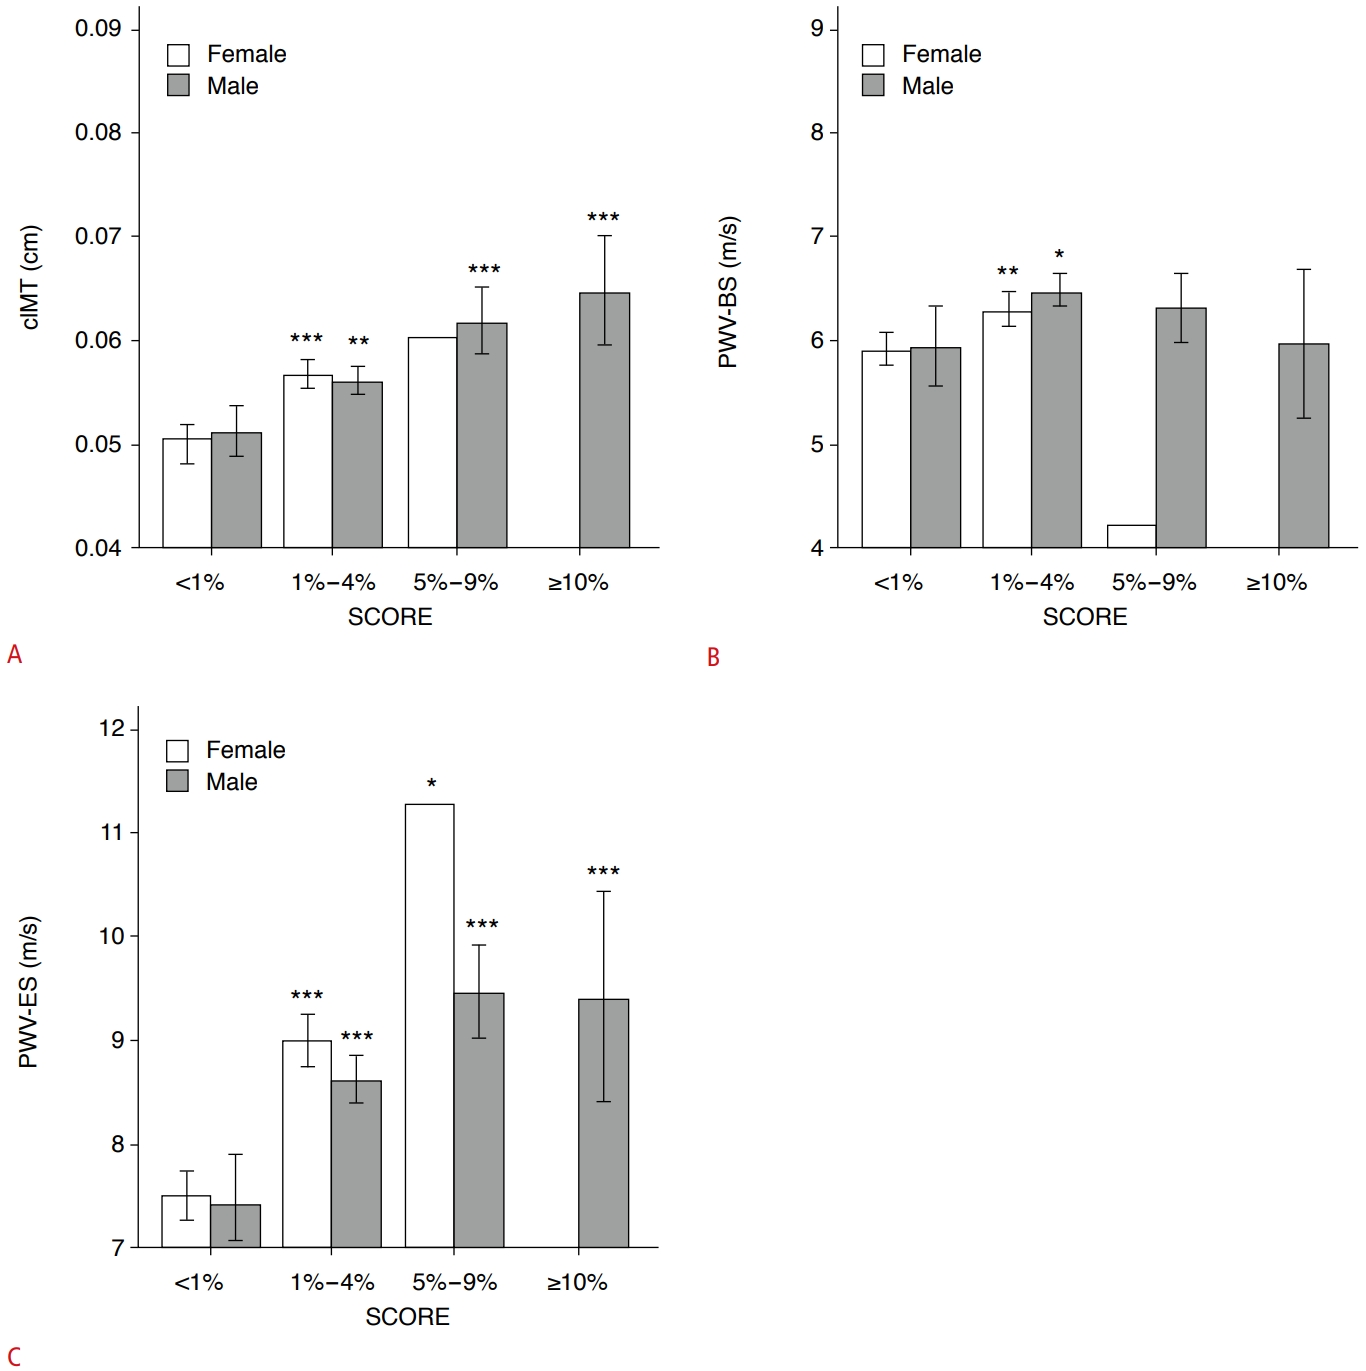
The proportions of SCORE-estimated risk differed significantly between men and women in this cohort (P<0.001) (Table 2). Men and women both had the highest proportion in the 1%-4% risk subgroup (67.3% for men; 55.5% for women). The second-highest ratio was observed in the 5%-9% risk subgroup for men (17.4% vs. 0.3% in women) and in the <1% risk subgroup for women (44.2% vs. 10.9% in men). In addition, one female participant was classified as belonging to the 5%-9% risk subgroup, and none were in the >10% risk subgroup (vs. 4.4% in men) (Table 2). The SCORE-estimated risk proportion gradually increased with age in women and men in this cohort (Fig. 4A, B). Furthermore, compared with the <1% risk subgroup, participants with ≥1% risk had a greater cIMT (all P<0.05), except for the 5%-9% risk subgroup in women (P=0.193) (Fig. 5A). Only in the 1%-4% risk subgroup, PWV-BS was higher than in the <1% risk subgroup (all P<0.05) (Fig. 5B). However, PWV-ES gradually increased in all ≥1% risk subgroups for both sexes (all P<0.001, except for the 5%-9% risk subgroup, where P=0.012) (Fig. 5C). In total, some major CVRFs utilized in the SCORE assessment were correlated with PWV-BS for TC (r=0.093, P=0.015), while cIMT (r=0.306, P<0.001) and PWV-ES (r=0.340, P<0.001) were correlated with SBP (Table 3). Furthermore, cIMT (r=0.388, P<0.001), PWV-BS (r=0.159, P<0.001), and PWV-ES (r=0.405, P<0.001) were all positively correlated with SCORE-estimated risk in middle-aged participants (Table 3).
Predictive Value of Increased ufPWV for SCORE-Estimated Risk Progression
Utilizing the low-risk subgroup as the reference control, univariable analyses showed significant associations between carotid stiffening and SCORE-estimated risk with PWV-BS (OR, 1.51 and OR, 1.36 for moderate-risk and high-risk subgroups, respectively, all P<0.001, and P=0.824 in the very-high-risk subgroup) and PWV-ES (OR, 1.61; OR, 2.05; and OR, 1.95 in the moderate-risk, high-risk, and very-high-risk subgroups, respectively, all P<0.001) (Table 4). In multivariable models adjusted for sex, SBP, TC, and smoking, higher PWV-BS values were associated with SCORE-estimated risk only in the moderate-risk subgroup (OR, 1.37; P=0.002), but not in the high-risk or very-high-risk subgroups (P=0.747 and P=0.994, respectively) (Table 4). With the same adjusted conditions, higher PWV-ES values were associated with SCORE-estimated risk in the moderate-risk (OR, 1.63; P<0.001) and high-risk (OR, 2.12; P=0.024) subgroups, but not in the very-high-risk subgroup (P=0.992) (Table 4). However, the predictive values of increased PWV-BS and PWV-ES for SCORE-estimated risk progression were non-independent of age in all ≥1% risk subgroups (all P>0.05) (Table 4).
Discussion
It is widely accepted that age, sex, high blood pressure, smoking, and dyslipidemia are major CVRFs, which cluster and interact multiplicatively to foster the development of cardiovascular disease and to promote atherogenesis risk [24]. The main findings of this study are that in apparently healthy participants without established cardiovascular disease or diabetes mellitus, ufPWV was positively associated with SCORE-estimated risk in middle-aged participants. In addition, the predictive role of PWV-ES was independent of some major CVRFs, except for age, highlighting an extraordinarily close link between arterial stiffening and aging. Consistent with this, previous studies have shown that elevated carotid-femoral PWV and estimated PWV were associated with subsequent mortality, cardiovascular morbidity, and SCORE, albeit not independently of some major CVRFs [25,26]. However, they do not support changing SCORE by including arterial stiffening in the risk equation, since estimated PWV does not improve the risk function based on conventional CVRFs, which are covered by SCORE [26]. Moreover, the findings of the present study show that ufPWV can differentiate low-risk individuals from individuals with SCORE categories indicating moderate risk, high risk, or very high risk. Of note, a 1.0 m/s increase in PWV-ES indicated a low risk of significant coronary or carotid artery disease translating to a higher stage, with positive odds showing a near doubling (OR, 1.61 to 2.05). This suggests that ufPWV might be a useful add-on to SCORE in routine clinical practice. Of course, sufficient and substantial validation of the technique, prognostic information, and cohort dependency are first required.
Age is a vital marker of atherogenesis for duration of exposure to known and unknown CVRFs [27]. In this study, a stronger correlation was observed between carotid stiffening and age than between carotid stiffening and SCORE categories or other CVRFs. In fact, this correlation was weak when considering previous studies utilizing ufPWV (0.304-0.476 for PWV-BS and age; 0.682-0.721 for PWV-ES and age) [17,21,28]. This is likely related to the middle-aged population incorporated in this cohort, which had a limited age range of 40-65 years. However, recent evidence has reinforced the potential role of the SCORE risk chart to estimate the risk of atherosclerosis in its very early stages [6], which at present are proven to be covered by ufPWV assessments [17,21], yielding that the SCORE algorithm may be applied to younger individuals in the future. Furthermore, the better predictive value of PWV-ES rather than PWV-BS might be due to the substantial difference in wall recoil during a cardiac cycle, since early systolic expansions powered by left ventricular ejection may hinder the detection of minute differences in wall stiffness.
Sex differences also play a crucial role in atherogenesis due to the protective effect of endogenous estrogen in women [29]. The present study found that cIMT, carotid stiffening, SCORE categories, and major CVRFs all differed notably between sexes, whereas they all had the same trend in age-related atherosclerotic progression in both sexes. In this cohort, the majority of women were postmenopausal (214/344 [62.6%]) and in the moderate SCORE risk group (191/344 [55.5%]). Thus, differences in sex might not be interpretable in terms of the effects of estrogen alone. Modern epidemiological data [30] show that young women are relatively well-protected from cardiovascular disease, but women catch up to men at the age of 60-79 years and ultimately surpass men by the age of 80 years, suggesting an interaction between sex and age. Of note, the distinct SCORE algorithms for men and women suggest underlying biological variation between sexes [4] and may highlight the need to include sex as an important component of individualized thresholds for prospective ufPWV assessment.
As a well-established marker of atherogenesis risk assessment, conventional cIMT is a composite measure of both intimal and medial layers in ultrasound screening. cIMT therefore represents a combination of atherosclerotic changes within the intimal layer and microstructural remodeling within the medial layer [31]. However, a lack of standardization in the definition and measurement of cIMT, its high variability, and its low intra-individual reproducibility have raised concerns. Large-scale meta-analyses [10,32] have failed to demonstrate any added value of cIMT in predicting cardiovascular disease and events. Additionally, detectable morphological alterations within atherosclerotic arterial walls usually lag behind biomechanical changes, such as augmented stiffness, especially in the subclinical phase with a normal cIMT and no plaques [8,12,33]. Consistent with this, the authors’ prior studies have shown that individuals with non-elevated cIMT [17] or with no major CVRFs [21] still had carotid stiffening, as quantified by ufPWV. In the present analysis, PWV-ES was correlated more strongly than cIMT with SCORE categories, age, and major CVRFs. However, recent advances in ultra-high-frequency ultrasound modalities now permit the individual layers of the arterial wall to be studied in more detail [34,35], which may change the present status of cIMT. However, this needs to be further validated.
This study has several limitations that should be noted. First, one potential limitation is the limited age range of patients in which SCORE can be utilized. This limitation required us to assess arterial stiffening in a middle-aged population rather than in the general population. Research using ufPWV in younger participants has shown a reduction in carotid stiffness in individuals with optimally controlled CVRFs compared with ordinarily controlled CVRFs [21], suggesting that the superiority of ufPWV to cIMT might be underestimated in mid-life, restricting suitable candidates for ufPWV assessment. Second, although the possibility exists that different SCORE categories might not respond to risk factors in the same way, the predictive role of increased ufPWV with adjustment of major CVRFs was still validated in low-risk and high-risk groups in this study. Third, different ratios of SCORE categories might have led to cohort dependency, thereby affecting the validity of these results as extrapolated to the general population. Fourth, atherosclerosis is a life-long disease in which numerous factors play various roles. Some factors that may affect the cIMT and carotid stiffening were not considered in this study, such as lifestyle, alcohol consumption, medication, hyperthyroidism or hypothyroidism, other endocrine-related diseases, genetic diseases, gynecological diseases, and anatomical variance in vascularity. Finally, ufPWV measurements were acquired from a single cohort using a single type of probe (SL10-2); thus, the cross-cohort and cross-probe generalizability of carotid stiffening remain to be tested.
In conclusion, the results of this study suggest that in vivo imaging of ufPWV is linked to SCORE categories, and that elevated PWV-ES may help to stratify differing levels of cardiovascular risk.

 Download Citation
 PDF Links
 PubReader
 ePub Link
 Full text via DOI
 Full text via PMC


