

 Print
Print facebook
 twitter
 Linkedin
 google+

Introduction
Hypervascularity, which is the radiologic hallmark for the diagnosis of hepatocellular carcinoma (HCC), is demonstrated on contrast-enhanced examinations [1-5]. However, the iodinated contrast media used in computed tomography (CT) have the disadvantage of renal toxicity [6], and the gadolinium-based contrast media used in magnetic resonance imaging (MRI) have the risk of nephrogenic systemic fibrosis and accumulation in the brain [7,8]. Contrarily, the microbubble contrast agent used in contrast-enhanced ultrasound (CEUS) is relatively safe [9] and is considered to better represent tumoral vascularity than contrast-enhanced CT or MRI, which is attributed to its intravascular distribution and the real-time imaging capability of CEUS [10-12]. However, CEUS requires an intravenous injection of contrast media, making it time-consuming and expensive. In this regard, color Doppler imaging (CDI) and power Doppler imaging (PDI) in ultrasound examinations, which are used to detect the presence of flow within a lesion, might be suitable alternatives to evaluate the vascularity of HCCs [13,14]. However, the detection of tumoral vascularity with CDI and PDI may be limited because the wall filters used in CDI and PDI to remove clutter artifacts (due to involuntary or voluntary patient motion) may also remove the signals of small vessels and slow flow owing to overlap between their Doppler frequency shifts.
MicroFlow Imaging (MFI) is a recently developed ultrasound technique that aims to visualize small vessels and slow blood flow signals without using contrast agents. In MFI, a novel clutter suppression algorithm is applied to separate slow flow signals from tissue motion artifacts. Therefore, MFI could potentially detect slow flow and small vessels in HCC. In the literature, only one study has investigated the use of MFI in focal hepatic lesions [15]. However, that study did not present the diagnostic capability of MFI in HCC, and did not assess possible factors, such as tumor size, that could affect the diagnostic performance of MFI in the detection of tumoral vascularity.
Therefore, in this study, we compared the diagnostic performance of MFI with that of CDI and PDI in the detection of blood flow signals in HCCs by using CEUS as the reference standard.
Materials and Methods
This prospective study was approved by the institutional review board (IRB) of our hospital. Informed consent was obtained from all patients.
Patients
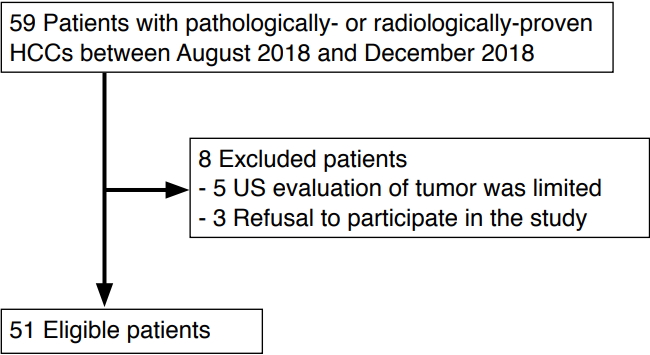
Between August 2018 and December 2018, patients with HCC treated at a tertiary referral center were consecutively enrolled in this study. Patients were included in the study if they were ≥20 years old, had underlying liver cirrhosis, and had definite HCC on CT/MRI or viable HCC on follow-up CT/MRI performed after treatment for HCC [5]. Patients were excluded if they refused to participate or if the ultrasound evaluation of the tumor was limited because of poor tumor visibility due to deep location or a marked motion artifact (Fig. 1).
Ultrasound Examination
A radiologist (J.S.B., with 7 years’ experience in abdominal ultrasound examinations) performed all CDI, PDI, and MFI examinations using an ultrasound scanner (EPIQ 7, Philips Healthcare, Eindhoven, Netherlands) with a 1-5 MHz convex probe. Initially, the known HCC was located using B-mode ultrasound and referring to the previously acquired contrast-enhanced CT or MRI images. After locating the HCC, the best sonic window was obtained, and the tumor size and depth were measured. Subsequently, the patient was asked to hold his/her breath, and the color Doppler mode was turned on. Color gain, scale, and wall filter were adjusted for each tumor to acquire the best images. The sampling window was placed to include the tumor and surrounding liver parenchyma. A cine loop of approximately 15-20 seconds was stored while slowly sweeping the HCC in the craniocaudal direction without applying pressure. Additionally, at least five still images of the HCC were captured where the vascularity on CDI was best demonstrated. Next, the ultrasound mode was sequentially converted to power Doppler mode, and then to MFI mode. A cine loop and at least five still images were obtained from each mode. The same sonic window was used when performing all the above ultrasound examinations.
Image Analysis
Two radiologists (both with 6 years’ experience in abdominal ultrasound examinations) who did not perform the ultrasound examinations independently reviewed the CDI, PDI, and MFI image sets on a picture archiving and communication system (Infinitt PACS, Infinitt Healthcare, Seoul, Korea). The reviewers were informed that the images had been obtained from patients with HCC but were blinded to other clinical information. The order of reviewing the three image sets was at the reviewers’ discretion; however, the review of each image set (CDI, PDI, or MFI) was performed with at least a 2-week interval to reduce recall bias. The reviewers assessed both cine loops and still images and graded the presence and pattern of vascularity. The presence of vascularity was graded on a 5-point scale: 0, absent; 1, a few spotty signals in the tumor; 2, signals in <25% of the tumor; 3, signals in 25%-50% of the tumor; and 4, signals in >50% of the tumor [16]. A score of 3 or higher was considered as positive for the presence of vascularity. The pattern of vascularity was chosen from the following categories: basket pattern, vessels in tumor, spot pattern, detouring pattern, a combination of the above, or others [17]. After an independent review, a consensus between the two reviewers was reached. Any discrepancies were resolved by discussion with a senior radiologist (with 27 years’ experience in abdominal ultrasound examinations).
Reference Standard
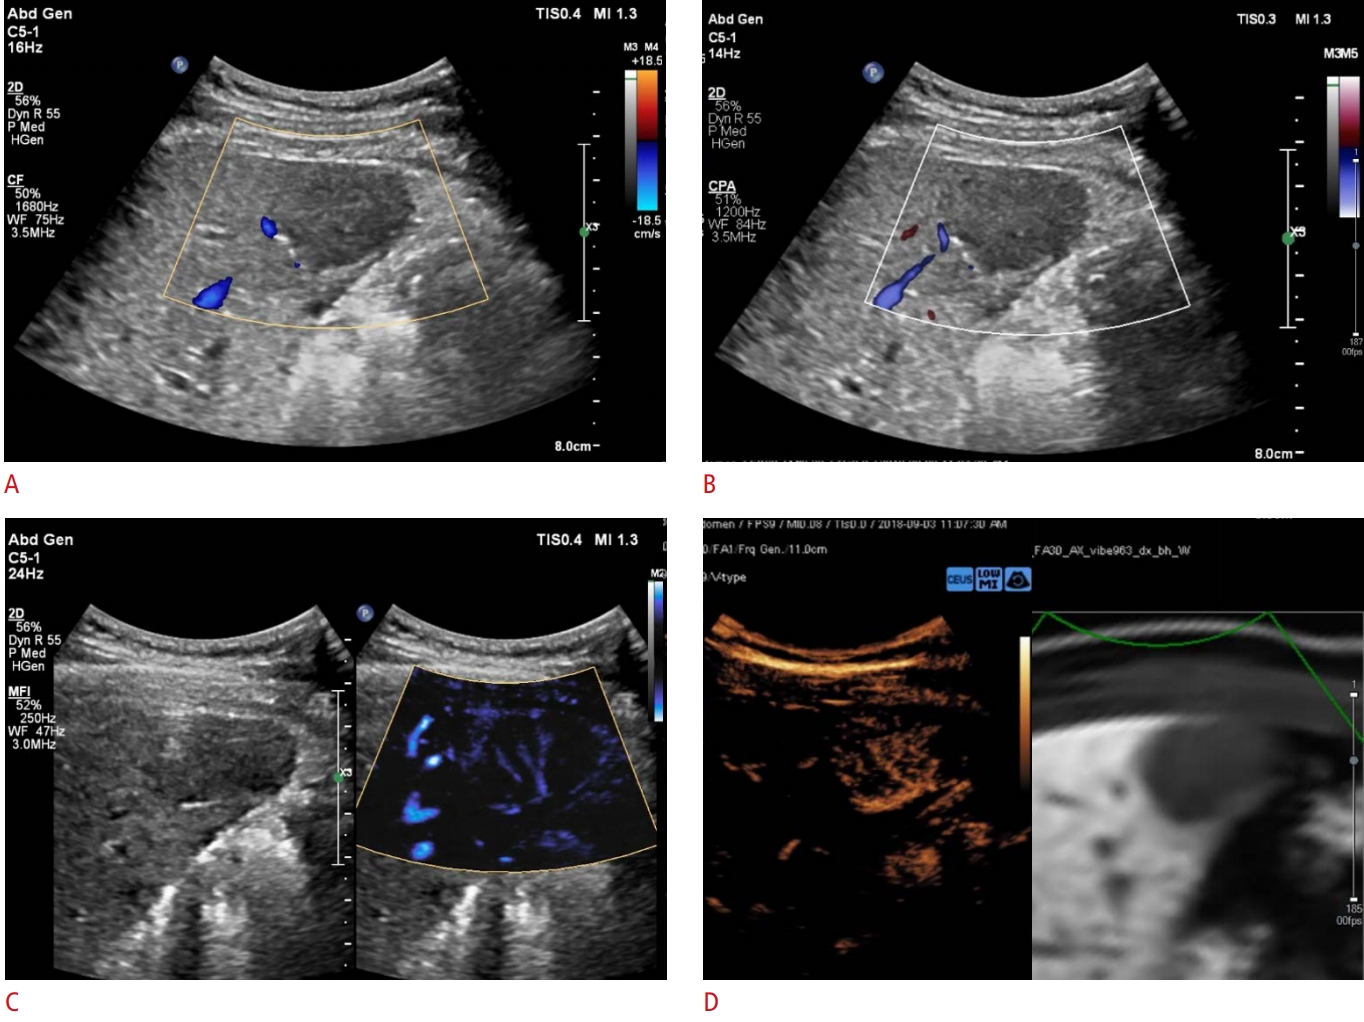
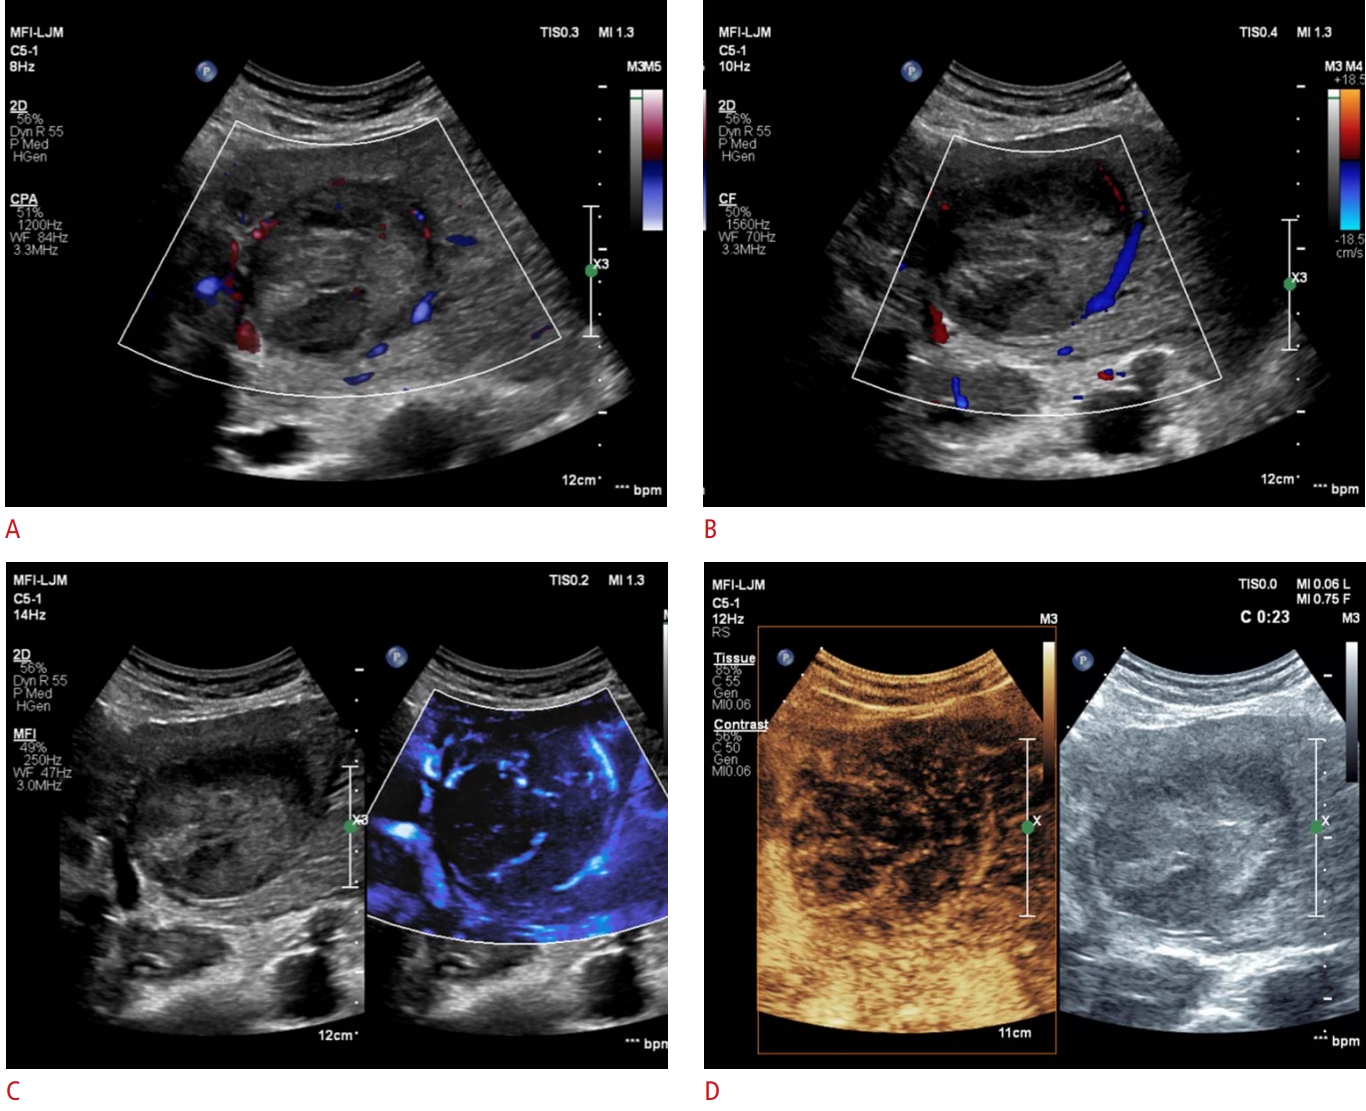
Arterial-phase images of CEUS examinations were used as the reference standard for the vascularity of the HCCs because CEUS has the highest spatial and temporal resolution for the depiction of tumoral vascularity. One of the two radiologists (J.M.L. or J.S.B.) performed the CEUS examination immediately after completing the precontrast ultrasound examinations. For the CEUS examination, a single 2.4-mL bolus of prepared sulfur hexafluoride-filled microbubbles (SonoVue, Bracco, Milan, Italy) was manually injected into the antecubital vein, followed by a 10-mL 0.9% saline flush. The following parameters were used during the CEUS examinations: mechanical index, 0.08; dynamic range, 65 dB; 10-13 frames per second; signal persistence turned on; power modulated pulse inversion technology; echo-signal gain below noise visibility; and a single focus at the HCC. After injection of the contrast media, a cine loop of the target tumor was recorded for the first 60 seconds, which was followed by intermittent scans to minimize the disruption of microbubbles for up to 5 minutes. The CEUS imaging plane was carefully selected to be the same as those used for the CDI, PDI, and MFI examinations. After performing the CEUS examinations, the two radiologists independently reviewed the cine loop of the arterialphase images of CEUS examinations in all 51 patients and graded the presence and pattern of tumoral vascularity, which served as the reference standard for each tumor. Similar to the assessment of the precontrast ultrasound images, the presence of vascularity on CEUS was graded on a 5-point scale: 0, no signal in the tumor; 1, a few spotty signals in the tumor; 2, signals in <25% of the tumor; 3, signals in 25%-50% of the tumor; and 4, signals in >50% of the tumor [16]. A score of 3 or higher was considered as positive for the presence of vascularity. The pattern of vascularity was assessed as follows: basket pattern, vessels in the tumor, spot pattern, detouring pattern, a combination of above, or others (Figs. 2, 3) [17]. After independent review, the two radiologists discussed their findings and reached a consensus.
Statistical Analysis
Data were represented as mean±standard deviation (SD), or as absolute numbers (%), as appropriate. The detection and characterization of tumoral vascularity were compared between CDI and MFI, and between PDI and MFI by using the Wilcoxon signed-rank test. The McNemar test was used to compare the sensitivity and specificity of CDI and MFI, and PDI and MFI in the detection and characterization of tumoral vascularity. Both the presence and pattern of vascularity were considered. The results of CDI, PDI, and MFI were regarded as positive only if the pattern of tumoral vascularity on each examination matched that of the CEUS examination. Spearman correlation coefficients (ρ) were calculated to assess the correlation between the vascular patterns observed on MFI and CEUS. Univariate logistic regression analyses were performed to identify factors associated with the detection of tumoral flow on MFI. Variables showing P<0.1 in the univariate analyses were included in a multivariate logistic regression analysis to reveal the factors independently associated with tumoral vascularity detection. Receiver operating characteristic (ROC) curve analysis was performed to obtain cutoff values for the application of MFI to assess tumoral vascularity. Lastly, interobserver agreement was assessed by using the intraclass correlation coefficient (ICC). We used the following convention to interpret the results of ICC: <0.20, poor; 0.21-0.40, fair; 0.41-0.60, moderate; 0.61-0.80, substantial; and 0.81-1.00, near-perfect [18]. P-values of <0.05 were considered to indicate statistical significance. Commercially available software products were used for statistical analysis (MedCalc version 18.6, MedCalc Software, Ostend, Belgium; IBM SPSS Statistics for Windows version 22.0, IBM Corp., Armonk, NY, USA).
Results
Study Population and Tumor Characteristics
Of the 59 total patients, eight patients were excluded; of these, five refused to participate in the study and three were excluded because of poor ultrasound visibility. In total, 51 patients with either pathologically confirmed HCC (n=8) or radiologically proven HCC (n=43) were enrolled. The characteristics of the patients and tumors are summarized in Table 1. On CEUS examinations, tumoral vascularity was demonstrated in 98% (50 of 51) of the patients. The patterns of vascularity on CEUS were as follows: basket pattern (n=26), vessels in tumor (n=6), a combination of the above (n=3), or others (n=15). No adverse events were associated with the CEUS examinations.
Diagnostic Performance of CDI, PDI, and MFI in the Depiction of Tumoral Vascularity
The vascularity score was significantly higher with MFI than CDI or PDI (P<0.001 for both). MFI also demonstrated a significantly higher sensitivity (58.0%, 29 of 50) than CDI (14.0%, 7 of 50) or PDI (14.0%, 7 of 50) (P<0.001 for both) (Fig. 3). The correlations between the vascular patterns depicted on MFI and CEUS are presented in Table 2 (ρ=1.000, P<0.001). Interobserver agreement for the detection and characterization of tumoral vascularity was higher in MFI (0.725) than in CDI (-0.268) or PDI (0.360) (Table 3).
Factors Associated with Tumoral Flow Detection
On univariate logistic regression analysis, tumor depth (odds ratio [OR], 0.360 per centimeter; P=0.001) and whether the tumor had recurred or not (OR, 0.277; P=0.033) demonstrated statistical significance (Table 4). Regarding tumor depth, MFI demonstrated a sensitivity of 94.4% (17 of 18) and 87.5% (28 of 32) for the detection of tumoral vascularity in tumors with a depth ≤3 cm and ≤4 cm, respectively. In terms of recurrence, MFI detected 82.1% (23 of 28) of treatment-naive HCCs, but only 68.2% (15 of 22) of recurrent HCCs. The Youden index obtained from the ROC analysis revealed that tumor depth ≤3.7 cm yielded the largest area under the ROC curve (0.737), with a sensitivity and specificity of 73.7% and 66.7%, respectively. In terms of tumor size, ROC analysis demonstrated that a diameter >2.5 cm yielded the largest area under the ROC curve (0.836), with a sensitivity and specificity of 60.5% and 100.0%, respectively. When we performed univariate logistic regression analysis using the dichotomization for tumor depth and size obtained by applying the cutoff values from the ROC analysis, tumor depth also demonstrated a significant association with MFI performance (OR, 0.580; P=0.012), but tumor size did not (OR, 21.7; P=0.998). In the multivariate analysis, underlying liver disease and tumor size (P=0.081 and P=0.095, respectively) were also included. Multivariate logistic regression analysis revealed that tumor depth was the only factor significantly associated with detectability on MFI (OR, 0.353 per centimeter; P=0.005) (Table 4).
Discussion
In our study, MFI demonstrated a significantly higher sensitivity (58.0%) for the detection and characterization of vascularity of hypervascular HCCs than CDI (14%) or PDI (14%). This result may be attributed to the capability of MFI to selectively detect low-frequency Doppler shift signals. Although CDI and PDI have been widely used for the evaluation of tumoral vascularity, they have limited sensitivity for detecting signals of small vessels or slow flow because the wall filters used in CDI or PDI filter out areas of slow blood flow and movements around the vessels [15,19]. In contrary, the clutter suppression algorithm used in MFI allows the detection of slow flow signals in tumors and the differentiation between slow blood flow and tissue motion [15,20]. Moreover, MFI had substantial interobserver agreement, which was also higher than that of CDI or PDI. Considering the noninvasive nature of MFI, and its similar ease of use to CDI/PDI, we believe that the greater sensitivity of MFI than CDI/PDI could be valuable for evaluating patients with liver cirrhosis and cirrhotic nodules.
To date, only a few studies have used MFI or another similar technique, superb microvascular imaging (Canon Medical Systems, Otawara, Japan), to evaluate hepatic tumors [15,20-22]. In those studies, however, either the presence of vascularity or the pattern of vascularity was considered, but not both. However, we believe that both the presence and the pattern of vascularity should be investigated together to evaluate the capability of a US technique to detect tumoral vascularity [13,17]. In this regard, our study provided a more comprehensive assessment of the diagnostic performance of MFI in the evaluation of vascularity of HCCs.
Our results for MFI are similar to those of a previous study, which reported a sensitivity of 57%, but are inferior to those of another study that showed a sensitivity of 100% for the detection of vascularity of HCCs using superb microvascular imaging [20,22]. However, those studies included small numbers of patients with HCC (7 and 5, respectively), and we included only patients who showed hypervascularity on either CT or MRI. Therefore, further studies that include HCCs diagnosed by either pathology or angiography may provide a more comprehensive assessment of the diagnostic performance of MFI for the evaluation of the vascularity of HCCs. Meanwhile, the sensitivity of CDI and PDI for the detection of vascularity in HCCs in our study was lower than those of previous studies, which reported sensitivity values of 59.5%-76% and 66.7%-92% for CDI and PDI, respectively [13,14,23-25]. In addition to the consideration of the vascular pattern of HCCs, this discrepancy may have resulted from the application of different thresholds: for example, flow signals in ≥25% of a tumor were required for a positive diagnosis in our study, whereas any degree of vascularity was considered as positive in most previous studies.
Tumor depth was demonstrated to be the only factor that significantly affected the diagnostic performance of MFI. The sensitivity of MFI for revealing tumoral vascularity in tumors ≤3 cm and ≤4 cm in depth was 94.4% and 87.5%, respectively. ROC analysis also demonstrated that the diagnostic performance of MFI was highest for tumors ≤3.7 cm in depth. Thus, MFI may be utilized before performing contrast-enhanced examinations for the detection of hypervascularity of HCC in the cirrhotic liver, thereby potentially reducing the need for the use of contrast media, especially for tumors ≤4 cm in depth. Our result is in accordance with that of a previous study, which reported that tumor depth affected the detection of flow signals in PDI [19,26]. A deep tumor location leads to greater attenuation of the ultrasound beam, which may hinder the detection of tumoral vascularity, and this effect is more pronounced in cirrhotic livers than in normal livers [27]. Meanwhile, the ultrasound evaluation of tumors located in the left lateral segment of the liver may be limited because of motion artifacts caused by cardiac pulsation [26]. In our study, however, tumor location was not significantly associated with the detection of tumoral vascularity on MFI in the multivariate analysis. Considering that MFI is a modification of PDI, our results appear to contradict previous findings. A possible explanation for our results is that we excluded tumors with poor ultrasound visibility, a category that included tumors showing severe motion artifacts on ultrasonography due to cardiac pulsations.
Our study has a few limitations that should be considered. First, selection bias could have been present because we enrolled only patients with HCCs that showed hypervascularity on CT or MRI. This inclusion criterion may also have led to the small proportion of hypovascular HCCs in our study (2%, 1 of 51), thereby impeding us from evaluating the specificity of MFI. Second, exclusion of tumors with poor ultrasound visibility may have resulted in an overestimation of the diagnostic performance of MFI. Third, the results of our study were obtained using an ultrasound machine from a specific vendor and may not be generalizable to other ultrasound machines from different vendors. In addition, bias could have been present in the process of obtaining CDI, PDI, and MFI images because the image quality may have improved during repeated scans of the tumors. It should also be mentioned that the reviewers may have been biased by the type of ultrasound techniques, which was observable at a glance.
In conclusion, MFI showed superior sensitivity in the detection of vascularity in hypervascular HCCs compared with CDI or PDI when the vascular pattern was considered. MFI also demonstrated a higher interobserver agreement compared with CDI or PDI. MFI showed satisfactory sensitivity for the detection of vascularity in tumors ≤4 cm in depth.
 Download Citation
 PDF Links
 PubReader
 ePub Link
 Full text via DOI
 Full text via PMC


