

 Print
Print facebook
 twitter
 Linkedin
 google+

Introduction
Cardiovascular atherosclerosis is a major cause of mortality and acute disabilities. Atherosclerotic plaques of the carotid artery are the main contributor to cerebrovascular thromboembolic events including transient ischemic attacks and stroke. More than 60% of cerebrovascular events are due to vulnerable plaque rupture [1]. Therefore, identifying plaques prone to rupture is of crucial importance in determining priorities for interventional treatment. Current techniques are based on morphological parameters of the plaque, such as stenosis percentage [2,3], and more reliable techniques of risk assessment are thus required [4]. Biomechanically, plaque rupture occurs when the mechanical stresses exerted on a plaque exceed its tolerance [5]. For this reason, understanding the stress changes of plaques and their progression is essential. In vivo estimation of stress distribution in a plaque is not possible, but numerical modeling can provide alternative methods to obtain the stress field details of the artery wall.
Computational modeling can also assist in clinical evaluations by providing additional information about stress/strain distribution and shear stress. The reliability of a model depends on the structural formulations used to describe the artery wall and plaque behavior, as well as on the accuracy and adaptation of the reconstructed geometry to the in vivo geometry of the artery [6].
Studies have reported that artery wall properties affect the stress/strain distribution of the artery wall and plaque, as well as their biomechanical behavior [7,8]. The three models of Maxwell, Voigt, and Kelvin are recommended for describing the viscoelastic behavior of materials. The Kelvin model is the most commonly used, and involves loading, deformation, and their first differentiation [9]. Valdez-Jasso et al. [10] compared three viscoelastic models, including the Kelvin, tangent, and sigmoid models, in the descending aorta and carotid arteries. They reported that the Kelvin model better described the pressure-diameter dynamics of the carotid artery in ex vivo conditions [11].
Recent advances in three-dimensional (3D) imaging of the vasculature have provided accurate anatomical images. Ultrasonography (US) has been considered as an appropriate modality for successive evaluation of arteries, since it is non-invasive and relatively cheap, and provides geometrical and anatomical information about the artery wall, as well as hemodynamic information about blood flow [12]. Moreover, US can provide morphological information about the plaque components, which may have a crucial influence on the diagnosis and clinical decisions [13].
In the present study, subject-specific viscoelastic finite element models of healthy and atherosclerotic stenosed carotid arteries were reconstructed solely from US images. For each subject, the geometric and material properties of the plaque were extracted from consecutive transverse US images, and the pulse pressure and parameters of the modified Kelvin viscoelastic model were extracted from consecutive longitudinal images. The accuracy of the reconstructed models was evaluated by comparing the radial displacement waveforms of the subject-specific artery model with those that resulted from ultrasound image processing. Finally, stress changes in the proximal shoulder, throat, and distal shoulder of the plaques were compared in subjects with less and more than 50% stenosis in the carotid artery.
Materials and Methods
US Data Acquisition
The present study included three groups of subjects: five healthy male volunteers (36±4 years) without any history of cardiovascular disease, hypertension, smoking, or diabetes; five male patients (68±11 years) with mild (<50%) atherosclerotic plaques in their carotid arteries; and four male patients (62±15 years) with severe (≥50%) atherosclerotic plaques in their carotid arteries. The subjects were selected from patients who underwent carotid angiography for diagnosis or angioplasty at Imam Khomeini Hospital, Tehran, Iran. Informed consent was obtained from all subjects for the examination and the ethical committee of Tarbiat Modares University approved the protocol of the study (IR. TMU. REC. 52724).
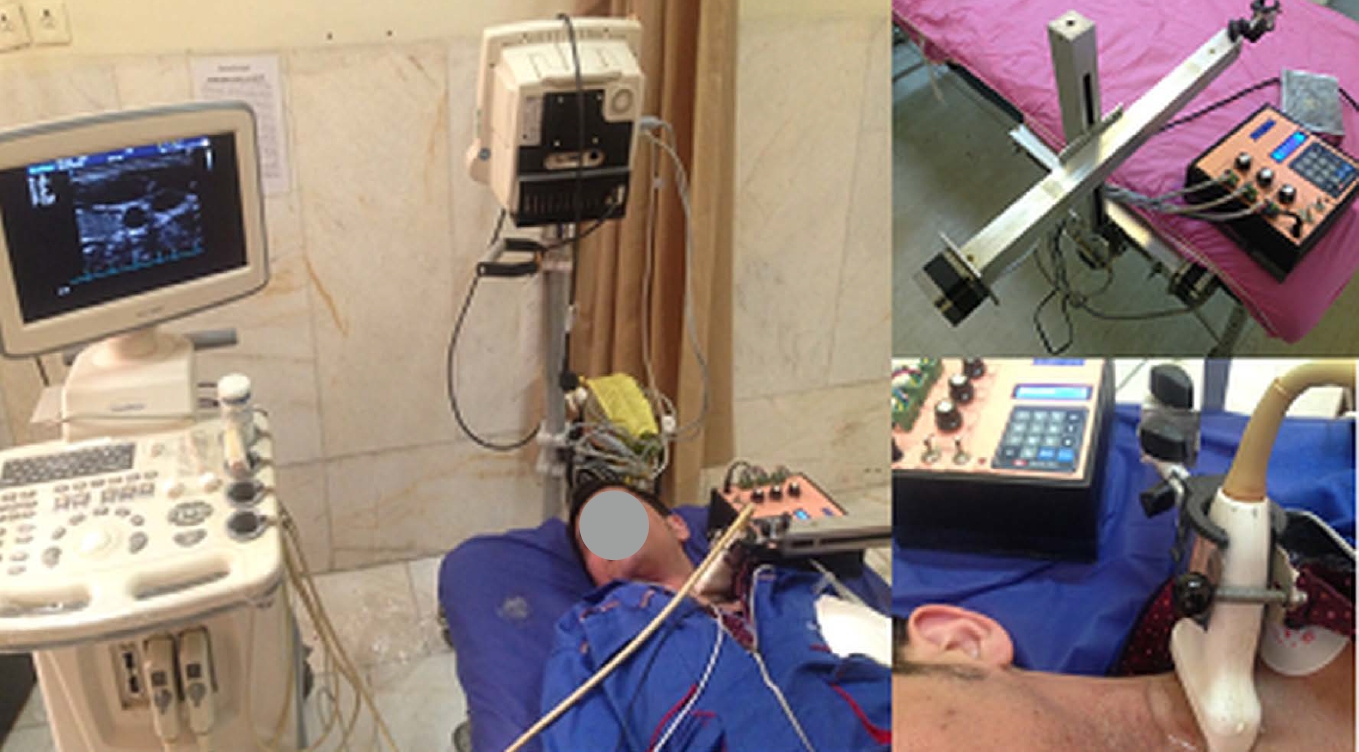
The US examinations were carried out with a Sonoscape SSI 6000 (Milestone, Shenzhen, China) US system equipped with electrocardiography (ECG) and an 8-16 MHz linear transducer. In the present study, a motorized propelling probe and its holder were designed for recording sequential transverse images. A stepper motor with three degrees of freedom (x, y, and z) was made to hold and move the US probe in each of the x, y, and z directions (each within 30 cm and with a micrometer accuracy). The anatomy and position of the carotid artery allow a uniform linear sweep by the upper arm for the US probe. To create linear motion in each of the x, y, and z directions, an arm including a stepper motor, a 30-cm-long screw, a square-section aluminum rail, and a driving piece (nut) was used. According to the pitch step (1.2 mm), the minimum amount of displacement in each direction was ideally equal to 0.5 mm. Three similar arms with the above mechanism were connected perpendicular to each other so that the fixed part of the first arm was installed next to the examination bed and parallel to the bed surface. The probe moved in an x-direction parallel to the patient's body. The movable part of this arm was connected to the fixed part of the second arm (perpendicular to the bed), which moved the probe in the z-direction. Finally, the third arm, which was connected to the moving part of the second arm, was responsible for movement in the y-direction. This instrument was made by Tarbiat Modares University, Ultrasonic Laboratory and Sharif University of Technology Electronic Research Institute (Patent No. 91516 in the Intellectual Property Registration Organization, Tehran, Iran). The US imaging probe was mounted on the holder. It propelled the probe along the patient’s neck at 0.5-mm intervals (Fig. 1).
The left carotid arteries of all subjects were evaluated. In stenosed carotid arteries, consecutive transverse images were recorded from a few millimeters proximal up to a few millimeters distal to the plaque (15 MHz frequency, 3.0-4.4 cm depth, 1.5-2.2 cm focal length, 50 dB gain, 65-86 frames/s). After recording each image, the transducer was propelled 0.5 mm by the probe holder motor and the next image was recorded. In healthy carotid arteries, consecutive transverse images were recorded from about 3 cm proximal to the carotid bifurcation and continued for more than 60 image recordings. All recordings were gated at the end-diastole using ECG (Fig. 1). All images were recorded in BMP format and 525×702 pixels. In addition, the carotid artery of the subjects was scanned longitudinally during three cardiac cycles in AVI format at 86 frames/s. All recordings were transferred to a PC for post-processing.
3D Geometry Reconstruction
Simultaneous transverse images of end-diastole were standardized using grayscale rescaling. The gray-scale levels of the lumen and adventitia were set to be 0 and 190, respectively. Standard images were segmented semi-automatically using Stradwin segmentation software (Machine Intelligence Laboratory, University of Cambridge, UK). In this software, the contours of the lumen, media-adventitia interface, and plaque components were drawn. Plaque component contour drawings were based on pixel distribution analysis and threshold levels were selected according to Elatrozy et al. [14]. The 3D geometry of the artery wall and plaque components was reconstructed from point clouds in CATIA (CATIA V5, Dassault Systèmes, Vélizy-Villacoublay, France).
Finite Element Model Description
Finite element modeling was carried out in ADINA 8.9 (v8.9, ADINA R&D Inc., Watertown, MA, USA). In the present study, the blood pressure of each subject was extracted by exponentially calibrating the internal diameter of his carotid artery. Details have been provided elsewhere [15]. The pulse pressure of each subject was loaded onto the internal wall of his artery model. The artery wall was modeled as a viscoelastic material (modified Kelvin model), and patient-specific parameters of the Kelvin viscoelastic model were estimated using an optimization technique in MATLAB. Input variables of the viscoelastic model, including the internal diameter, intima-media thickness, and pressure waveforms, were extracted by processing consecutive longitudinal US images. Arterial diameter, intima-media thickness, blood pressure, and blood pressure differentiation waveforms, and the initial values of the parameters were replaced in the Kelvin equation [16]. The optimization process was carried out. The initial values of the relaxation time for fixed stress (0.05 seconds), relaxation time for a fixed strain (0.025 seconds), and elastic modulus (1,900 mmHg) were obtained from the literature [17,18]. Details of the modified Kelvin model are provided by Soleimani et al. [16]. In addition to pulse pressure applied to the internal wall of the model, the effect of the perivascular tissue was applied as an effective pressure waveform [19] to the external wall of each model. Both ends of the artery models were a constraint to fix [20].
Models were meshed by triangular elements. They were solved for three cardiac cycles. Mesh independence was evaluated by gradually increasing the mesh density, and the radial displacement waveforms of elements with the same special position in models of different mesh densities were extracted. The results were statistically compared using a two-sample Kolmogorov-Smirnov analysis. If the differences between the two waveforms were non-significant (less than 0.05), the final mesh was accepted. The degrees of freedom of movement were also limited along two x- and y-axes. The effect of blood on the wall was applied as a pulse pressure waveform on the internal wall of the carotid artery models of each sample. The effect of the surrounding artery tissue was also applied to the outer wall of the model in accordance with Liu et al. [19]. The parameters of the modified Kelvin viscoelastic model were also extracted for the artery wall of each sample with the optimization method and entered into the finite element model. The finite element equations governing the existing solid-state model were solved by a sparse method and automatic timing with an initial time step of 0.01 seconds and a maximum of 10 sub-step times. The model was truncated by 3D solid elements (four nodes). The model was executed for three cardiac cycles, equivalent to 3 seconds.
Model Validation and Analysis
In order to validate the models and evaluate their ability to simulate the physiological cyclic behavior of the artery, radial displacement profiles that resulted from consecutive longitudinal US images were extracted. They were statistically compared to results from finite element models in nearly the same special position with Pearson correlation analysis and linear regression analysis. The Pearson correlation coefficient (R) was estimated, with a P-value less than 0.05 considered to indicate statistical significance. Moreover, the percentage of mean relative differences of two displacement profiles (obtained from the finite element model and image processing) of each subject was obtained and the average values of each group were reported. To eliminate systematic error, the calipers of the US device were calibrated with a US quality assurance phantom (Sono403 SC, Gammex, Singapore). The motion estimation software was also calibrated manually, the details of which have been described elsewhere [15]. In addition, each measurement was repeated five times and the mean was reported. The maximum reproducibility error was less than 5%.
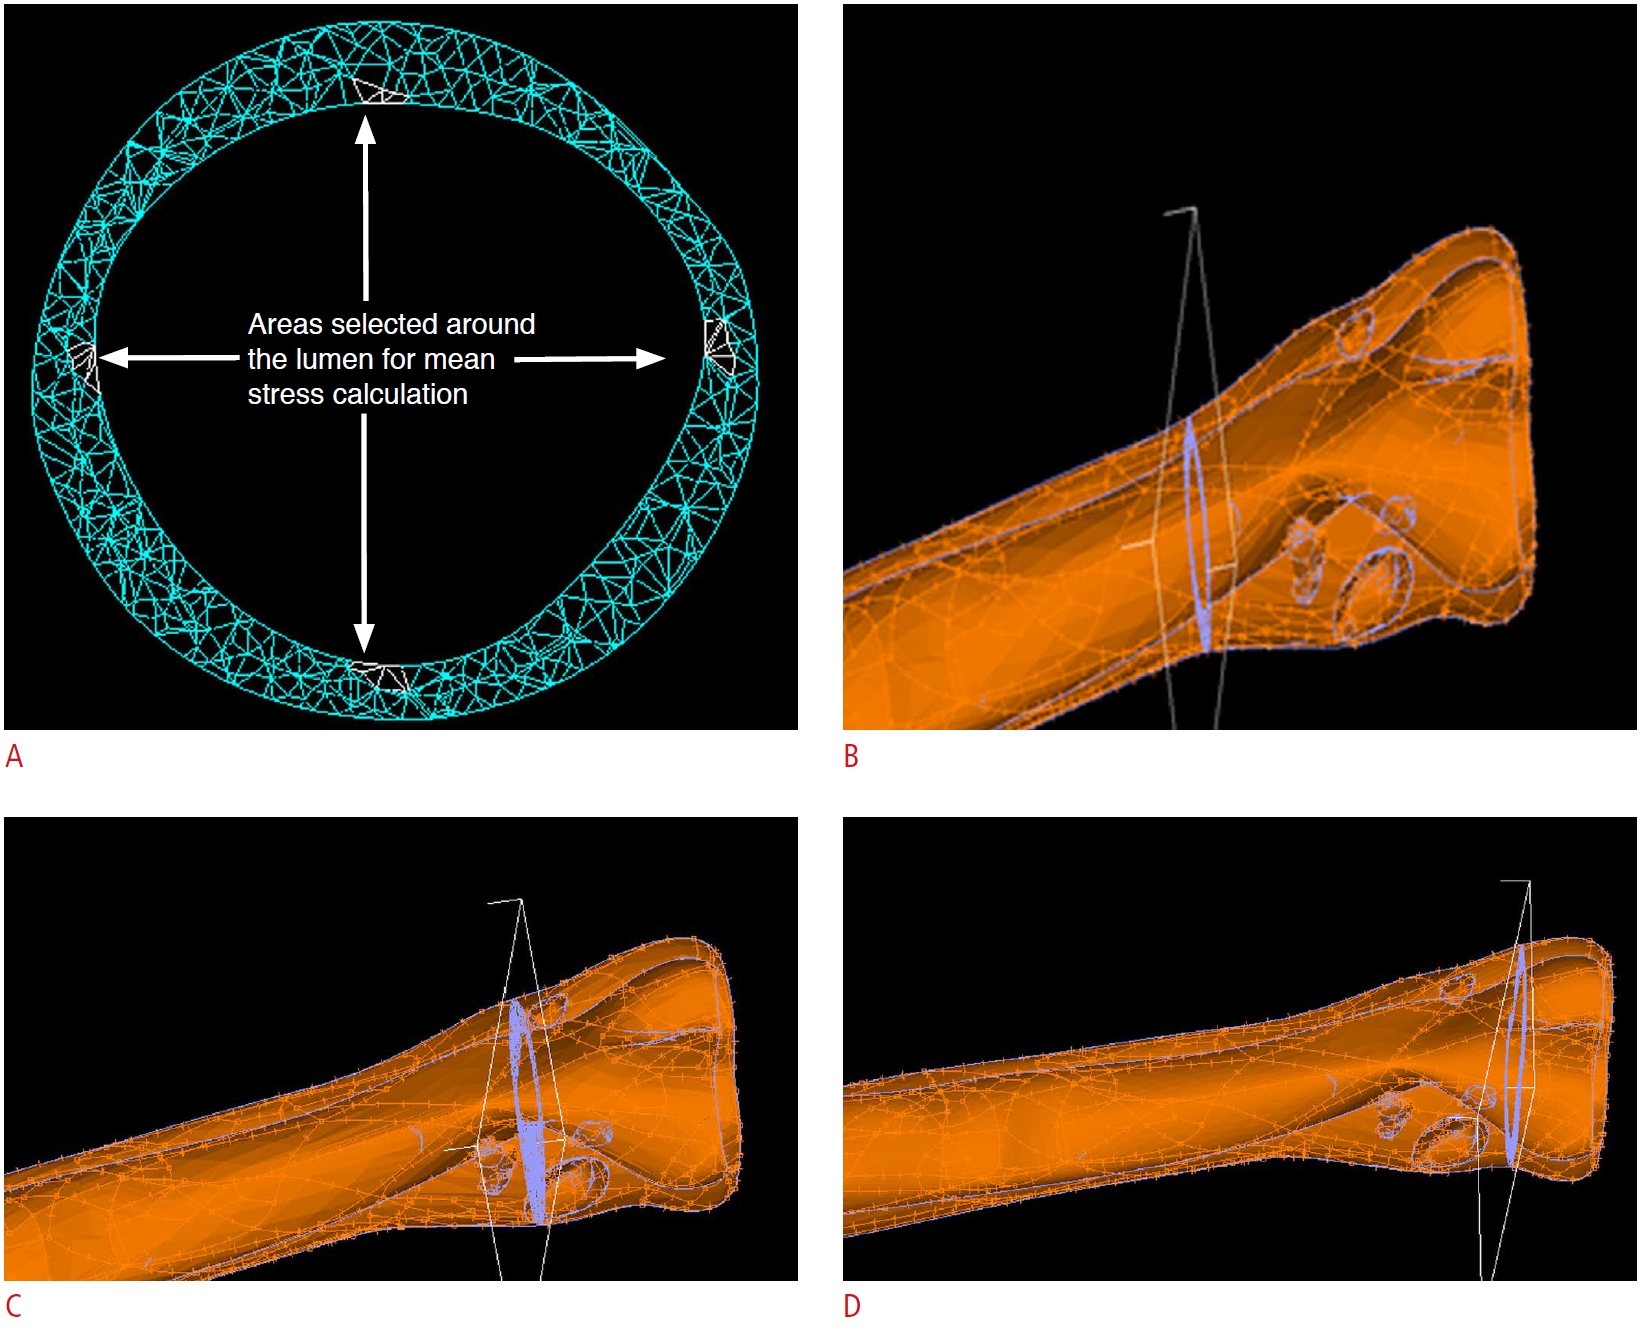
Stress analysis was conducted as follows. In healthy carotid models, four transverse sections with 5-mm intervals were selected. In each section, the mean value of the stresses of four small areas around the lumen (nearly at angles of 0°, 90°, 180°, and 270°) was calculated. The average value of all sections was reported as the mean stress value of that artery model. Fig. 2A shows a transverse section of a healthy carotid model in which the areas chosen for mean stress calculations are shown by arrows. In stenosed arteries, the transverse sections passing through the plaque throat of each model were selected (narrowest diameter). The transverse sections passing through proximal and distal shoulders were then determined.
In Fig. 2B-D, three transverse sections passing through the proximal shoulder, throat, and distal shoulder are shown for a stenosed artery model. The mean values of stress magnitude for each anatomical location (i.e., proximal shoulder, throat, and distal shoulder) were reported in each group.
The results are presented as mean±standard deviation (SD). One-way analysis of variance was used to analyze differences between groups, at a significance level of 0.05 (P<0.05). The results of the groups with less and more than 50% stenosis were statistically compared using the t test (P<0.05). Furthermore, in each model, transverse cross-sections with 0.5-mm intervals were selected, from which the three sections with the highest effective stress and the three sections with the lowest effective stress were chosen. Then, the location of the extremum values of effective stresses was assessed in terms of association with wall thickness and/or plaque components. All data in this study were analyzed using SPSS version 20 (IBM Corp., Armonk, NY, USA).
Results
The clinical information of the study participants is provided in Table 1. No significant difference was found among the three groups in systolic blood pressure, diastolic blood pressure, heart rate, or body mass index (P>0.05).
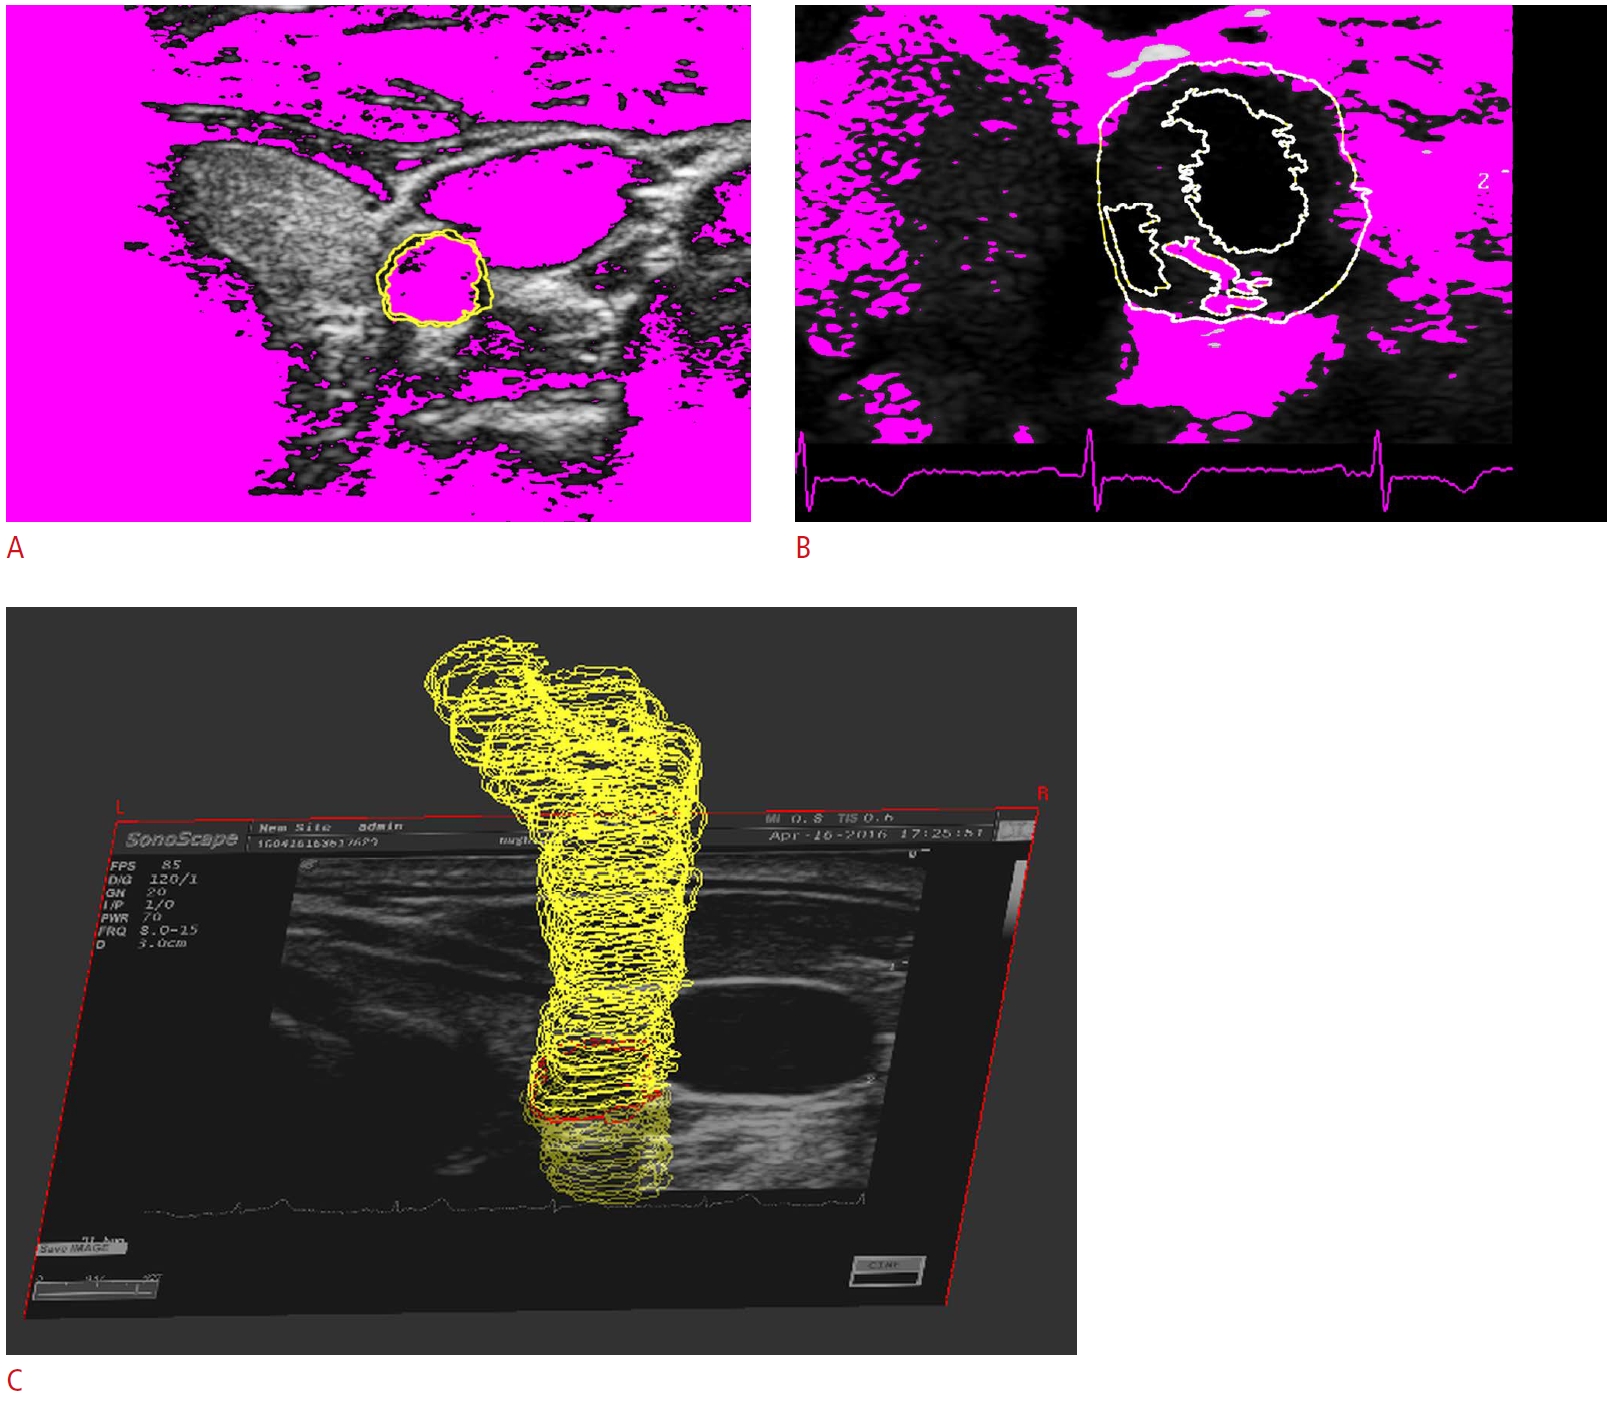
The contour set that resulted from consecutive transverse US images was extracted from the artery lumen, media-adventitia interface, artery wall borders, and plaque components of a US transverse image (Fig. 3). Fig. 3 shows the contours of the artery lumen and media-adventitia interface in a transverse US image of a healthy carotid artery (Fig. 3A), the artery wall borders and plaque components of a US transverse image of a stenosed carotid artery (Fig. 3B), and the contour set that resulted from consecutive transverse US images (Fig. 3C).
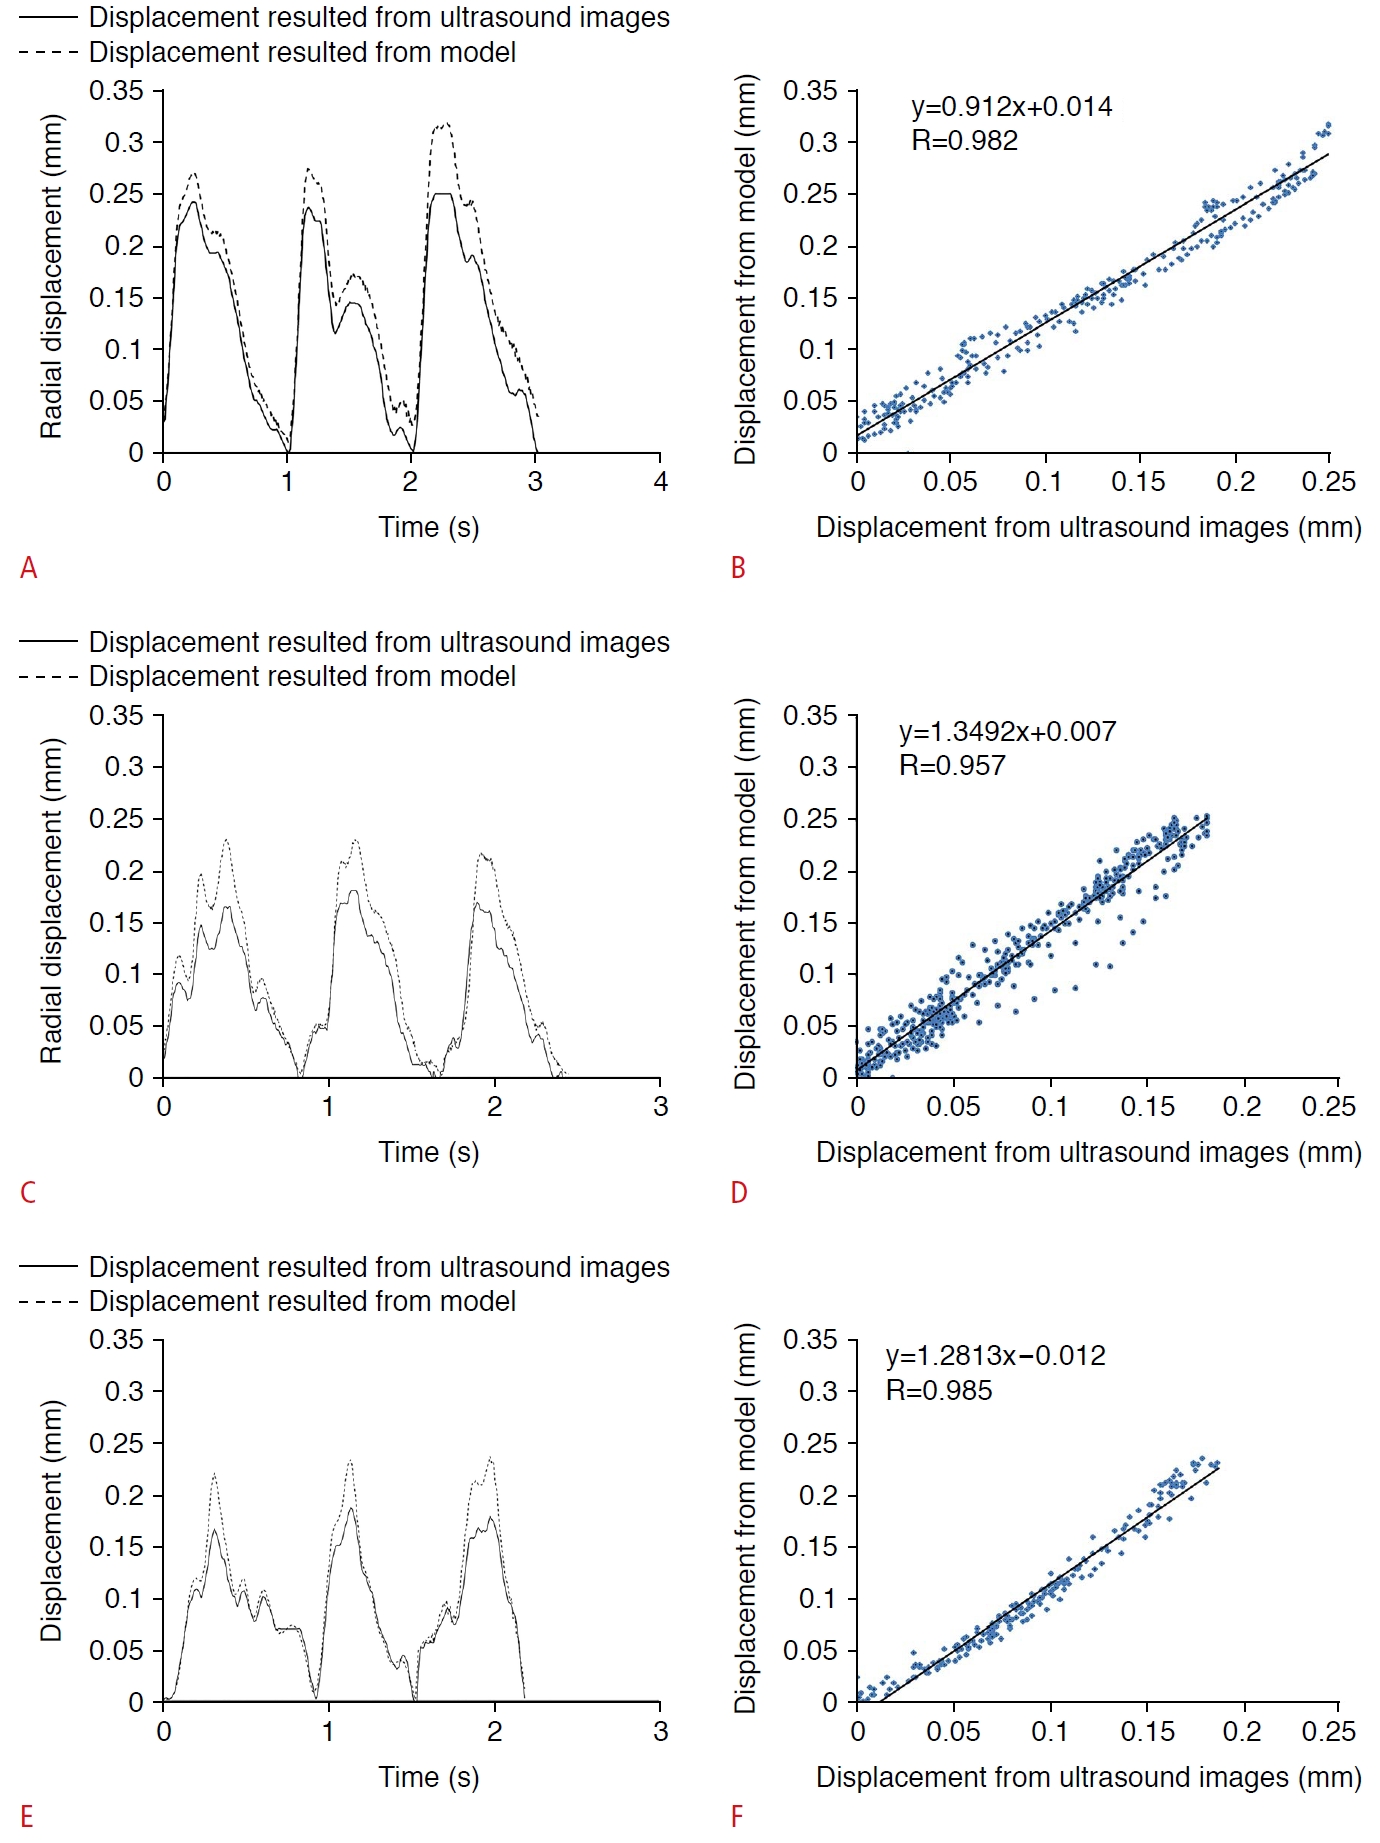
Fig. 4 shows the radial displacement waveforms of the carotid artery that resulted from US image processing and a finite element model of a healthy carotid artery, a less than 50% stenosed carotid artery, and a more than 50% stenosed carotid artery. The radial displacement values that resulted from the finite element models were similar to those that resulted from image processing. There were no significant differences between the maximum values of radial movement extracted from the two methods (P<0.05). The mean relative difference, expressed as a percentage, between the radial displacement results of the two methods was 15.88%, 13.93%, and 25.32% in the healthy group, the group with less than 50% stenosis, and the group with more than 50% stenosis, respectively. Nevertheless, the mean values of the Pearson correlation coefficients for radial displacement values between the two methods were 0.982, 0.957, and 0.985 in the healthy, less than 50% stenosis, and more than 50% stenosis groups, respectively (Fig. 4B, D, E).
The mean (SD) values of the peak systolic and end-diastolic internal diameters of the common carotid artery were 6.17±0.64 and 5.70±0.60 mm in the healthy group, 6.20±0.51 and 5.68±0.47 mm in the less than 50% stenosis group, and 6.35±0.53 and 6.05±0.51 mm in the more than 50% stenosis group, respectively. The mean (SD) values of the maximum and minimum intima-media thickness was 0.61±0.16 and 0.29±0.06 mm in the healthy group, 0.86±0.15 and 0.45±0.30 mm in the less than 50% stenosis group, and 1.02±0.24 and 0.64±0.24 mm in the more than 50% stenosis group, respectively. Significant differences were found in the internal diameter and intima-media thickness of the common carotid artery among the three groups of subjects included in the study (P<0.05).
The mean (SD) values of the optimal parameters describing the viscoelastic behavior of the common carotid artery of healthy and atherosclerotic subjects are shown in Table 2. There were significant differences in the parameters of the Kelvin model of the common carotid artery among the three groups.
The effective stress distribution in a longitudinal slice of a healthy carotid model and a stenosed carotid model are shown in Fig. 5. Some fluctuations were found in the stress distribution on the healthy artery wall in accordance with wall thickness. With the onset of stenosis and thickening of the wall (progressing to the stenosis throat), the amount of effective stress on the wall decreased and the effective stress increased again after passing through the plaque. This trend was quite evident in all subjects with mild stenosis. The average values of the effective, circumferential, and first principal stresses of the healthy arteries were 15.01±4.93, 12.97±5.07, and 12.39±2.86 kPa, respectively.
The mean (±standard deviation) values of the maximum effective, circumferential, and first principal stresses of the proximal shoulder, throat, and distal shoulder of the plaques of the stenosed groups are given in Table 3. As the percentage of stenosis increased from mild to significant, the effective stress of the proximal shoulder, throat, and distal shoulder of the plaque increased by 6%, 97%, and 21%, respectively. However, only the increase at the plaque throat was statistically significant (P<0.05). Progressing to the plaque throat, the mean circumferential stress in the severe stenosis group increased significantly (74%) and after passing the throat again, it decreased (4% decrease relative to the proximal shoulder). As can be seen in Table 3, an increase in the carotid occlusion from mild to severe led to a 17% decrease, a 103% increase, and a 39% increase in the principal stress of the proximal shoulder, throat, and distal shoulder of the plaque, respectively.
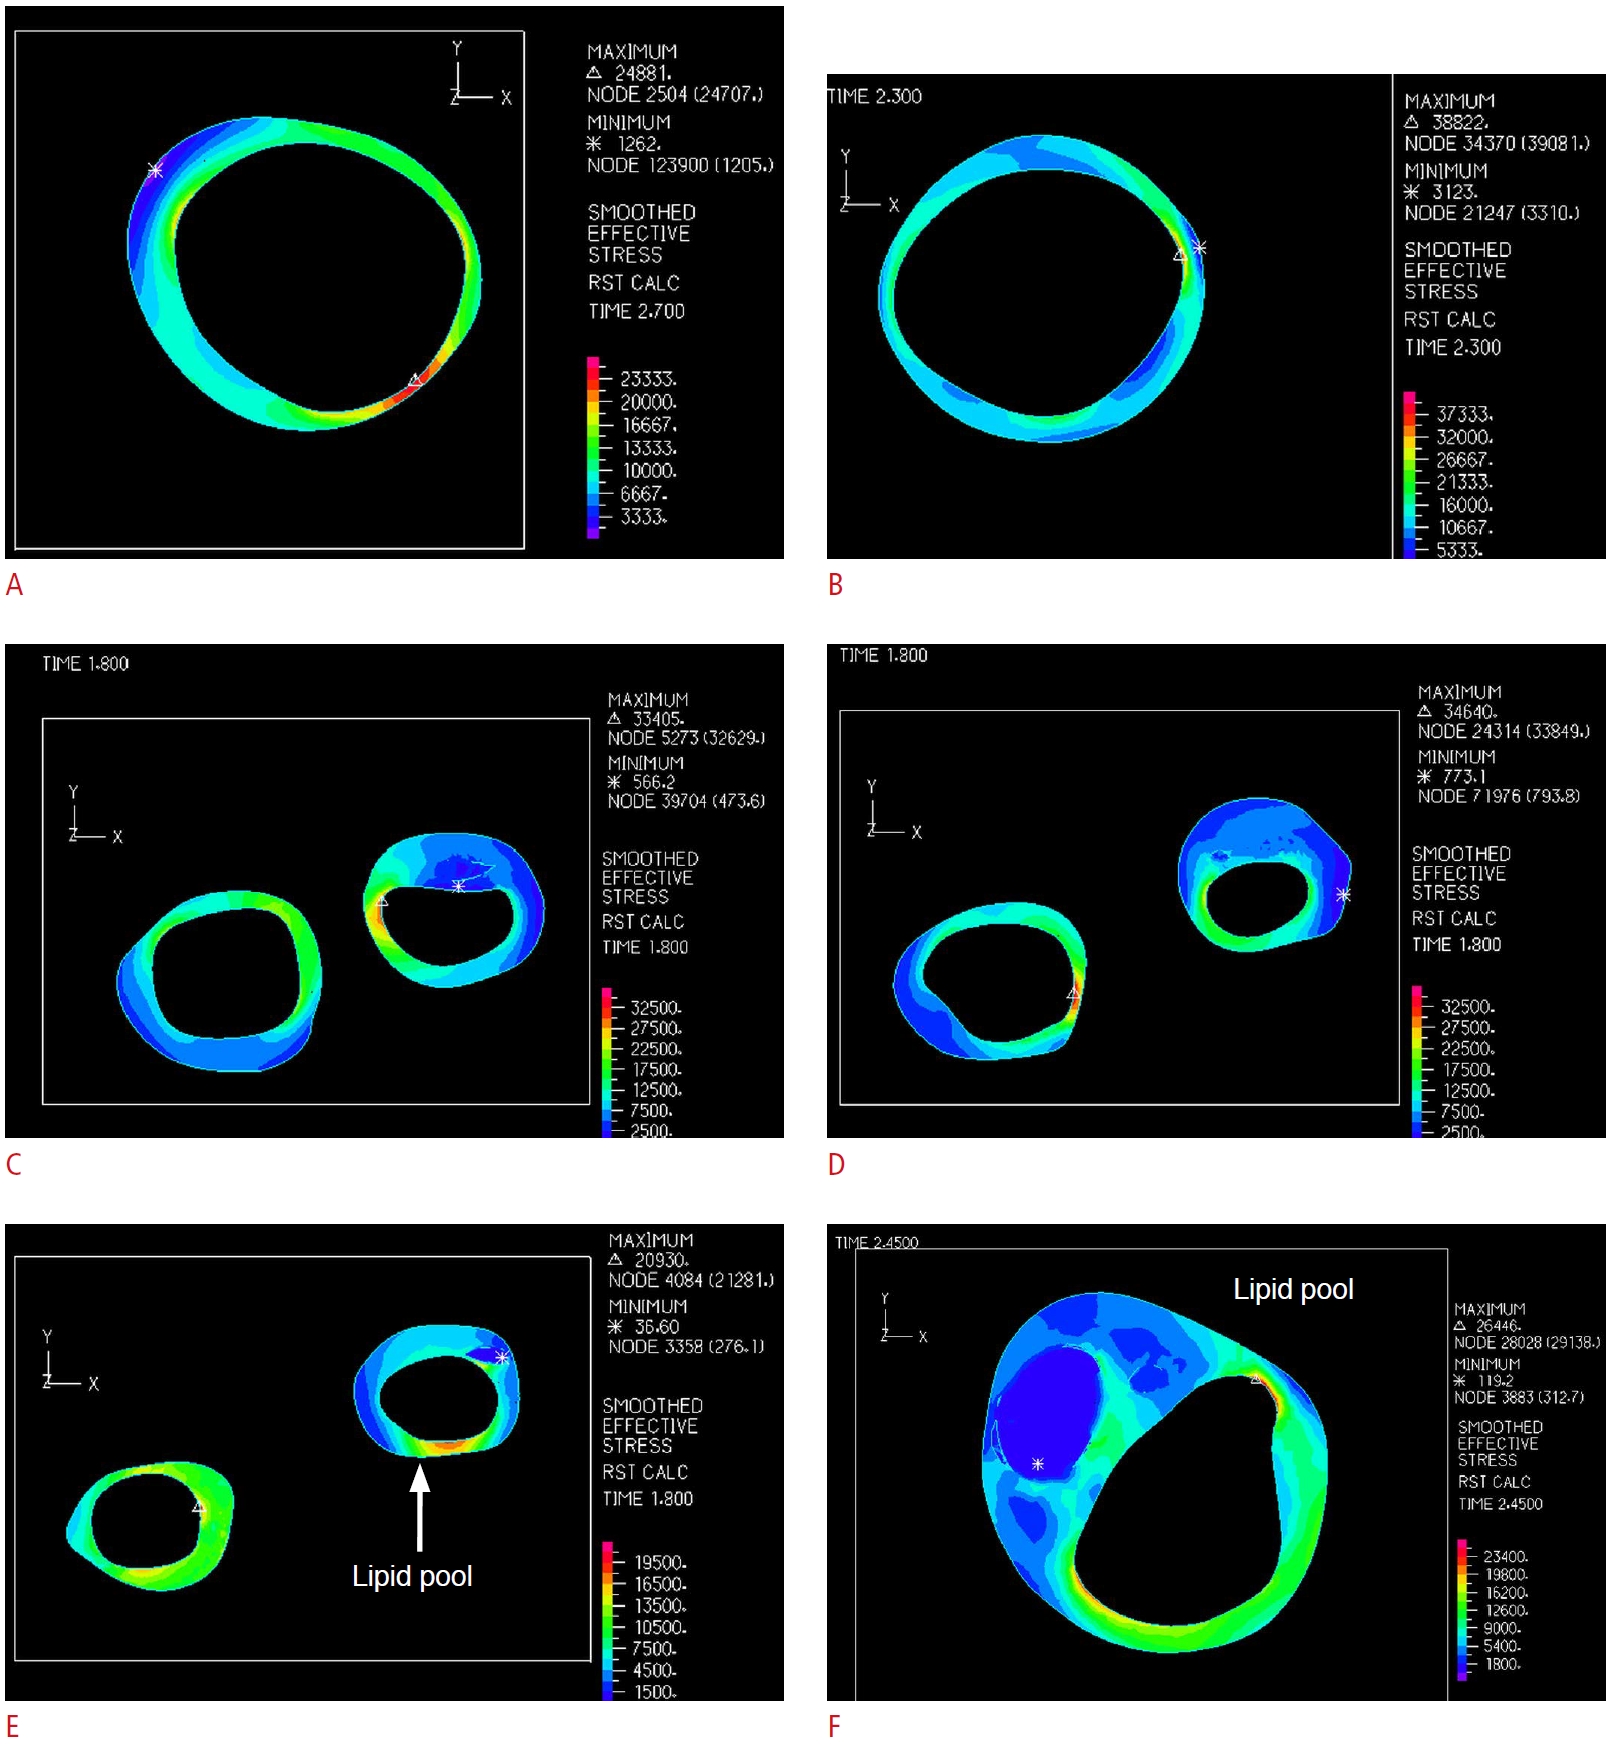
In 11 of the 15 sections with the highest effective stress in the healthy group, the maximum stress was located at the thinnest part of the wall, and in nine of the 15 sections with the lowest effective stress in the healthy group, the minimum stress was located at the thickest part of the wall. Therefore, the wall thickness was not the only factor determining the extremum stress location (Fig. 6A, B). In the group with less than 50% stenosis, in eight and nine sections out of 15, the maximum and minimum effective stresses were located at the thinnest and thickest parts of the wall, respectively. Additionally, in the group with more than 50% stenosis, in four and five sections, the maximum and minimum effective stresses were located at the thinnest and thickest parts of the wall, respectively (Fig. 6C, D). Moreover, in the eight and 24 sections including a lipid pool in the groups with less and more than 50% stenosis, respectively, the minimum effective stress was located at the lipid pool (Fig. 6E, F).
In the transverse sections containing calcification, the effective stress exerted on the calcified area was higher than that exerted on other parts of the artery wall. Fig. 7 shows the stress distribution of three transverse sections containing calcification.
A preliminary examination of longitudinal sections of the stenotic carotid artery models showed that effective stress decreased with increasing thickness (and onset of stenosis). This reduction was only due to the thickening of the wall. An evaluation of the transverse sections of the models showed that the principal stress and circumferential stress distributions were similar to each other, except that the regions of negative principal stresses were smaller than those of negative circumferential stresses (Fig. 8). The mid-fibrotic cap, which has been reported to be the most rupture-prone site of the fibrotic cap, had negative principal stress.
Discussion
Finite element analysis is widely utilized to estimate the stress distribution of artery models. These models are important because a knowledge of mechanical stresses is crucial for understanding both the initial and final stages of atherosclerosis plaque development. There are few 3D models of diseased arteries, and even fewer patient-specific models analyzing stress distribution in physiological conditions.
Tang et al. (2004) [21] reported that stresses are 3D and concluded that future studies, whether ideal or patient-specific modeling, should be 3D. Nieuwstadt et al. (2013) [22] compared two-dimensional (2D) and 3D models of histologically confirmed atherosclerotic coronary arteries and stated that 3D models are required for accurate calculations of peak stresses. Comparing 2D and 3D solid and 3D fluid-structure finite element models of stenosed carotid bifurcation showed reasonable agreement between the results of 3D solid and 3D fluid-structure models (except for the bifurcation). Moreover, the results of 3D solid models were slightly higher than those of the 3D fluid-structure model. Thus, a 3D solid model may provide an accurate estimation of plaque stresses with lower computational cost [23].
Few studies have used US images for reconstruction of the carotid artery and subsequent finite element modeling. Lee et al. (2004) [24] showed that the geometry needed for finite element modeling can be reconstructed from consecutive US images. In the present study, subject-specific series of sequential transverse US images with 0.5-mm intersectional distances were used to reconstruct the artery geometry and plaque components. The pulse pressure waveforms and perivascular effective pressures applied to the artery wall were extracted by processing longitudinal US images. In order to evaluate the model's ability to simulate the in vivo behavior of the artery wall, the radial displacement values of the artery wall resulting from models and US image processing were compared with each other. Our results showed that the radial displacement obtained from the viscoelastic finite element model had good visual agreement with those resulting from US image processing. However, there were differences between the two methods in the maximum radial displacement. According to the results of the literature, perivascular tissue causes a significant radial restriction of the carotid and femoral arteries. This constraint is mainly responsible for the external pressure exerted on the artery and significantly reduces the artery cross-section, circumferential stress, and strain. For the carotid and femoral arteries, perivascular pressure can account for about 50% of internal pressure in physiological conditions [19]. Zhang et al. [25] predicted that even a small external pressure (10%) would reduce the circumferential stress of coronary and aortic arteries. Therefore, a reason for the lower stresses found in the present study compared to other 3D modeling studies might be due to the effect of perivascular pressure in our models. However, no other 3D modeling studies have included perivascular pressure. Nevertheless, the finding that higher values of radial displacement resulted from models in comparison to those resulting from US image processing shows that perivascular tissue is not the only factor controlling radial movement, and other factors such as hormonal and/or pharmaceutical stimulations of smooth muscle cells may affect the radial distention of the arteries; however, these factors were not included in the models used in the present study.
A comparison between 3D single- and double-layered models of carotid bifurcation showed that increasing the internal pressure (280 mmHg) increased the bifurcation stress to more than 1 MPa. However, the location of the maximum stress was on the line separating the internal and external carotid arteries. In the aforementioned study, the two-layered model had higher stresses than the single-layered one, but the strain of the models showed the opposite tendency [26].
According to the results of the present study, it seems that applying perivascular pressure had an effect similar to an additional external layer that restricted the radial displacement of the artery wall. The results of this study showed that with plaque formation and its progression from mild to severe, the average values of maximum effective stress applied to the proximal shoulder, throat, and distal shoulder of the plaque increased by 6%, 97%, and 21% respectively, while the average values of the circumferential stress magnitude exerted on the proximal shoulder, throat and distal shoulder of the plaque increased by 25%, 103%, and 29%, respectively. Moreover, the average magnitudes of the first principal stress of the proximal shoulder, throat, and distal shoulder of the plaque decreased by 17% and increased by 103% and 39%, respectively. Studies have shown that with increasing vessel stiffness, shear stress and moderate flow decrease [27].
In the present study, the Young modulus of the stenosed arteries was higher; therefore, stress distribution variations might have been due to stiffness changes in the plaque. Moreover, it has been reported that plaque symmetry has a significant effect on stress and strain distribution [28]. In our study, differences in stress distribution of the proximal shoulder, throat, and distal shoulder might to have some extent resulted from differences in the symmetry of plaques at different anatomical locations.
Yuan et al. [29] reported that stress was sensitive to the tissue material properties and depended on the fibrotic cap thickness. In general, in the plaque shoulder, the softer material leads to higher stress and stretching. The stiffer fibrotic cap causes higher stress and stretching. Compared to the plaque shoulder, the stress in the midfibrotic cap is more sensitive to changes in material properties. In the present study, in the slices containing a lipid pool, the lowest effective stresses were located in the lipid pool, which is consistent with the study of Yuan et al. [29].
According to a literature review, the stress peak of hypocellular plaque is higher than that of cellular and calcified plaques [30]. It seems that calcification acts as a supporter of the plaque, enabling higher stresses to be tolerated without rupture risk. A quantitative comparison of the present study results is not possible due to differences among studies in models and loadings. In particular, no previous finite element studies have analyzed the viscoelastic behavior of the artery wall and the effects of perivascular tissue in a subject-specific manner. The lower stress values of the present study compared to other studies might have been due to applying pulse pressure as the internal load. In fact, the in vivo deformation of the artery wall is caused by the pulse pressure. When the pressure increases, biomechanical changes of the adventitia and perivascular stiffness constrain the dilation. Studies have shown that the artery becomes stiffer with aging [25], which means that atherosclerotic lesions in younger individuals are subjected to higher mechanical stresses, but not that younger age groups are more prone to plaque rupture, since other pathobiological factors such as local inflammation are responsible for plaque vulnerability [31]. In the present study, the average values of artery wall stress in the healthy group were higher than those in both diseased groups, which may have been due to the thinner walls in this group. Another reason for higher stress in the healthy subjects might have been the smaller elastic modulus of their arteries and substantially lower energy loss during viscoelastic hysteresis.
To make plaques unstable, a stress threshold is required, which is a challenge in modeling. Circumferential and principal stresses are important in determining the rupture-prone sites of plaques. It has been reported that critical plaque wall stress is associated with plaque rupture [32] and could discriminate ruptured and unruptured plaques [33]. Critical plaque wall stress occurs at the ruptured sites of plaques (middle of the plaque throat) [29], where there is a large gradient in the material properties of the plaque.
This study suffers from some limitations. The ages of the three groups of subjects were significantly different, which is meaningful because age affects the biomechanical behavior of the artery wall. Motion artifacts of the subjects could have affected the accuracy of the geometry. The viscoelastic parameters of the artery wall were extracted from non-stenosed parts of the artery and then were applied to the entire artery wall. However, changes in the biomechanical properties of the stenosed parts of the artery may result in different viscoelastic behavior, which should be investigated in future studies.
In the present study, a solely US-based approach was introduced and implemented to model the in vivo viscoelastic behavior of healthy and atherosclerotic carotid arteries. There was a high correlation between the radial displacement of the carotid artery that resulted from finite element models and image processing. It is concluded that the viscoelastic model based on US images could simulate the physiological periodic distention of the artery. This is the first report of such an accurate finite element model. Moreover, our results showed that the model implemented in this study can discriminate differences in the stresses applied to mildly and severely stenotic plaques. This model represents a step forward towards improving the biomechanical understanding of plaque ruptures and the factors affecting ruptures.


 Download Citation
 PDF Links
 PubReader
 ePub Link
 Full text via DOI
 Full text via PMC


