

 Print
Print facebook
 twitter
 Linkedin
 google+

Introduction
Hepatocellular carcinoma (HCC) is the only cancer that is diagnosed noninvasively in high-risk patients using the typical imaging features of computed tomography (CT), magnetic resonance imaging (MRI), or contrast-enhanced ultrasonography (CEUS) [1,2]. CEUS has unique advantages over CT and MRI, as it offers pure vascular images, real-time dynamic information, and an excellent safety profile for patients with impaired renal function or allergies to iodine or gadolinium [3-6]. The contrast agents for ultrasonography (US) can be categorized into Kupffer agent (Perfluorobutane, Sonazoid, GE Healthcare, Chicago, IL, USA). In previous studies of CEUS using a pure-vascular agent, most HCCs presented arterial phase hyperenhancement (APHE) with mild and late (≥60 seconds) washout, while many cholangiocarcinomas presented rim APHE or early (<60 seconds) or marked washout [7-11]. This diagnostic criterion is highly specific for the diagnosis of HCC [12,13], and Terzi et al. [13] reported a 98.5% positive predictive value (PPV) among 1,006 at-risk nodules.
Unlike the pure-vascular agent, a distinctive characteristic of the Kupffer agent is that it is uniquely taken up by Kupffer cells and yields sustained echogenicity in the liver parenchyma for tens of minutes [14,15]. However, there is limited evidence of how soon Kupffer cell uptake starts after contrast injection, which may cause different dynamic imaging features from those of the pure-vascular agent, such as the pseudowashout effect. Indeed, washout should be evaluated in an appropriate time window to minimize the pseudowashout effect. In addition, there is limited research on whether the 60-second cutoff for late washout is also specific for the diagnosis of HCC using the Kupffer agent.
Another unsolved question related to the Kupffer agent is the role of the Kupffer phase in diagnosing HCC. Kudo et al. [16] reported that defect reperfusion imaging (i.e., reinjection of the Kupffer agent upon an observation showing a defect in the Kupffer phase) would be useful for diagnosing HCC [14]. However, non-HCC malignancies could also present Kupffer defects with APHE. According to the study of Kang et al. [12], three of 10 non-HCC malignancies presented APHE and hypoechogenicity in the Kupffer phase. Thus, APHE with hypoechogenicity in the Kupffer phase might not be a specific image feature of HCC.
Meanwhile, a recent study on the intraindividual comparison of diagnostic performance for HCC using pure-vascular and Kupffer agents showed that the Kupffer agent had better diagnostic performance than the pure-vascular agent in a simulation of the CEUS Liver Imaging Reporting and Data System (LI-RADS) v2017 [12]. This result might show the potential of CEUS with the Kupffer agent. However, there are only limited studies on the appropriate criteria for the non-invasive diagnosis of HCC by the Kupffer agent. Therefore, it was hypothesized that CEUS with the Kupffer agent would be suitable for diagnosing HCC in high-risk patients; however, the diagnostic criteria might differ from CEUS with the pure-vascular agent, particularly regarding the washout evaluation and the role of the Kupffer phase. The present study investigated the optimal cutoff time for determining late washout, the appropriate time window for determining washout that was not hampered by the pseudowashout effect, and the imaging features in the Kupffer phase for diagnosing HCC.
Materials and Methods
Compliance with Ethical Standards
This prospective study was approved by the institutional review board (IRB No. H-1807-171-962) of the authors’ institution, and written informed consent was obtained from all participants.
Participants
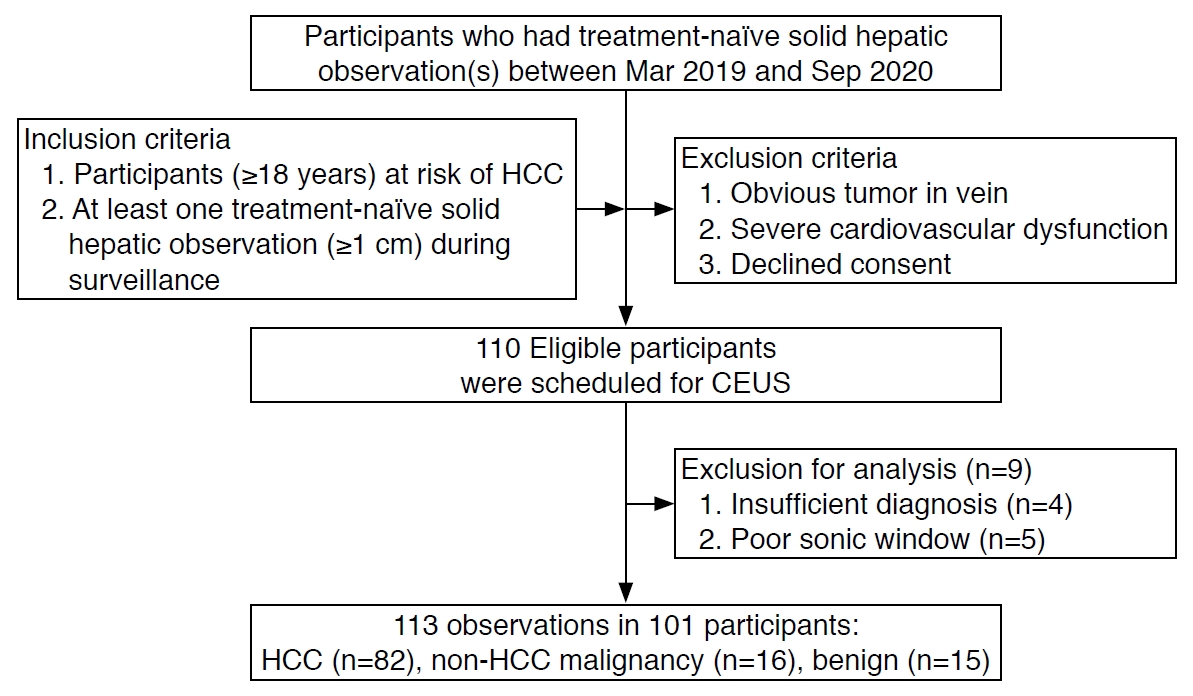
From March 2019 to September 2020, participants who had a treatment-naïve solid hepatic observation (≥1 cm) were recruited for this study according to the following inclusion criteria: (1) adult participants (≥18 years) at high risk of HCC according to the LI-RADS v2018 [2], which is liver cirrhosis or hepatitis B viral infection [2]; and (2) at least one solid hepatic observation on diagnostically acceptable conventional US, CT, or MRI within 6 weeks of study enrollment. The exclusion criteria were (1) an obvious tumor in a vein (LR-TIV according to CT/MRI LI-RADS v2018); (2) severe cardiovascular dysfunction; and (3) refusal to enroll in this study. The flow diagram of the study population is shown in Fig. 1. When CT or MRI presented multiple eligible observations, the operator chose up to two representative observations based on the following priority: (1) an observation possessing a higher probability of hepatic malignancy according to US LI-RADS v2017 or CT/MRI LI-RADS v2018 [2], and (2) better visibility on B-mode ultrasonography. The operator was allowed to examine more than one observation, provided that observations were shown in a single plane of US. Finally, a total of 101 participants with 113 hepatic observations were included in this study.
Contrast-Enhanced Ultrasonography
Real-time CEUS was performed by a board-certified abdominal radiologist (H.J.K.) with more than 9 years of experience in CEUS by using a contrast-specific US platform (RS80A [n=57] or RS85A [n=53], Samsung Medison, Seoul, Korea) with a convex, low-MHz (bandwidth, 1-7 MHz) transducer (CA1-7A, Samsung Medison). After determining the target observation by reviewing abdominal CT or MRI, B-mode scanning was performed to determine the best sonic window for CEUS. The predetermined parameters of CEUS were as follows: mechanical index of 0.18, dynamic range of 50, gain of 50%-60%, and frame rate of 12 pictures per second. The operators were allowed to adjust the US parameters to depict observations optimally. The US contrast agent perfluorobutane (Sonazoid, GE Healthcare) was prepared according to the manufacturer’s recommendations. Perfluorobutane was reconstituted with 2 mL of sterile water and divided into two doses of 1 mL each. The prepared 1 mL of perfluorobutane was manually injected via the same cannula, similarly followed by a 10-mL normal saline flush. The timer was started at the beginning of the saline flush. Continuous CEUS images of target observations were recorded under calm, normal breathing for the first 70 seconds, followed by intermittent scans every 20 seconds until 10 minutes after contrast injection.
Image Analysis
During perfluorobutane-enhanced ultrasonography (PFB-US) examinations, the operator was asked to record the following dynamic image features: the presence of APHE and its patterns (rim, non-rim, and peripheral globular), washout timing, and its degree (mild or marked). A board-certified radiologist (J.Y.) with 7 years of experience in CEUS independently reviewed the PFB-US examinations. The reviewer was blinded to the final diagnosis and any clinical or laboratory information, but was aware that the study population was at risk for HCC and was given annotated B-mode images of each target. The CEUS features during the vascular phase were defined by simulating CEUS LI-RADS v2017 [1]. The arterial phase was thought to be from 10 to 45 seconds after contrast injection. Non-rim APHE was defined as unequivocal enhancement compared with the liver parenchyma without rim-like or peripheral globular enhancement. Washout was defined as a temporal complete or partial reduction in enhancement relative to the parenchyma after the arterial phase. Mild washout referred to observations with less enhancement than that in the parenchyma. Marked washout was defined as observations appearing black or punched out within 2 minutes after contrast injection. Washout evaluation was performed for hepatic observation without rim APHE or peripheral globular enhancement in the arterial phase. The Kupffer phase was also assessed at 10 minutes after contrast injection, and the echogenicity was evaluated as hyperenhancement, isoenhancement, mild hypoenhancement, or marked hypoenhancement. Marked hypoenhancement was defined as an observation that appeared black or punched out.
The diagnosis of HCC by PFB-US was made based on non-rim APHE (≥1 cm) with late and mild washout. To investigate the appropriate cutoff to determine late washout on PFB-US, different cutoff times with 5-second intervals (50, 55, 60, 65, and 70 seconds after contrast injection) were applied. Washout seen after the cutoff time was regarded as late washout, and when it was seen before then, it was regarded as early washout. In addition, to investigate the appropriate time window for investigating washout, different time windows with 1-minute intervals (until 2, 3, 4, 5, 6, 7, 8, 9, and 10 minutes after contrast injection) were used. When evaluating the different cutoff times for late washout, the time window was fixed at 5 minutes after contrast injection. When evaluating the different time windows for washout, the cutoff time for late washout was fixed at 60 seconds. The 5-minute and 60-second times were determined by simulating CEUS LI-RADS v2017 [1], which suggested diagnostic criteria for HCC by using CEUS with a pure blood-pool agent. When hepatic observations presented any finding of rim APHE, marked washout, or early washout, it was regarded as a non-HCC malignancy.
The B-mode visibility of the target observation was also recorded using a 5-point Likert scale: 1, a very poor sonic window that is unacceptable for evaluating the observation; 2, a poor sonic window with a hampered ability to evaluate the observation; 3, an acceptable sonic window with mild interference for evaluating the hepatic observation; 4, a good sonic window with minimal interference for evaluating the hepatic observation; and 5, an excellent sonic window with infrequent interference for evaluating the hepatic observation. Hepatic observations with a visibility score of 1 were excluded from the analysis.
Reference Standard
Fifty-one percent of the target observations (58/113) were diagnosed histopathologically (surgery, n=23; biopsy, n=35), and 49% (55/113) were diagnosed noninvasively, with the following distribution: 82 HCCs (39 pathologic diagnoses and 43 non-invasive diagnoses), 16 non-HCC malignancies (16 pathologic diagnoses), and 15 benign lesions (three pathologic diagnoses and 12 presumed benign based on follow-up stability). Information on hepatic tumor pathology was routinely reported in the institution’s pathologic reports by one of the two experienced pathologists with more than 18 years of hepatic pathology experience. The non-invasive diagnostic criteria of HCC were non-rim APHE (≥1 cm) with washout or threshold growth or non-rim APHE (≥2 cm) with capsular enhancement, following CT/MRI LI-RADS v2018 [2]. Eleven percent (12/113) of the target observations were presumed to be benign observations without a specific diagnosis based on their stability of more than 1 year (n=4) or typical imaging features of hemangioma with more than 6 months of stability (n=8).
Statistical Analysis
Continuous variables are reported as mean±standard deviation (SD) and range. Descriptive data are reported as numbers and percentages. Interobserver agreement of the imaging features between the operators and the reviewer was analyzed by using weighted κ statistics. The sensitivity, specificity, accuracy, PPV, and negative predictive value (NPV) of PFB-US for diagnosing HCC using different cutoffs for late washout and different time windows for determining washout were analyzed on a per-lesion basis, and compared with the McNemar test. All statistics were performed by commercially available software (MedCalc version 16.4, MedCalc Software, Ostend, Belgium). Two-tailed P-values <0.05 were considered to indicate a statistically significant difference.
Results
Participants and Focal Hepatic Lesions
A total of 110 participants met the criteria for study enrollment and were scheduled for CEUS. Nine participants were further excluded because of low B-mode visibility (score of 1, n=5) or insufficient diagnosis (n=4) due to inconclusive histopathologic results (n=1) or not fulfilling the non-invasive diagnostic criteria of HCC (n=3). Accordingly, 101 participants (83 men; age [mean±SD], 62.2±11.1 years; range, 31 to 86 years) with 113 hepatic observations (size [mean±SD], 33.5±2.8 mm; range, 10 to 128 mm) were finally included in this study (Fig. 1). The most common cause of chronic hepatic disease was hepatitis B infection (63.4%, 64/101). Sixty-nine percent (70/101) of participants had liver cirrhosis. Of 113 hepatic observations, 73% (82/113) were HCCs, 14% (16/113) were non-HCC malignancies, and 13% (15/113) were benign lesions. The clinicopathological characteristics of the participants and the hepatic observations are described in Table 1.
PFB-US Features for Hepatic Observations
Arterial phase hyperenhancement
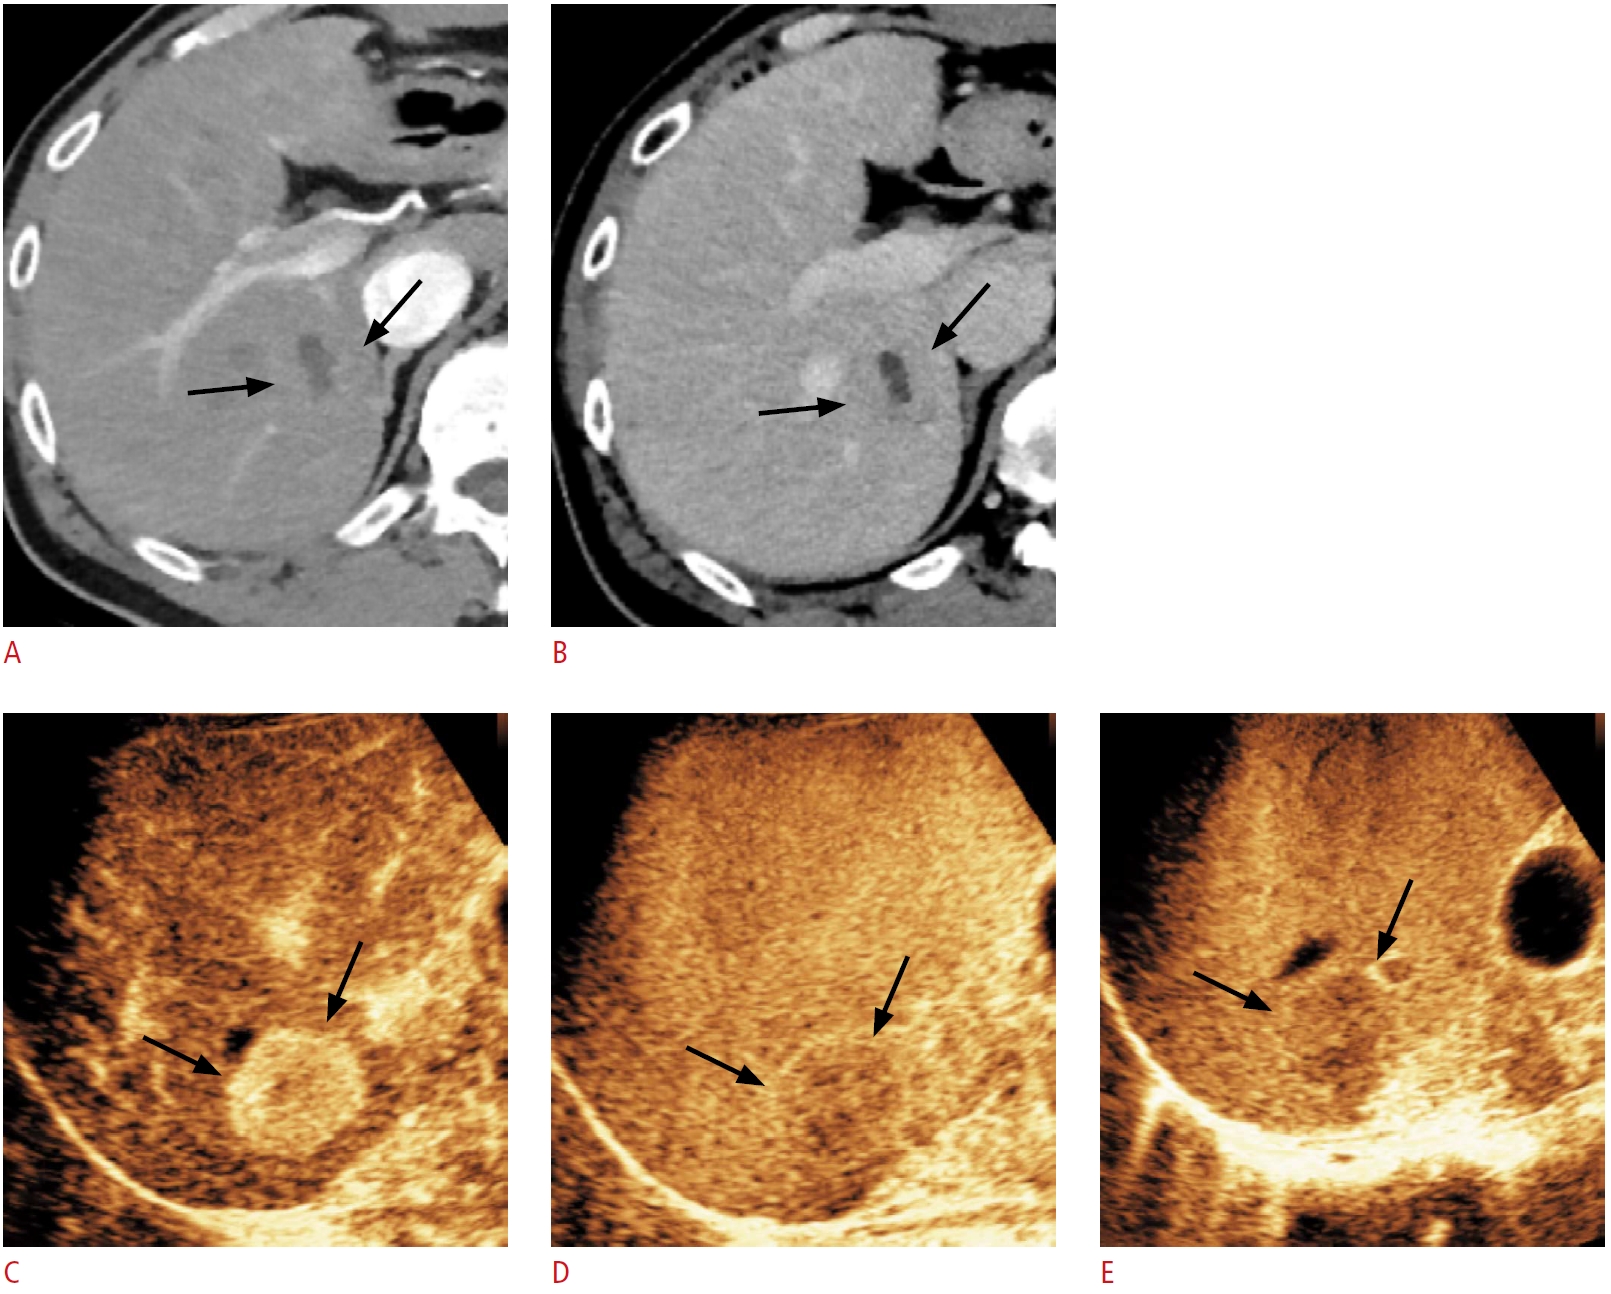
Most HCCs presented non-rim APHE (operator, 71/82 [86.6%]; reviewer, 60/82 [73.2%]), and fewer than 10% of HCCs presented rim APHE (operator, 3/82 [3.7%]; reviewer, 8/82 [9.6%]) (Table 2, Fig. 2). Every hepatic observation with peripheral globular enhancement was a hemangioma. The interobserver agreement of the patterns of APHE was 0.71 (95% CI, 0.57 to 0.84).
Washout
The washout assessment was performed for hepatic observations without rim APHE or peripheral globular enhancement in the arterial phase, including HCCs (n=79), non-HCC malignancies (n=9), and benign cases (n=11). Most HCCs showed mild washout (operator, 73/79 [92.4%]; reviewer, 65/74 [87.8%]). A few HCCs showed marked washout (operator, 2/79 [2.5%]; reviewer, 4/74 [5.4%]), or no washout (operator, 4/79 [5.1%]; reviewer, 5/74 [6.8%]). Every non-HCC malignancy presented washout with mild (operator, 6/9 [66.7%]; reviewer, 4/5 [80.0%]) or marked degrees (operator, 3/9 [33.3%]; reviewer, 1/5 [20.0%]). For both the operator and reviewer, 64% of benign lesions (7/11) did not show washout, and 36.4% (4/11) showed mild washout (Fig. 3). No benign lesion presented marked washout. The interobserver agreement of the presence and degree of washout was 0.76 (95% CI, 0.63 to 0.90).
Kupffer phase
Many HCCs (operator, 50/82 [61.0%]; reviewer, 72/82 [87.8%]) showed mild hypoechogenicity, and some HCCs (operator, 21/82 [25.6%]; reviewer, 5/82 [6.1%]) showed marked hypoechogenicity in the Kupffer phase. Thirteen percent of HCCs (operator, 11/82) or 6.1% (reviewer, 5/82) did not show hypoechogenicity in the Kupffer phase (Fig. 4). Every non-HCC malignancy presented hypoechogenicity for both the operator and reviewer: 56.2% (9/16) presented marked hypoechogenicity, and 43.8% (7/16) presented mild hypoechogenicity. Although the frequency of hypoechogenicity in the Kupffer phase did not differ significantly between HCCs (71/82 [86.6%]) and non-HCC malignancies (16/16 [100%], P=0.201), both were more frequent than benign lesions (operator, 6/15 [40.0%]; reviewer, 8/15 [53.3%]; P<0.001 in both). None of the benign lesions presented marked hypoechogenicity. Fig. 5 shows a comparison of the echogenicity in the vascular phase and the Kupffer phase for hepatic observations without rim APHE or peripheral globular enhancement. No hepatic observation presented mild washout after 6 minutes. The interobserver agreement for echogenicity in the Kupffer phase was 0.51 (95% CI, 0.28 to 0.74).
Diagnostic Performance of HCC Depending on the Time Definition to Evaluate Washout
Different cutoff times for late washout
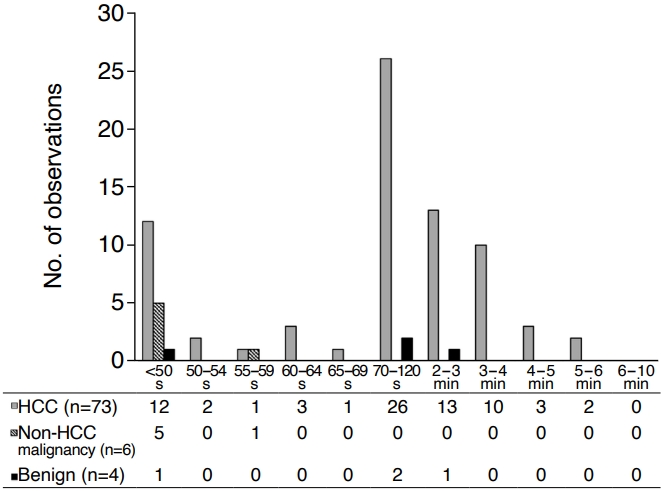
The time distribution of mild washout is presented in Fig. 6. When adopting different cutoff times for late washout (50, 55, 60, 65, or 70 seconds), the sensitivity of CEUS for HCC gradually increased as the cutoff time decreased (Table 3). In contrast, the specificity of CEUS gradually increased as the cutoff time for late washout increased and achieved 100% (operator) or 93.5% (reviewer) at cutoff times of 60, 65, and 70 seconds (Table 3). Among the cutoff times showing the highest specificity, the 60-second cutoff presented the highest sensitivity of 62.2%. However, the sensitivity of the 60-second cutoff did not show a statistically significant difference compared to the 50-second (64.6%, P=0.133), 55-second (63.4%, P=0.231), 65-second (59.8%, P=0.705), and 70-second cutoffs (59.8%, P=0.705).
Different time windows for investigating washout
When adopting different time windows for determining washout (until 2, 3, 4, 5, 6, 7, 8, 9, or 10 minutes after contrast injection), the sensitivity, accuracy, and NPV of CEUS for HCC increased as the time window increased until 6 minutes after contrast injection for both the operator and reviewer (Table 4). When the time window for investigating washout extended to 6 minutes, the sensitivity of 62.2% was significantly higher than that of other time windows (2 minutes, 31.7%, P<0.001; 3 minutes, 43.9%, P<0.001; 4 minutes, 56.1%, P=0.025; 5 minutes, 59.8%, P=0.157). The specificity and PPV of CEUS for HCC were 100% and 100% for the operator, and 93.5% and 95.8% for the reviewer (Table 4). There were two false-positive cases for the reviewer (cholangiocarcinoma and combined hepatocellular cholangiocarcinoma).
Discussion
The results of this study showed that after excluding observations with rim APHE or marked washout or peripheral globular arterial enhancement, the criterion for late washout as hypoechogenicity from 60 seconds to 6 minutes after contrast injection was feasible for diagnosing HCC using PFB-US without compromising specificity. There was no additional gain for diagnostic performance for HCC when the time window for washout exceeded 6 minutes.
In the present study, there were no false-positive cases for diagnosing HCC using the time window for investigating washout of up to 6 minutes after contrast injection. Hence, the pseudowashout effect caused by perfluorobutane uptake by Kupffer cells might be negligible for diagnosing HCC even until 6 minutes after contrast injection. This result diverges from the authors’ original expectations, as it was thought that the progressive enhancement of the liver parenchyma might decrease the specificity of PFB-US. In particular, it is well known that hemangioma occasionally shows decreased echogenicity in the Kupffer phase of PFB-US [17]. In MRI with a hepatocyte-specific contrast agent, hypointensity in the transition or the hepatobiliary phase is not regarded as washout in CT/MRI LI-RADS v2018 [2] because of a decrease in specificity due to the pseudowashout effect [18,19]. However, after excluding observations with typical hemangioma or non-HCC malignancy features, which is bright T2 signal intensity or targetoid appearance on a diffusion-weighted image or dynamic images [20], the pseudowashout effect of the hepatobiliary phase was minimized. Likewise, through the exclusion of observations showing typical hemangioma and non-HCC malignancy features using peripheral globular enhancement, rim APHE, or marked washout, the pseudowashout effect would be minimized. This result is in line with that of another study of the diagnostic performance of PFB-US, which showed 100% specificity for PFB-US in diagnosing HCC in high-risk patients by simulating CEUS LI-RADS v2017, which uses 5 minutes as the limit of the vascular phase for washout [12].
In the present study, extending the washout time window beyond 6 minutes did not give additional benefit to the diagnostic performance for HCC. When the time window for washout was extended until the Kupffer phase (over 10 minutes), the sensitivity and specificity were not different from the time window within 6 minutes after contrast injection. This is not in line with previous studies that showed increased sensitivity for HCC diagnosis when Kupffer phase hypoechogenicity was regarded as a washout [21,22]. Hwang et al. [22] reported that 13.4% of HCC showed hypoechogenicity only in the Kupffer phase. The inconsistency between the results of those studies and the present results might be explained by the nodule size (1.5 cm vs. 3.4 cm). Smaller nodules are more likely to be early HCC, in which a few portal triads are just starting to decline [23], and they might not show washout in the vascular phase. In addition, it may be difficult to determine that the PFB-US image around 6 minutes after contrast injection is the pure vascular phase without the effect of the Kupffer phase. Despite a lack of consensus regarding how they affect dynamic US images, the phagocytosis of perfluorobutane by Kupffer cells was observed even within 1 minute after contrast injection in an in vivo study [15]. Further research on the proper time window for the Kupffer phase and its role in diagnosis for HCC seems to be needed.
The degree of hypoechogenicity in the Kupffer phase would differentiate benign lesions from malignancies. No benign lesion presented marked hypoechogenicity in the Kupffer phase, whereas 56.2% of non-HCC malignancies and 25.6% of HCCs did. In addition, every non-HCC malignancy presented hypointensity in the Kupffer phase irrespective of degree. Thus, the present results cautiously suggest that marked hypoechogenicity in the Kupffer phase might differentiate malignant from benign lesions.
Interestingly, in this study, there were seven HCCs with late and mild washout but isoechogenicity in the Kupffer phase. This result could represent the different implications of each phase of PFB-US and might be independent of each other. The dynamic phase would represent the dynamic information of the hepatic observations, while the Kupffer phase represents the function or density of the Kupffer cells. In particular, the echogenicity in the Kupffer phase seems to help assess the histologic grade of HCCs rather than the diagnosis of HCC. In previous studies, the histologic grade of HCCs was correlated with the number of Kupffer cells [24,25], and the echogenicity of the Kupffer phase would help estimate the histologic grade of HCCs [26].
The present study has several limitations. First, it analyzed a single-center population, and the most common etiology of chronic liver disease was hepatitis B infection (63.4%), which is not the most common etiology in Europe or America. Thus, there may have been an unavoidable selection bias. Multicenter and multinational studies are warranted to validate these study results. Second, the relatively small number of benign lesions (13.2%) hindered the generalizability of the results, and the diagnostic performance of PFB-enhanced US was potentially biased. However, in the clinical context, CEUS is usually not performed on known benign lesions. Third, the operator, who determined the target observations and performed CEUS, was not blinded to the radiologic information from other imaging modalities. Thus, to minimize bias, a blinded reviewer reviewed the images. Fourth, 1-year stability might not be sufficient to ensure benignity of lesions.
In conclusion, PFB-US is feasible for diagnosing HCC in individuals at high risk. Non-rim APHE with mild and late washout is a feasible criterion for diagnosing HCC, and investigating washout within 6 minutes after contrast injection with a 60-second cutoff for late washout showed the highest sensitivity, without losing specificity for diagnosing HCC in high-risk individuals.


 Download Citation
 PDF Links
 PubReader
 ePub Link
 Full text via DOI
 Full text via PMC


