

 Print
Print facebook
 twitter
 Linkedin
 google+

Introduction
Hepatitis B virus (HBV) infection may result in acute and chronic hepatitis B (CHB), and some patients with CHB develop liver fibrosis and cirrhosis [1]. Appropriate evaluation and treatment of CHB in its early stages may contain or mitigate the progression of liver damage and improve patients’ prognosis [1,2]. Ultrasonography (US) plays an important role in the evaluation of chronic liver disease [3-8]. When assessed by US with a 2-4 MHz convex transducer, the livers of some patients with chronic liver disease may show minimal manifestations of abnormalities, while other livers may present typical pathological changes [3-6]. Scanning the liver with a curvilinear transducer with a frequency of 7 MHz or above can reveal more detailed information about the liver surface and superficial parenchyma, and doing so complements routine scanning with a 2-4 MHz convex transducer [7,8]. However, US with a higher-frequency curvilinear transducer can also cause confusion in clinical practice, due to factors such as scattered patchy echogenicity in the liver of CHB patients. Patchy echogenicity (hyperechogenicity or both hyperechogenicity and hypoechogenicity) refers the presence of small (2-8 mm in maximal diameter), non-space-occupying, abnormal focal echogenic zones in the liver, with no detectable blood vessels using color Doppler flow imaging or power Doppler imaging. These areas show the same enhancement pattern as the adjacent liver parenchyma on contrast-enhanced US, unlike discernible nodular space-occupying lesions. These echogenic patches are usually invisible or inadequately seen on computed tomography (CT) and/ or magnetic resonance imaging (MRI) (unenhanced and contrast-enhanced), and biopsy results usually show they are not tumors, dysplastic nodules, or regenerative nodules of the liver [9]. In patients with inactive HBV, CHB, or other CHB-related diseases, disease surveillance is important. Extensive research has been conducted to find optimal noninvasive approaches to evaluate liver fibrosis and cirrhosis [5,10-15]. Acoustic radiation force impulse (ARFI) point-shear-wave elastography (P-SWE) is a new approach for the evaluation of the stiffness of solid organs and soft tissue; studies have shown that shear wave velocity (SWV) can be accurately measured and that the measurements are reproducible [12-15]. Recent studies have also shown a correlation between the liver SWV measured using P-SWE and the degree of fibrosis obtained through liver biopsy [12,16-19]. Patchy echogenicity on the liver is a conspicuous sign suggestive of an anomaly. However, no study has investigated whether the presence of patchy echogenicity in the liver is associated with the stage of fibrosis. The objective of this study was to investigate whether liver stiffness varied between CHB patients with and without patchy echogenicity.
Materials and Methods
Study Population
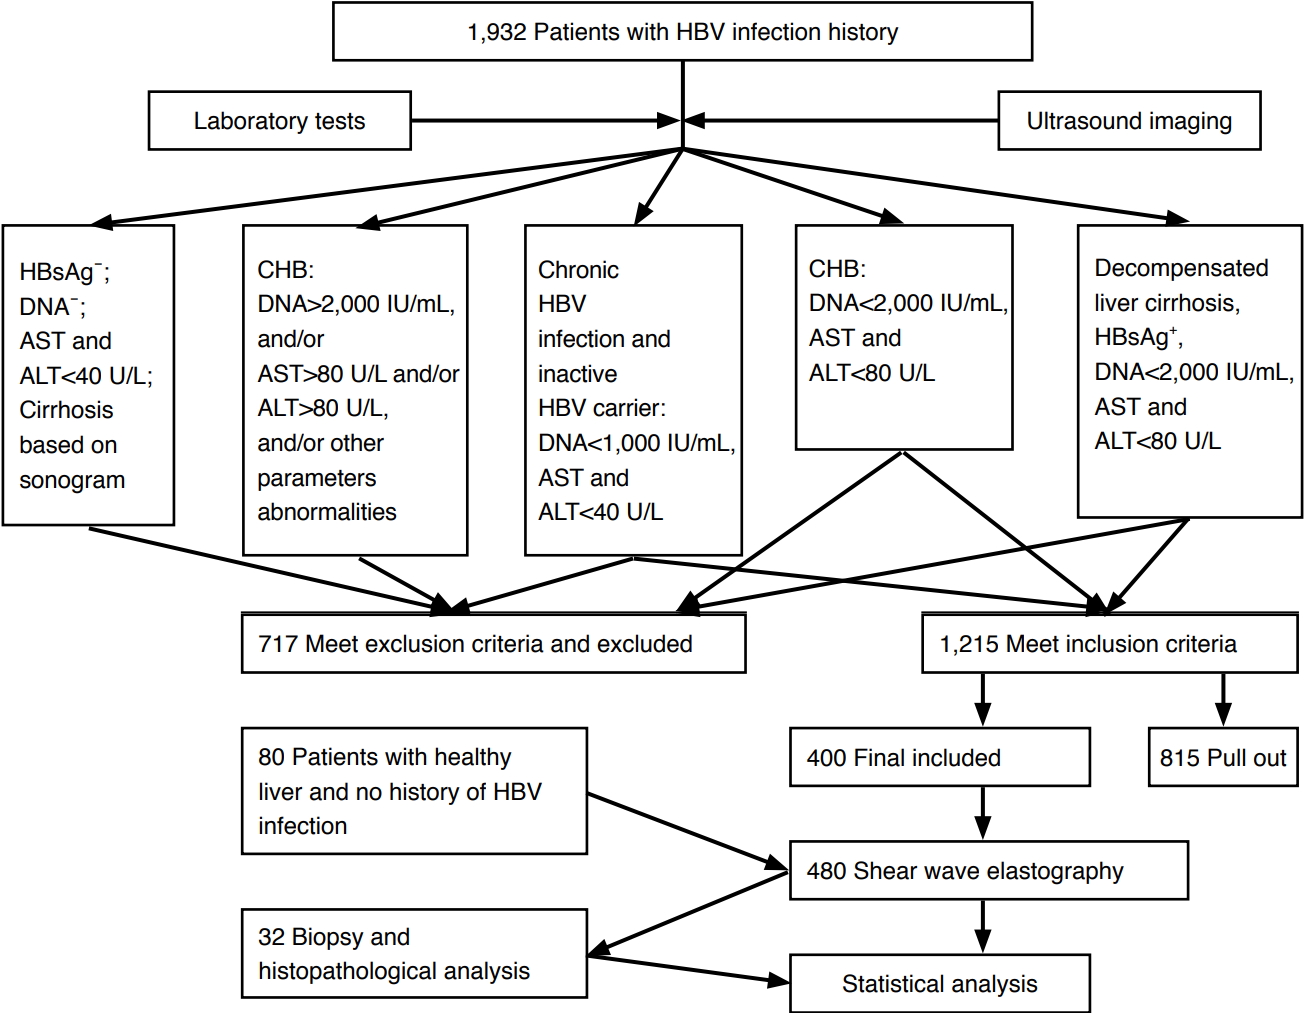
This study received approval from our institutional ethics committee, and informed consent was obtained from patients. Between January 2014 and September 2018, 1932 patients with a history of inactive HBV carrier status, CHB, or hepatitis B-related cirrhosis referred to our tertiary hospital for follow-up and US evaluation of the liver were prospectively recruited (patients referred several times were counted as a single participant). Fig. 1 presents a flowchart of sample selection. Because CHB arises from HBV infection in the normal liver, and further evolves to liver fibrosis or cirrhosis, the liver stiffness of CHB patients may be different from that of healthy people, inactive HBV carriers, and patients with decompensated cirrhosis. Therefore, to conduct an integrated study, we compared the liver stiffness of CHB patients with that of patients with different pathologies as controls (to determine lower and upper limit parameters of liver stiffness). Patients with decompensated cirrhosis could be diagnosed through clinical data (including laboratory tests), but patients with compensated cirrhosis could not be diagnosed accurately in the absence of biopsy and histopathology findings; therefore, patients with compensated cirrhosis were excluded. The exclusion criteria were patients with obesity (body mass index >30 kg/m2) (n=7), marked fatty liver (n=10), pregnancy (n=3), cholestasis (n=2), splenectomy (n=2), diabetes mellitus (n=1), liver tumors (n=3), liver nodular lesions (diameter >7 mm, with a space-occupying effect) (n=81), liver congestion (n=1), mitral stenosis (n=1), heart failure (n=1), severe chronic obstructive pulmonary disease (n=2), renal failure (n=1), compensated liver cirrhosis based on US criteria and biochemical tests (n=227) [20]; patients without comprehensive laboratory tests results for the evaluation of the liver (n=238), HBV DNA>2,000 IU/mL, alanine transaminase (ALT) levels>60 U/L (>40 U/L for inactive HBV carriers); and patients who did not agree to undergo P-SWE evaluation (n=37). The inclusion criteria were referral according to the American Association for the Study of Liver Diseases guideline for the diagnosis of liver disease [1], a history of hepatitis B infection, inactive HBV, or CHB for at least 3 years, and regular follow-up since diagnosis and all inactive HBV carriers and CHB patients were inactive in recent 3 years. The diagnosis of decompensated cirrhosis was based on the presence of previous clinical data indicating a Child-Pugh class of B and C. The study population was selected consecutively from 1,215 patients who met the inclusion criteria, including 100 CHB patients without patchy echogenicity of the liver and 100 CHB patients with patchy echogenicity of the liver. Among the CHB patients (with and without patchy echogenicity of the liver), 32 consecutive patients underwent percutaneous liver biopsy. One hundred inactive HBV carriers without abnormal echogenicity of the liver (HBV DNA<1,000 IU/ mL, ALT<40 U/L) and 100 patients with decompensated liver cirrhosis were selected as control groups. Eighty participants with a healthy liver who had been hospitalized for various operations not involving the liver and did not show abnormalities on laboratory tests were recruited as a blank control group. For all patients and healthy participants, anthropometric tests were performed, including determinations of body weight, height, and body mass index. Biochemical tests of ALT, aspartate aminotransferase, γ -glutamyltransferase, alkaline phosphatase, total bilirubin, and serum albumin levels, platelet count, and prothrombin time were performed within 7 days of the US examination. The baseline demographic and clinical characteristics of the healthy participants and patients are listed in Table 1.
Images Acquisition
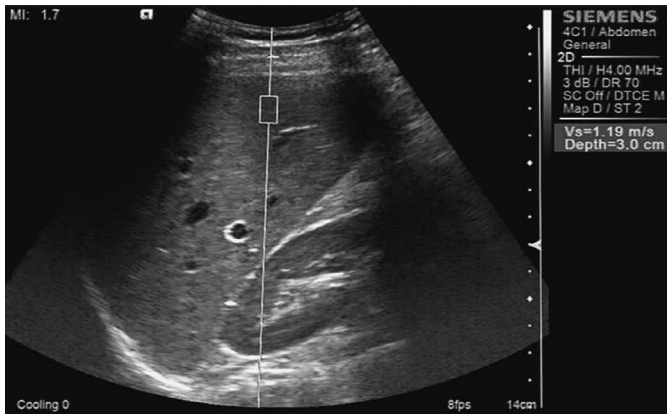
A Siemens Acuson S2000 ultrasound system (Siemens Healthcare, Ultrasound Business Unit, Mountain View, CA, USA) equipped with a curvilinear transducer (4C1, 2-4 MHz, mean push pulse, 2.67 MHz), the Virtual Touch quantification software package (version 2.0), and a 14 L5 linear transducer (6-14 MHz) was used to acquire US images and SWVs. A radiologist specializing in US (S.W.) with 17 years of US experience and 2 years of ARFI P-SWE experience (as of 2014) who was blinded to the clinical data performed US and P-SWE. Each US examination was first performed using the conventional B-mode. The linear transducer was used to assess the liver surface and superficial parenchyma. After the US examination of the liver parenchyma, blood vessels, and color Doppler flow imaging, P-SWE was performed. The SWV measurements were made by the same operator. P-SWE was performed with the patient in the supine position and the right arm at maximal abduction. SWV measurements of the liver were made at the S5 and S6 segments of the right liver lobe, with a depth of 1-3 cm under the liver capsule. During the procedure, patients were instructed to suspend breathing, and the acoustic beam was directed perpendicularly to the liver parenchyma free of large vessels via the intercostal space (Fig. 2). A rectangular region of interest (ROI) was set with fixed dimensions of 1.0 cm×0.5 cm with the convex transducer (4C1) when performing SWV. An adequate amount of gel was placed onto the skin overlying the liver, the transducer was placed gently onto the gel without compression, and the SWV was measured in several different ROIs for each patient. Ten valid measurements were obtained at four different regions of the right lobe for each patient, and we followed the guideline that at least 60% of the measurements should be "good"; if not, a value should not be reported [21]. A "good" measurement was defined as one where a numerical result was obtained, not an "x.xx." The interquartile range (IQR), also called the "middle 50," is a measure of the statistical dispersion defined as the difference between the upper and lower quartiles. An IQR/ median value of less than 0.30 suggests that a data set is good [21]. SWV failure was defined as a success rate of 60% or less or an IQR of 30% or more of the entire range. The median SWV was expressed in meters per second (m/sec). The mean value of all the acquisitions was calculated as the SWV result.
US, color Doppler flow imaging, and P-SWE images of the liver surface, liver parenchyma, hepatic veins, portal vein, patent paraumbilical vein (if present), and the spleen were saved in the picture archiving and communications system.
Image Interpretation
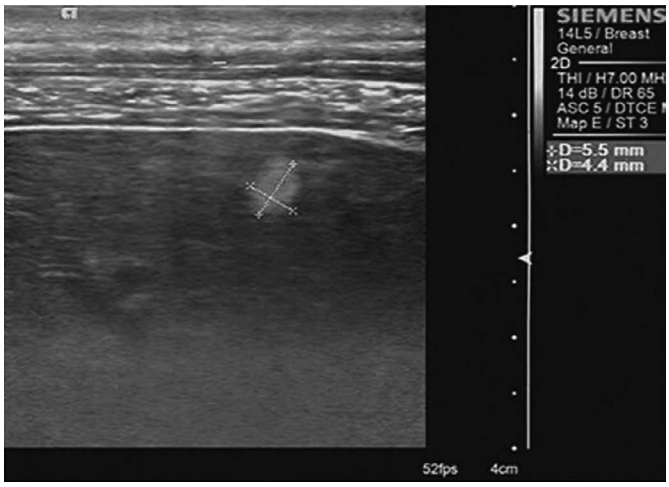
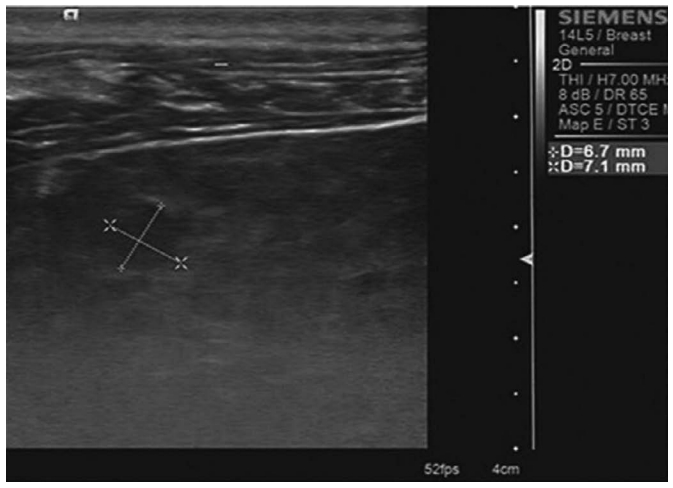
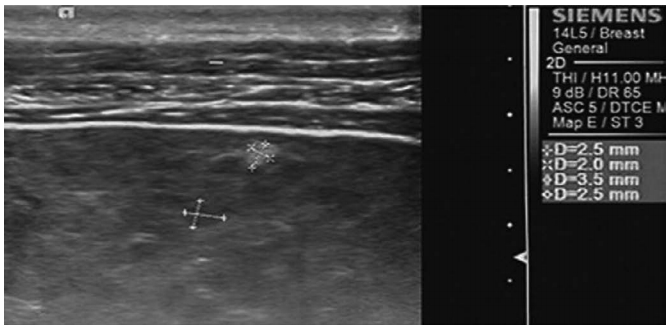
Taking normal liver and spleen parenchyma as reference areas of homogeneous moderate (not fine or coarse) parenchyma, the parenchymal texture of the participants with a healthy liver and patients with CHB was categorized as homogeneous moderate parenchyma, heterogeneous coarse liver parenchyma (Fig. 3), liver parenchyma without patchy echogenicity, and liver parenchyma with scattered patchy echogenicity (Figs. 4-6).
Liver Histologic Assessment
A US-guided percutaneous liver biopsy was performed within 3 days following P-SWE and US examination using a 16-gauge Magnum needle (MG1522/BARD Magnum, C.R. Bard Inc., Murray Hill, NJ, USA), and the biopsy sites were predominantly in parenchymal areas of the right lobe of the liver with scattered patchy echogenicity, and in other places in a few cases. The biopsy specimens (15-22 mm long) were fixed in formalin and embedded in paraffin.
All biopsy specimens were analyzed by two experienced liver pathologists, who were blinded to the results of P-SWE and US, but not to the clinical and biochemical data of the patient. Liver fibrosis was evaluated using the METAVIR scoring system, as follows: score of F0, no fibrosis; F1, portal fibrosis without septa; F2, portal fibrosis and few septa; F3, numerous septa without cirrhosis; and F4, cirrhosis. Significant fibrosis was defined as a score of F2 or greater [22]. Hepatic steatosis was defined as at least 30% of hepatocytes containing lipid droplets.
Statistical Analysis
When the quantitative variables were normally distributed, the results were expressed as mean values and standard deviations; otherwise, medians and IQR (25th-75th percentile) were reported. Qualitative variables were summarized as counts and percentages. The fibrosis score (METAVIR) of CHB patients with and without patchy echogenicity was compared using the chi-square test. The SWVs of the P-SWE results were not normally distributed across different groups and different fibrosis stages; therefore, the Wilcoxon rank-sum test was used to test the equality of the median SWV measurements. The level of significance was determined using a 2-sided test with an α level of 0.05. SPSS version 20 (IBM Corp., Armonk, NY, USA) was used for all statistical analyses.
Results
The median and maximum SWV values of patients with a normal liver, inactive HBV carriers, CHB patients with and without patchy echogenicity, and patients with decompensated hepatic cirrhosis were 1.07 m/sec and 1.26 m/sec, 1.08 m/sec and 1.41 m/sec, 1.16 m/sec and 1.46 m/sec, 1.16 m/sec and 1.45 m/sec, and 2.02 m/ sec and 4.17 m/sec, respectively. There was no significant difference between patients with a normal liver and inactive HBV carriers (P=0.195), or between CHB patients with patchy echogenicity and those without patchy echogenicity (P=0.354). However, there were significant differences between all other groups (all P<0.001) (Table 2). Among the CHB patients with and without patchy echogenicity who underwent biopsy, the distribution of fibrosis scores (METAVIR: F0, F1, F2, F3, and F4) was (0, 6, 7, 3, and 3) and (0, 4, 5, 3, and 2), respectively. There was no significant difference in SWV among CHB patients according to fibrosis stage (all P>0.99). A comparison of SWVs between patients with CHB with and without patchy echogenicity did not show a significant difference (P=0.565). A comparison of SWVs between CHB patients with and without patchy echogenicity according to METAVIR fibrosis stage (F0-F4) showed no significant differences (P>0.05). However, a comparison of SWVs between CHB patients (with and without patchy echogenicity) between different fibrosis stages showed a mixed pattern of statistical significance: SWV of F1 vs. F2, P=0.063; F2 vs. F3, P<0.001; F3 vs. F4, P=0.636; and F1 and F2 vs. F3 and F4, P<0.001 (Table 3). The pathologic results showed that 1 CHB patient with fibrosis stage F2 had hepatic steatosis.
Discussion
The pathophysiology of hepatitis B-related cirrhosis is a diffuse process, characterized by fibrosis and the conversion of normal liver architecture into structurally abnormal nodules [2]. Liver fibrosis is defined as an abnormal increase in collagen deposition and other components of the extracellular matrix in response to chronic injury [2].
Changes in liver stiffness are an important characteristic of pathological changes in the liver [12,21]. In this study, the SWVs of CHB patients with and without patchy echogenicity were significantly higher than those of patients with a normal liver and inactive HBV carriers, and lower than that of patients with decompensated cirrhosis. This finding indicates that patchy echogenicity is significantly associated with hepatic pathological progression, and the more severe the chronic inflammation and liver damage, the stiffer the liver. However, the SWVs and fibrosis stages did not show significant differences between CHB patents with patchy echogenicity and those without patchy echogenicity. This finding indicates that the degree of liver stiffness was minimally associated with the absence or presence of patchy echogenicity of the liver in patients undergoing similar pathological processes. In this study, the liver stiffness, as measured by the median SWV, ranged from 1.07 m/sec in patients with a normal liver to 2.02 m/ sec in patients with decompensated cirrhosis. Among CHB patients with and without patchy echogenicity, the patients in each fibrosis stage had different SWV values; there were significant differences for F2 versus F3 and F1 and F2 versus F3 and F4, but there were no significant differences for F1 versus F2 and F3 versus F4. These results indicate that the median liver stiffness generally increased with the severity of fibrosis (F0-F4), but between immediately adjacent stages there were no significant differences, except for F2 versus F3. This observation suggests that SWV measurements cannot differentiate fine differences between different fibrosis stages, which is similar to the results presented by Jain et al. [23], but is inconsistent with the study by Zheng et al. [5], who found patients in each fibrosis stage to have significantly higher median liver stiffness than those with less fibrosis, as well as similar findings reported by Ozkan et al. [12] and Tsukano et al. [24]. The SWV of the liver showed no significant difference between patients with a normal liver and inactive HBV carriers, suggesting that if inactive HBV carriers do not suffer continuous or repeated active inflammation, their livers are likely to generate slight stiffness (with minimal to no fibrosis). This suggests that regular follow-up is important for inactive HBV carriers, and that if levels of HBV DNA, ALT, and related parameters remain within the normal reference range, the likelihood of progression to fibrosis may be very low.
In this study, the median, interquartile, mean, and upper and lower limits of the SWV of normal livers were found to be 1.07 m/ sec, 0.97-1.16 m/sec, and 0.85-1.26 m/sec, respectively; these values are similar to those reported by Liao et al. [25], who found that the 95% confidence intervals of the median and mean SWV of normal livers measured at S5/8 were 0.81-1.27 and 0.82-1.27 m/sec, respectively. However, our findings are inconsistent with the result of Hu et al. [26] that the mean SWV of normal liver was 1.31±0.25 m/sec. These discrepancies suggest that measurement variation and other factors may affect measured SWV values [14,25].
In this study, only 16.7% (2 of 12) of patients with liver patchy echogenicity had cirrhosis (F4), which did not correspond to a significant difference from the proportion of patients without liver patchy echogenicity who had cirrhosis (11.1%, 1 of 9); this observation shows that the presence of patchy liver echogenicity in patients with CHB is minimally related to the diagnosis of cirrhosis. Meanwhile, the median SWV of patients with biopsy-confirmed cirrhosis was found to be lower than that of patients with decompensated cirrhosis (1.39 m/sec vs. 2.02 m/sec), indicating that different stages of liver cirrhosis are associated with different levels of liver stiffness. Stiffness of the liver, which is thought to be mainly caused by fibrosis, could be influenced by patient-dependent factors, including liver inflammation, liver congestion, and biliary obstruction [21,23]; therefore, we excluded patients with certain diseases that could have affect the accuracy of SWV measurements.
Unlike on US, patchy echogenicity of the liver is usually invisible on CT and/or MRI (unenhanced and contrast-enhanced), in contrast to liver nodules, which can be detected by CT, MRI, and US. Although Buadu and Meyer [9] reported that liver focal echogenic lesions undetectable by CT and/or MRI were nodules, we have a different point of view on this issue. We believe that patchy echogenicity of the liver may be the residue of mild liver architectural damage or minimal regeneration, but the degree of architectural damage minimally, if at all, implicates the formation of bridging fibrous septa, and there is no diffusive disruption in the architecture of the entire liver (loss of the normal central-portal relationship). The hyperechoic patches may be the result of focal fat deposition on the sites of liver damage, or may be due to other causes.
Our study results show that SWV measurements cannot differentiate CHB patients without patchy echogenicity of the liver from CHB patients with patchy echogenicity of the liver. Although SWV measurements can help differentiate CHB patients (with or without patchy echogenicity of the liver) from patients with decompensated liver cirrhosis in general, the SWV of the liver does show overlap between CHB and decompensated liver cirrhosis, which limits the P-SWE value, as addressed by Ozkan et al. [12].
We did not include liver cirrhosis in the sample collection (excluded based on US criteria and biochemical tests, as addressed in the section describing the study population), but the biopsy results showed there were five patients with early-stage cirrhosis (F4) (15.6%, 5 of 32), which indicates that evaluating CHB patients with or without patchy echogenicity based on the US criteria of liver cirrhosis and biochemical tests cannot rule out all cases liver cirrhosis, as also revealed by the study of Gobel et al. [27].
Our study had some limitations. The sample size of biopsied patients was small, which limited the power of this study to detect differences between fibrosis stages. The accuracy of using liver biopsies as the reference standard is limited by sampling issues, inadequate specimens, and the subjectivity of diagnosis. The other participants were predominantly assessed by clinical and laboratory tests, rather than histopathological evidence, which might compromise the overall accuracy.
In conclusion, the presence or absence of patchy echogenicity of the liver in patients with CHB revealed by high-frequency US does not indicate a higher degree of liver stiffness. In the future, we intend to further investigate whether there is a relationship between the presence of patchy echogenicity of the liver and liver stiffness (fibrosis) by performing high-frequency US, P-SWE, and 2-dimensional shear wave elastography, with validation by biopsy and histopathology.

 Download Citation
 PDF Links
 PubReader
 ePub Link
 Full text via DOI
 Full text via PMC


