

 Print
Print facebook
 twitter
 Linkedin
 google+

Introduction
Liver fibrosis is the final common pathway of most chronic liver diseases that progress to cirrhosis and hepatocellular carcinoma [1,2]. Staging the severity of liver fibrosis is central to treatment planning and disease prognosis [3,4]. Therefore, it is important to accurately assess the degree of fibrosis in the management of patients with chronic hepatitis. The current gold standard for the evaluation of liver fibrosis is histopathological examination of biopsy samples. However, liver biopsy has several important limitations, including invasiveness and sampling error; thus, there is a need for non-invasive methods that accurately assess the state of the entire liver [5]. Accordingly, recent studies have investigated noninvasive measurement methods using blood tests [6,7] or imaging techniques such as ultrasound (US)-based elastography or magnetic resonance (MR) elastography [8-10]. Owing to previous studies that reported successful fibrosis staging using MR elastography, it is now widely accepted as a useful tool [11]; however, it is expensive and not widely accessible.
US-based elastography is non-invasive, can provide gray-scale images of the liver, has no radiation hazard, and can quantitatively evaluate the severity of fibrosis, unlike conventional US, which often relies on subjective judgement. US-based elastographic methods are divided into strain elastography and shear-wave elastography (SWE) techniques [12,13]. The latter category includes transient elastography (TE), point SWE (pSWE), and real-time 2-dimensional (2D) SWE (2D-SWE). Of these techniques, TE (Fibroscan, Echosense, Paris, France) is the most widely used and has been validated in several meta-analyses [14,15]. In addition, several meta-analyses have reported good diagnostic accuracy and reliability for pSWE [16,17]. However, pSWE measures only a fixed area (approximately 5 mm×10 mm) without displaying a color image in a region of interest (ROI), which can result in low spatial resolution and neglect of inhomogeneous liver fibrosis, similar to TE [18]. In contrast, more recently developed 2D-SWE techniques enable real-time measurements of liver stiffness in a larger ROI, resulting in a significantly larger sampling volume than can be obtained using TE or pSWE. To date, several studies have reported that the 2D-SWE devices made by several manufacturers also provide good diagnostic accuracy for liver fibrosis [19-22].
S-Shearwave Imaging (Samsung Medison Co., Ltd., Seoul, Korea) is a real-time, 2D-SWE technique with a large ROI (3 cm×4 cm) based on an acoustic radiation force impulse (ARFI) push method. Although it has been introduced into clinical practice, to date, no studies have evaluated the repeatability of this new 2D-SWE technique for assessments of fibrosis, which is one of the most important parameters in the longitudinal follow-up of patients with chronic liver disease and/or the evaluation of treatment response [4]. Considering that patients with chronic liver disease undergo screening US at intervals of 3 to 6 months, SWE can be broadly used to evaluate liver fibrosis, or can be used as an adjunct examination to conventional liver US examinations, but only if there is little variation among different operators and US systems.
The purpose of this prospective study, therefore, was to evaluate the intra- and inter-observer repeatability of S-Shearwave Imaging in liver stiffness measurements (LSMs) in patients with chronic liver disease, and to compare the shear-wave speed (SWS) obtained using 2D-SWE with that obtained using pSWE (Virtual Touch Quantification [VTQ], Siemens Healthcare, Erlangen, Germany).
Materials and Methods
This prospective study was approved by our institutional review board and informed consent was obtained from all patients.
Patients
Fifty-six patients who met the following eligibility criteria were enrolled from April to July 2018: (1) diagnosed with chronic liver disease based on clinical findings or laboratory tests, including chronic hepatitis B or C, alcoholic liver disease, or nonalcoholic fatty liver disease; (2) >18 years of age; and (3) scheduled to undergo a liver US examination at our radiology department. Patients who were not able to hold their breath for >3 seconds during the US examination (n=2) and those who had undergone right hepatectomy (n=1) (according to the European Federation of Societies for Ultrasound in Medicine and Biology guidelines, which recommend avoiding LSM in the left liver lobe [12]) were excluded. Fifty-three patients were randomly allocated to one of two groups: group 1 for intra-observer repeatability (n=33) or group 2 for inter-observer repeatability (n=20) (Table 1). Demographics of patients including sex, age, and body mass index (BMI) were recorded on the basis of their electronic medical records.
Gray-Scale Imaging and LSMs
Patients underwent gray-scale imaging, S-Shearwave Imaging, and pSWE on the same day. Gray-scale US and two sessions of S-Shearwave Imaging were performed using a clinical US system (RS85, Samsung Medison Co., Ltd.) and a CA 1-7A convex probe (frequency range, 1-7 MHz). Thereafter, pSWE was performed using the Siemens Acuson S2000 Virtual Touch US system (Siemens Healthcare) equipped with a convex probe. All patients fasted for at least 6 hours before the examination, and were positioned supine with the right arm maximally abducted above the head to stretch the intercostal muscles. In group 1, two sessions of S-Shearwave Imaging and one session of pSWE were performed by one board-certified radiologist (J.M.L., with 20 years' experience in abdominal imaging). In order to evaluate intra-observer repeatability, the radiologist performed two sessions of S-Shearwave Imaging measurements within an 1-hour interval on each patient, with posture changes between the examinations. In each patient in group 2, one session of S-Shearwave Imaging and one session of pSWE were performed by the same radiologist as in group 1, and a second session of S-Shearwave Imaging was performed by the other board-certified radiologist (J.Y., with 5 years' experience).
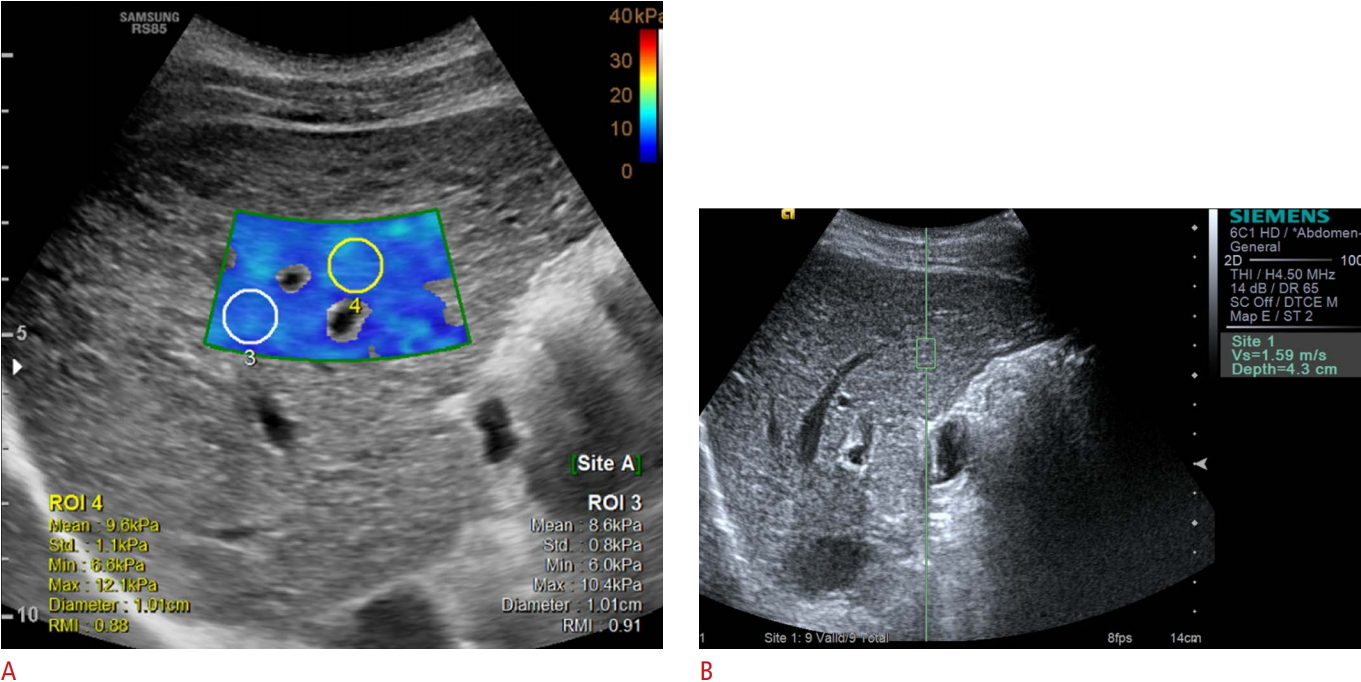
During gray-scale imaging, the radiologist decided where to measure liver stiffness, avoiding focal liver lesions and areas of hepatic vasculature. Each session of pSWE and S-Shearwave Imaging consisted of 10 measurements recorded at an interval of 2-5 minutes, and a positional change was required between sessions. A 2D-SWE map was obtained by placing a 2×3 cm2 sample box overlaid on a gray-scale image in the right lobe of the liver via an intercostal approach while patients held their breath (Fig. 1). When the radiologist placed 2-4 circular ROIs (1 cm in diameter) in the sample box, the liver stiffness (kPa) was automatically displayed, along with the reliability measurement index (RMI). The RMI is a performance index that is calculated as the weighted sum of the residual of the wave equation and the magnitude of the shear wave [23]. According to the device manufacturer’s instructions, the operators attempted to obtain 10 measurements with an RMI>0.4. After obtaining 10 measurements per session, the median and interquartile range (IQR [the difference between the 75th and 25th percentiles]) divided by the median liver stiffness (kPa) and SWS (m/sec) each were calculated and shown in a table. It took approximately 5-7 seconds to obtain 2-4 measurements in each sample box. The median liver stiffness values in kPa and the IQR/median ratio of the 10 measurements for each session were used for analysis. However, to evaluate the agreement between LS measurements using VTQ and S-Shearwave Imaging, the median values of SWS of both techniques were compared.
To assess the applicability of 2D-SWE, the technical success rate and reliable measurement rate were evaluated. Technical failure was defined as failure to acquire a color map in >50% of the sampling area for all acquisitions [24]. A reliable measurement was defined as a measurement in which the ratio of the IQR to the median values of the 10 LSMs was <30%. The applicability rate was calculated as the ratio of examinations that demonstrated technical success and reliable measurements. Liver stiffness values with technical failure or unreliable measurements were included only in the assessment of the applicability rate and excluded from the evaluation of intra- and inter-observer repeatability and correlations between the 2D-SWE and pSWE measurements.
Statistical Analysis
The Wilcoxon signed-rank test was used to compare liver stiffness values obtained in the first and second sessions, and using 2D-SWE and pSWE techniques. The intra-observer repeatability (group 1) and inter-observer (group 2) repeatability of 2D-SWE were assessed using intraclass correlation coefficients (ICCs), the Bland-Altman test, and coefficients of variation. ICC estimates and their 95% confidence intervals (CIs) were calculated based on a mean rating, absolute agreement, two-way mixed-effects model. Based on the 95% CI of the ICC estimate, values <0.5, between 0.5 and 0.75, between 0.75 and 0.9, and >0.90 were considered to be indicative of poor, moderate, good, and excellent reliability, respectively. Bland-Altman analysis tested the relationship of the difference between the first and second sessions of 2D-SWE measurements in each group plotted against their mean, showing the mean values of the differences and limits of agreement (LOA) of two series of data. The coefficient of variation of intra-observer and inter-observer repeatability was calculated, which is the standard deviation divided by the mean value. The LSM obtained using 2D-SWE in the first session was compared and correlated with that obtained using pSWE using the paired t test and Pearson correlation coefficient, respectively. All statistical analyses were performed using IBM SPSS version 25.0 (IBM Corp., Armonk, NY, USA) for Windows (Microsoft Corporation, Redmond, WA, USA) and MedCalc version 15.2 (MedCalc Software, Ostend, Belgium; http://www.medcalc.org;2015); P-values of <0.05 were considered indicative of statistical significance.
Results
The Applicability Rate of 2D-SWE and pSWE
Using 2D-SWE, no technical failure in the LSMs was observed in either group 1 or 2. There were 3 patients with unreliable measurements in group 1 (3 of 33 [9.1%]); an unreliable measurement occurred in the first session in one patient, and two patients exhibited unreliable measurement results in the second session. All three patients had a BMI>25 kg/m2. In group 2, no patient exhibited an unreliable measurement result. The applicability rate of 2D-SWE was 90.9% (30 of 33) in group 1 and 100% (20 of 20) in group 2. In the pSWE session, no technical failure occurred, and only one patient in group 2 exhibited an unreliable measurement result. pSWE demonstrated an applicability rate of 100% (33 of 33) in group 1 and 95% (19 of 20) in group 2. No significant differences were found in the applicability rate between the two methods in either group 1 (P=0.242) or 2 (P>0.99).
Intra-observer and Inter-observer Variability of LSM
In group 1, the mean liver stiffness values were 13.2±8.5 kPa (range, 4.5 to 37.0 kPa) in the first session and 13.5±8.8 kPa (range, 4.3 to 38.0 kPa) in the second session. For the intra-observer repeatability of 2D-SWE in group 1, the ICC was 0.997 (95% CI, 0.994 to 0.999), which indicated excellent reliability. According to the Bland-Altman test, the mean difference between the two sessions was -0.2±1.8 kPa. The 95% upper and lower LOAs were 1.5 and -2.0 kPa, respectively (Fig. 2). The coefficient of variation was 6.0% (95% CI, 4.4 to 7.7).
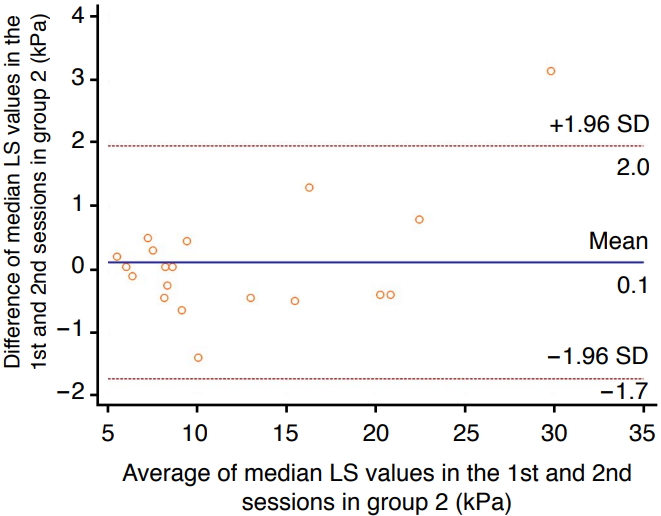
In group 2, the mean liver stiffness values were 12.1±6.9 kPa in the first session and 12.0±6.4 kPa in the second session. For inter-observer repeatability in group 2, the ICC was 0.995 (95% CI, 0.988 to 0.998), which indicated excellent reliability. The Bland-Altman 95% LOA was 0.1±1.8 kPa. The 95% upper and lower LOAs were 2.0 and -1.7 kPa, respectively (Fig. 3). The coefficient of variation was 4.1% (95% CI, 2.7 to 5.5).
Correlation of LSM between pSWE and 2D-SWE
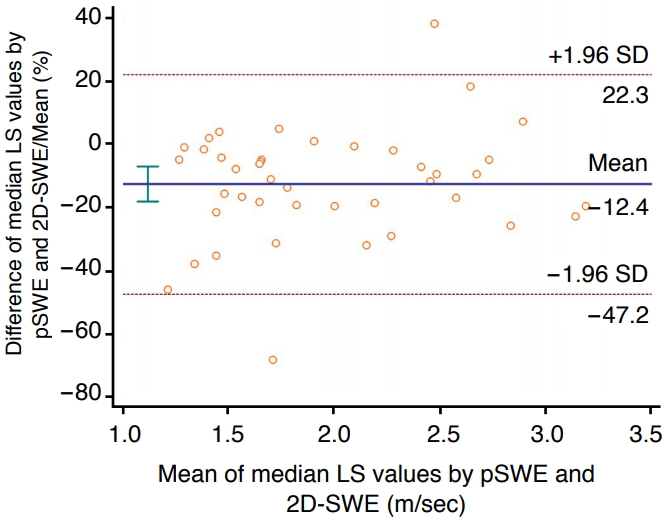
In the 49 patients who had reliable 2D-SWE and pSWE measurements, the liver stiffness values of the two techniques demonstrated a significant correlation (rho=0.836, P<0.001). The mean liver stiffness values obtained using 2D-SWE were significantly different from those obtained using pSWE (2.1±0.6 m/sec vs. 1.9±0.6 m/sec, P<0.001). The Bland-Altman 95% LOA between the LSMs using pSWE and 2D-SWE was 34.7% of the mean (Fig. 4).
Discussion
In our prospective study, both the intra- and inter-observer repeatability of 2D-SWE measurements obtained using the S-Shearwave Imaging technique in patients with chronic liver disease were excellent (ICC, 0.997 and 0.995, respectively). In addition, both 2D-SWE and pSWE demonstrated a high applicability rate, without a significant difference between them. The liver stiffness values for 2D-SWE demonstrated a good correlation with those for VTQ. The main clinical indication for SWE is fibrosis staging of chronic liver disease, with the primary objective of determining the presence or absence of advanced fibrosis [25]. In recent years, SWE has increasingly been used for the evaluation of significant fibrosis, liver cirrhosis, portal hypertension, and response to antiviral treatments [12,26]. In this regard, the high reproducibility of SWE techniques is essential for their clinical use. In our study, the values measured using S-Shearwave Imaging (2D-SWE) were not interchangeable with those measured using VTQ (pSWE). This result is consistent with a previous study involving phantoms by the Ultrasound Shear Wave Speed technical committee of the Radiological Society of North America Quantitative Imaging Biomarker Alliance, in which the differences in measurements between machines and observers varied by as much as 12% [25]. Considering these results, we believe that S-Shearwave Imaging can be widely used for the evaluation of liver fibrosis in patients with chronic liver disease with validated repeatability.
Several studies have investigated the repeatability of 2D-SWE techniques in terms of intra- and inter-observer variability, most of which were performed using supersonic shear imaging (SSI). For SSI, intra-observer repeatability in patients with liver fibrosis was excellent (ICC, 0.90-0.95) [27-29], and the ICCs for inter-observer repeatability ranged from 0.83 to 0.94, which may be inferior to pSWE using VTQ [30,31]. Our study demonstrated higher ICCs for both intra- and inter-observer agreement of S-Shearwave Imaging than those of SSI in published studies, although a direct comparison between S-Shearwave Imaging and SSI was not performed in our study. Furthermore, while a previous study suggested that operator experience may play a role in the reliability of measurements, our results yielded excellent inter-observer agreement between two radiologists with different levels of experience. These discrepancies may be explained by the RMI implemented in S-Shearwave Imaging, which enabled the operators in our study to filter out unreliable measurements, thereby improving the performance of SWE. Our result is concordant with a previous study that reported a strong correlation between high RMI values and reproducible measurements [23]. However, although the ICC was high, the Bland-Altman analysis demonstrated that the mean differences in groups 1 and 2 (Bland-Altman 95% LOAs) were -0.2±1.8 kPa and 0.1±1.8 kPa, respectively. Therefore, a 1-2 kPa discrepancy in LSMs by the same operator or a different operator could occur, but considering that a cutoff value of >7.1 kPa for diagnosing significant fibrosis (F≥2) has been proposed [20], discrepancies in this range would be clinically acceptable.
A few studies have focused on direct comparisons of the diagnostic capabilities of different SWE techniques from various manufacturers, most of which have suggested that different SWE techniques should not be used interchangeably [30,32]. To address the issue of direct comparisons of SWS measurements in the liver, the Radiological Society of North America Quantitative Imaging Biomarker Alliance conducted a phantom study using various commercial SWE systems and found statistically significant differences in SWS estimates among systems and according to depth into the phantom [33]. That phantom study concluded that there are several sources of bias and variance that can be addressed to improve the consistency of measurements [33]. The variability of SWS measurements among different SWE technologies may occur due to shear-wave vibration frequency and bandwidth, as well as the software used to calculate relative shear-wave arrival time and speed [12]. Our results in human patients are in good agreement with the aforementioned studies in that a significant difference was found between the SWS measurements obtained using 2D-SWE and pSWE. Further studies to identify the source(s) of errors to enable the interchangeable use of different SWE techniques in clinical practice are warranted.
Both American and European guidelines for the management of patients with hepatitis C virus infection have recommended evaluating the degree of hepatic fibrosis to assess the urgency of treatment and, according to a recent European guideline, noninvasive methods should be used instead of liver biopsy to assess liver disease severity before therapy [34,35]. Moreover, while TE has been accepted as a noninvasive test for the assessment of liver fibrosis in previous guidelines, recent European recommendations included ARFI (VTQ) and Aixplorer (SuperSonic Imagine, Aix-en-Provence, France) as non-invasive markers and suggested cut-offs for each SWE system for the prediction of liver fibrosis stages [35]. Although 2D-SWE has only been recently validated, and only a limited number of studies have investigated the diagnostic capability of 2D-SWE techniques other than SSI, it has several advantages over well-established techniques such as TE or pSWE. First, 2D-SWI is derived from the characteristic broadband (60-600-Hz) pulse using ARFI [36], while TE applies a 50-Hz push from an external vibrator [37]. A previous study reported that stiffness imaging using a broadband pulse provided a more discriminant parameter for fibrosis evaluation [38]. Second, both pSWE and 2D-SWE can be performed with conventional gray-scale US, which demonstrates hepatic parenchymal echogenicity, as well as focal liver lesions. Third, 2D-SWE includes a larger sample volume of liver parenchyma and displays color-coded elasticity maps, providing more opportunities for valid measurements compared with pSWE.
Our study had several limitations, the first of which was that intra- and inter-observer repeatability were evaluated in different patients. Second, there was a relatively short interval between the two 2D-SWE sessions, and patients with a relatively small body habitus (mean BMI<25 kg/m2 in both groups) were enrolled, which may have resulted in an overestimation of repeatability compared with repeatability on different days or in obese patients. Third, the diagnostic performance of S-Shearwave Imaging could not be assessed because biopsies were not performed. However, our study aimed to evaluate the repeatability—rather than the diagnostic performance—of 2D-SWE for LSM. Further studies investigating diagnostic performance using pathological results as the reference standard are, therefore, warranted.
In conclusion, S-Shearwave Imaging demonstrated excellent intra- and inter-observer repeatability. Although a significant correlation was found in LSMs between 2D-SWE and pSWE, liver stiffness values obtained using 2D-SWE were significantly higher than those obtained using pSWE, suggesting that these techniques should not be used interchangeably.

 Download Citation
 PDF Links
 PubReader
 ePub Link
 Full text via DOI
 Full text via PMC


