

 Print
Print facebook
 twitter
 Linkedin
 google+

Introduction
Hepatic steatosis is the key histologic feature of nonalcoholic fatty liver disease (NAFLD) and is associated with other chronic liver diseases such as alcoholic liver disease, chronic viral hepatitis, and drug-induced liver injury [1]. NAFLD is a growing public health problem worldwide. It can progress to nonalcoholic steatohepatitis, one of the leading indications for liver transplantation [2]. Hepatic steatosis accompanied by chronic viral hepatitis may increase the risk of developing cirrhosis and hepatocellular carcinoma [3]. However, hepatic steatosis can be improved by proper management [4,5]. Therefore, early detection and accurate staging of hepatic steatosis are important for timely management, treatment monitoring, and predicting the prognosis.
Although liver biopsy has been regarded as the gold standard for hepatic steatosis, it has drawbacks such as invasiveness, sampling errors, and inter-reader variability. Hence, a noninvasive diagnostic tool is required. B-mode ultrasonography (US) has been widely used as a primary imaging modality for hepatic steatosis. Conventionally, hepatic steatosis has been subjectively estimated using B-mode US, but it has limitations due to inter-observer variability and poor sensitivity for mild steatosis [6]. The hepatorenal index (HRI), defined as the ratio of liver to kidney echointensities measured on B-mode US, has been developed as a quantitative parameter for evaluating hepatic steatosis, but its use is limited in patients with renal disease or a heterogeneous distribution of steatosis [7]. Magnetic resonance (MR) techniques such as the MR spectroscopy (MRS) and MR imaging (MRI)-determined proton density fat fraction have been extensively validated as an appropriate reference standard [8,9]. However, both MRS and MRI are expensive and not routinely accessible. The controlled attenuation parameter (CAP), a measurement of ultrasonic attenuation vibration obtained in transient elastography (TE), has been recently suggested as an alternative [10]. Although CAP is less accurate than the MRS or MRI-determined proton density fat fraction for diagnosing hepatic steatosis [11], CAP has the advantage of being inexpensive and relatively widely available.
Recently, increasing attention has been paid to quantitative US radiofrequency (RF) data analysis as a promising tool for tissue characterization. As opposed to B-mode images, raw RF data contain frequency-dependent information of the US signal, which provides additional diagnostic value [12,13], and it can be obtained by turning on a specific acquisition mode. Recent studies have demonstrated that some quantitative parameters from the RF data analysis reflecting the backscatter or attenuation of the US beam correlated well with hepatic steatosis grades [14-17]. Additionally, those parameters have been shown to be more accurate than qualitative visual scores on B-mode US to diagnose steatosis grades [15]. However, little is known about the diagnostic performance of RF data-driven parameters for hepatic steatosis and their potential confounding factors.
In this study, we aimed to investigate the diagnostic value of quantitative US parameters from RF data analysis for assessing hepatic steatosis, using CAP-based steatosis grades as the reference standard.
Materials and Methods
Study Population
This prospective study was approved by each participating center, and written informed consent was obtained from all participants. Our study population was a subgroup of a prospective multicenter study that primarily aimed to evaluate the performance of point shear-wave elastography (SWE) for hepatic fibrosis [18] (ClinicalTrials.gov identifier: NCT03047707). In the main study, participants were enrolled from May 2017 to April 2018 and underwent both B-mode US with point SWE and TE. Its inclusion criteria were (1) patients with chronic liver disease or liver cirrhosis, patients scheduled to undergo hepatectomy for liver disease or liver donation, or healthy volunteers; and (2) age Ōēź18 years old. Patients were excluded if they had (1) obstructive cholestasis, (2) high serum aspartate aminotransferase and/or alanine aminotransferase levels (>5 times the upper normal limit) within 3 months, (3) right heart failure or liver congestion, (4) previous liver surgery, or (5) infiltrative liver disease. Among these patients, those who had reliable CAP measurements within a 2-week interval from B-mode US were selected for this study. While four centers participated in the main study, the TE devices at only two centers provided CAP values in addition to liver stiffness measurements (LSMs). Therefore, our study participants were enrolled at either of those two centers (Seoul National University Hospital and Asan Medical Center, Seoul, Korea).
Acquisition of B-Mode US and TE
For each participant, B-mode US and TE were performed by different experienced operators who were blinded to the results of the other study. Before B-mode US or TE, participants were requested to fast for at least 4 hours.
B-mode US imaging with RF data
All B-mode US examinations were performed with a diagnostic US system (RS80A, Samsung Medison, Co. Ltd., Seoul, Korea) using a convex probe (CA1-7A). Using a predefined preset with S-Harmonic mode (pulse inversion+coded harmonic imaging), B-mode images were obtained during a breath-hold with a fixed setting of time-gain compensation, and their RF data were automatically recorded. The scan planes included a right intercostal plane near the level of the hepatic hilum and a right sagittal plane showing both the liver and right kidney. The right intercostal plane was for the RF data analysis, while the right sagittal plane was for the HRI measurement [19].
TE with CAP
Using TE (Fibroscan, Echosens, Paris, France), CAP (in dB/m), and LSM (in kPa) were measured with an M probe according to the manufacturerŌĆÖs recommendations. For each participant, the median of 10 valid measurements was regarded as representative of CAP and LSM, respectively [20]. The values were considered to be reliable when 10 valid measurements were made with an interquartile range (IQR) <40 dB/m for CAP [21] and an IQR/median ratio Ōēż30% for LSM [22].
Image Analysis
Visual scoring, HRI measurements, and RF data analysis were separately performed by abdominal radiologists who were blinded to the other results. To minimize recall bias in radiologists who participated in more than one assessment listed above, the assessments for each patient were separated by at least 4 weeks.
Visual scoring of hepatic steatosis on B-mode US
During the B-mode US examination, the visual score of hepatic steatosis was recorded by the operator (I.J. or J.M.L. for the participants at Seoul National University Hospital and S.Y.K. or J.K.J. for the participants at Asan Medical Center). The visual score of hepatic steatosis was graded as follows: score 0, no steatosis; 1, mild steatosis; 2, moderate steatosis; and 3, severe steatosis) by referring to HamaguchiŌĆÖs scoring system [23], which uses the following US features of hepatic steatosis: bright liver, increased hepatorenal echo contrast, deep attenuation, and vessel blurring.
HRI measurements on B-mode US
The HRI was calculated by analyzing B-mode US images on a picture archiving and communication system by an abdominal radiologist (S.K.J. for the participants at Seoul National University Hospital and S.Y.K. for the participants at Asan Medical Center). A circular region of interest (ROI) was drawn in the liver parenchyma, and another one was drawn in the renal parenchyma at the same depth as the ROI in the liver. The liver ROI should avoid focal lesions, large vessels, and bile ducts, and the kidney ROI should avoid focal lesions, collecting systems, and extra-renal tissues. The average echointensity of the liver ROI was divided by that of the kidney ROI to calculate the HRI [19]. The HRI measurement was defined as a failure when the liver ROI and the kidney ROI could not be placed at the same depth or when an ROI of at least 20 mm2 could not be drawn in the liver or the kidney.
Measurement of quantitative US parameters from RF data analysis
Two quantitative US parameters of the liver parenchyma, including the tissue scatter-distribution imaging parameter (TSI-p) and tissue attenuation imaging parameter (TAI-p), were derived from the RF data. TSI-p indicates the average Nakagami parameters of the ROI, reflecting the local concentration and arrangement of US scatterers [14]. TAI-p indicates the slope of the US center frequency downshift with a depth that can be used to estimate acoustic attenuation [24]. The theoretical background of these two parameters and details on how to create the parametric maps are given in the Supplementary Data 1.
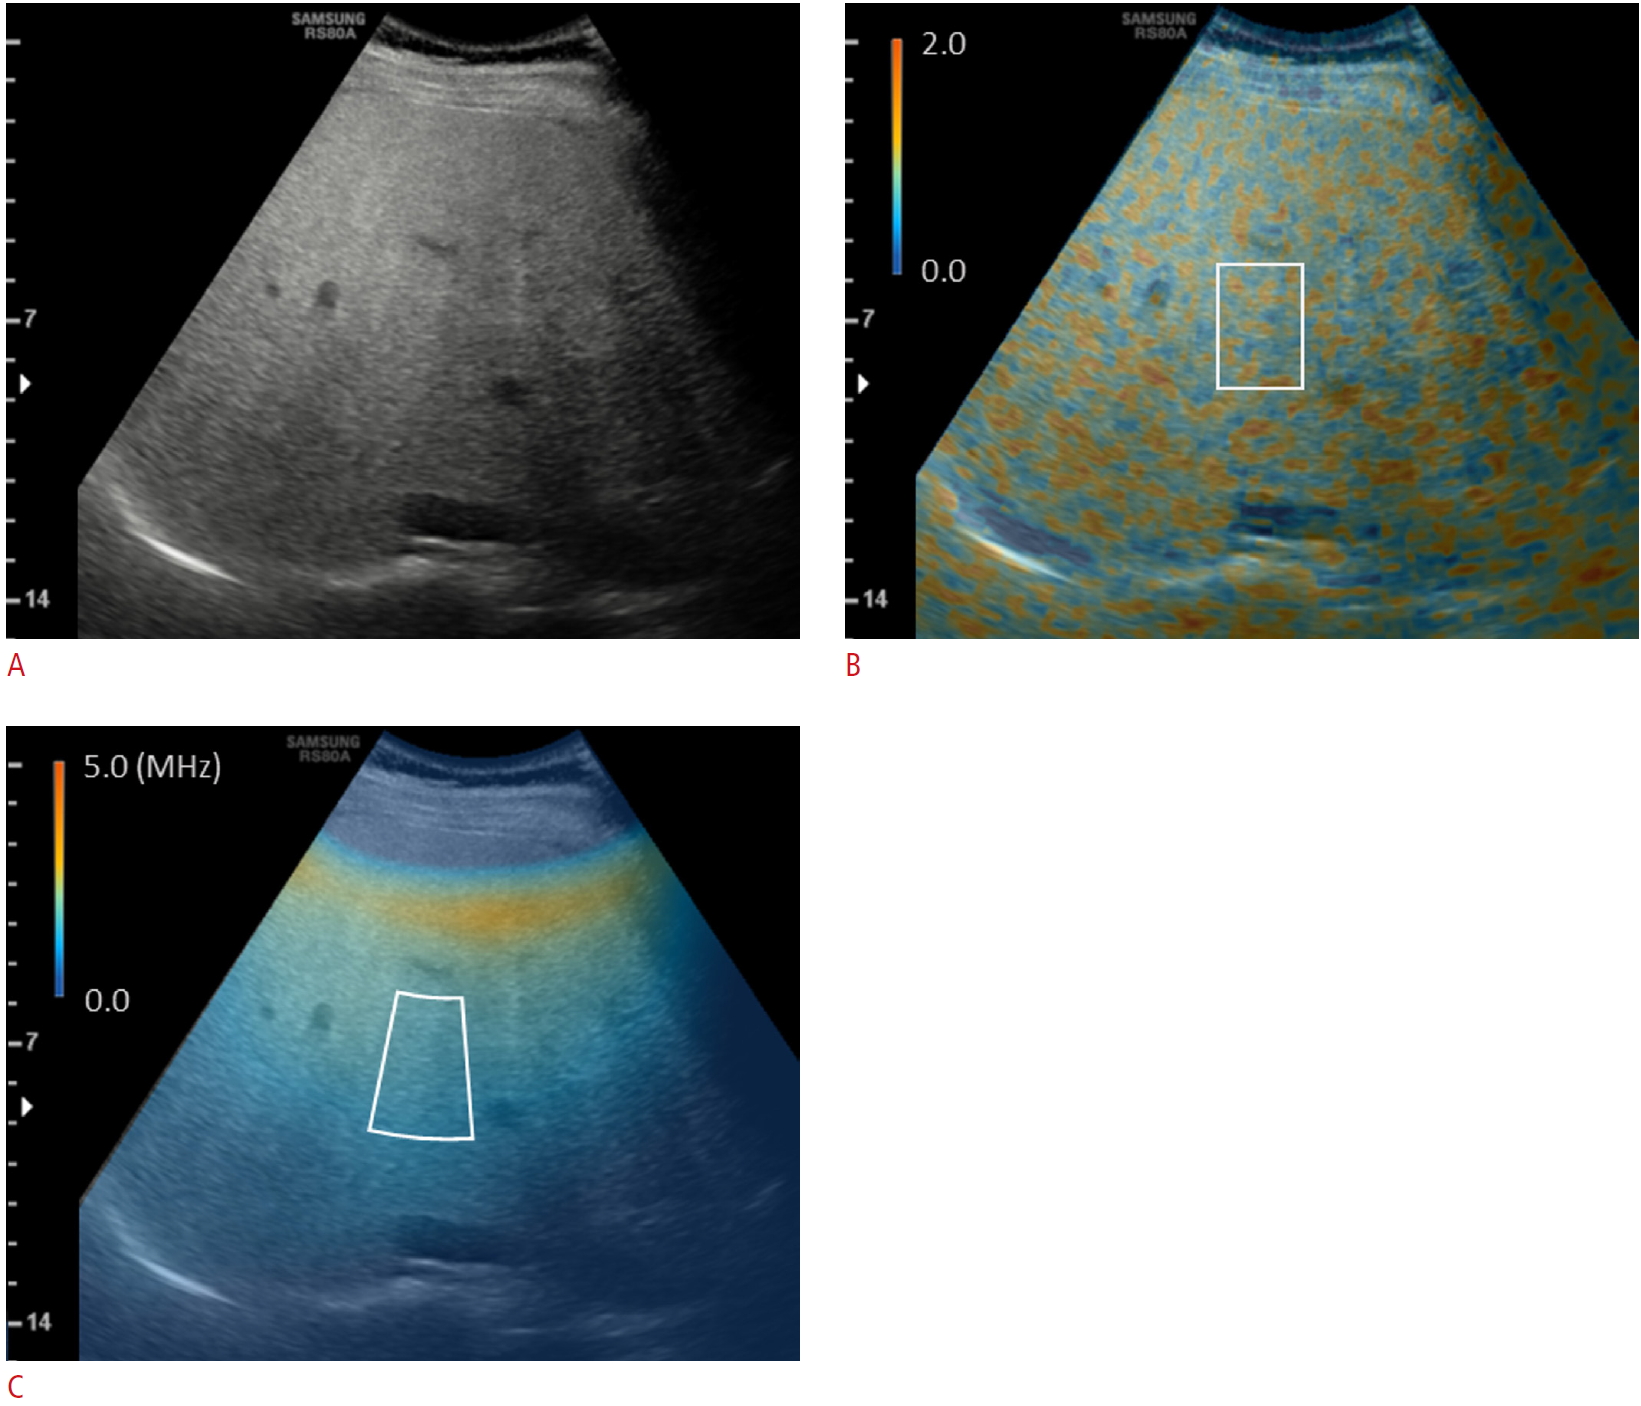
By analyzing RF data using an in-house program developed in MATLAB R2015a (MathWorks, Inc., Natick, MA, USA), color-coded maps of the Nakagami parameters (TSI map) and center frequency (TAI map) were generated on a pixel-by-pixel basis (Fig. 1). With reference to the B-mode image, a rectangular ROI (about 2 cm in width├Ś4 cm in height) in the TSI map and an annulus-sector ROI (about 2 cm in inner arc length├Ś4 cm in side length) in the TAI map were positioned in the liver parenchyma, avoiding large vessels, focal lesions, and reverberation artifacts beneath the liver capsule (Fig. 1), to calculate TSI-p and TAI-p.
Measurements of TSI-p and TAI-p were performed in two separate sessions by one radiologist (S.K.J.) at least 2 weeks apart and in one session by another radiologist (J.P.) to evaluate intra-observer and inter-observer reliability, respectively. The results of the first session of the former radiologist were used as representative values of each participant for the other analysis in this study.
Determination of Hepatic Steatosis Grades and Hepatic Fibrosis Grade
CAP values were used to determine hepatic steatosis grades by applying the reference values suggested in a previous study [20]: 0-250 dB/m for S0 (no steatosis), >250 dB/m for ŌēźS1 (mild steatosis), >299 dB/m for ŌēźS2 (moderate steatosis), and >327 dB/m for S3 (severe steatosis). The LSM values on TE were used to determine hepatic fibrosis grades by applying the cut-offs suggested in a previous study [25]: 0-7.1 kPa for ŌēżF1 (no or mild fibrosis), >7.1 kPa for ŌēźF2 (significant fibrosis), >9.5 kPa for ŌēźF3 (severe fibrosis), and >12.5 kPa for cirrhosis (F4).
Statistical Analysis
The visual scores, HRI, TSI-p, and TAI-p were correlated with CAP-based steatosis grades using Spearman correlation analysis. The Spearman correlation coefficient (Žü) was interpreted as follows: |Žü|>0.5, strong; |Žü|=0.3-0.5, moderate; and |Žü|<0.3, weak correlation [26]. As the Kolmogorov-Smirnov test revealed that the visual scores, HRI, and TAI-p were not normally distributed, the US parameters of different steatosis grades were compared with the Kruskal-Wallis test followed by the Dunn post-hoc test without the assumption of a normal distribution of data. In the Dunn posthoc test, a Bonferroni-adjusted P-value less than 0.017 (0.05/3) was considered to indicate statistical significance, as three pairwise comparisons between adjacent grades were made. The diagnostic performance of US parameters for detecting ŌēźS1, ŌēźS2, and S3 was assessed using nonparametric receiver operating characteristic (ROC) curve analyses. Pairwise comparisons of the areas under the ROC curve (AUCs) between parameters were performed using the z-score, accounting for standard errors in the differences in correlated AUCs estimated by the Delong test. In this pairwise comparison analysis, a Bonferroni-adjusted P-value of less than 0.008 (0.05/6) was considered to indicate statistical significance, as six pairwise comparisons were possible with the four different US parameters. The sensitivity and specificity for detecting ŌēźS1, ŌēźS2, and S3 were calculated based on the visual scores (Ōēź1, Ōēź2, and 3, respectively), HRI (using cut-offs of Ōēź1.05, Ōēź1.25, and Ōēź1.65, respectively [7]), TSI-p, and TAI-p (using cut-offs determined on the ROC curve analysis in this study as the points of maximizing the Youden index), respectively. Furthermore, to assess the potential effect of hepatic fibrosis on the diagnostic performance of TSI-p or TAI-p for hepatic steatosis, their AUCs were compared according to the presence of significant hepatic fibrosis using the method detailed by DeLong et al. [27]. Intra- and inter-observer reliability were assessed using intra-class correlation coefficients (ICCs) and interpreted as follows: Ōēź0.90, excellent; Ōēź0.75 to <0.90, good; Ōēź0.50 to <0.75, moderate; and <0.50, poor reliability [28]. The coefficient of variation (CV), the ratio of the standard deviation to the mean, was also calculated to provide an additional estimation of intra- and inter-observer reliability, with a small CV value indicating more reliable measurements [29]. Univariate and multivariate linear regression analyses were performed to evaluate significant determinants of TSI-p and TAI-p. Statistical analyses were performed using MedCalc 16.4.1 (MedCalc Software, Ostend, Belgium) and SPSS version 25.0 (IBM Corp., Armonk, NY, USA). A P-value of less than 0.05 was considered to indicate statistical significance, except for the aforementioned pairwise comparison tests.
Results
Study Population
Of the 249 participants who were initially enrolled, six participants with unreliable CAP measurements were excluded from the analysis. Therefore, a total of 243 participants (98 at Seoul National University Hospital and 145 at Asan Medical Center; 171 men; age, mean┬▒standard deviation [SD], 55┬▒13 years old; and body mass index [BMI], mean┬▒SD, 25┬▒4 kg/m2) were finally included. PatientsŌĆÖ characteristics are summarized in Table 1. The majority had chronic liver diseases (82.7%, 201 of 243), with the most common cause being chronic hepatitis B (47.7%, 116 of 243). Based on the CAP values, 152, 54, 14, and 23 patients were categorized as having S0, S1, S2, and S3. The number of patients with ŌēźS1, ŌēźS2, and S3 were 91 (37.4%), 37 (15.2%), and 23 (9.5%), respectively. None of the patients showed unreliable LSM results, and 98 patients (40.3%) were categorized as having ŌēźF2 based on TE results. Among the final study population, the HRI measurement failed in five patients (S0, n=3 and S1, n=2). Therefore, the HRI-related analysis was performed in 238 patients.
Correlation of US Parameters with Hepatic Steatosis Grades
All the assessed US parameters showed significant correlations with hepatic steatosis grades (Table 2). The visual score and HRI showed moderate and weak positive correlations with steatosis grades, respectively (Žü=0.352 and Žü=0.264, respectively; P<0.001 for both), while TSI-p and TAI-p showed strong positive and negative correlations, respectively (Žü=0.593 and Žü=-0.617, respectively; P<0.001 for both).
Comparison of US Parameters According to Hepatic Steatosis Grades
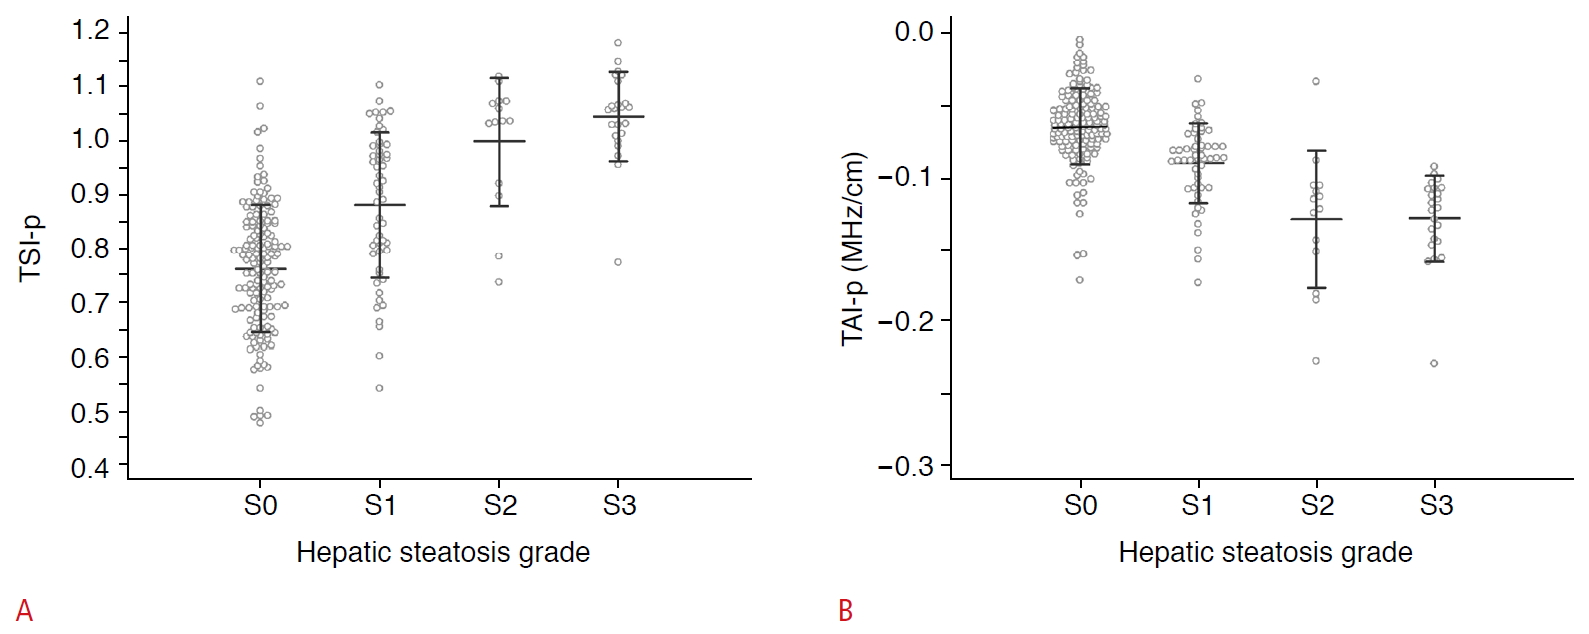
The US parameters according to hepatic steatosis grades are shown in Table 2 and Fig. 2. All the assessed parameters showed significant differences according to steatosis grades (P<0.001 for all) (Table 2). When comparing between S0 and S1, both TSI-p and TAI-p showed significant differences between groups (P<0.001 for both), while neither the visual scores nor HRI did so (P=0.594 and P>0.99, respectively). On the contrary, none of the parameters showed statistically significant differences between S1 and S2 (PŌēź0.114) or between S2 and S3 (P>0.99).
Diagnostic Performance of US Parameters for Hepatic Steatosis Grades
For the prediction of ŌēźS1, ŌēźS2, and S3, TSI-p showed AUCs of 0.827, 0.914, and 0.917, respectively. TAI-p showed AUCs of 0.844, 0.914, and 0.909, respectively (Table 3). Pairwise comparison analyses of the AUCs between US parameters were performed in participants with available values. The visual scores, HRI, TSI-p, and TAI-p (n=238), are described in Supplementary Table 1. Both TSI-p and TAI-p showed significantly higher AUCs than either the visual scores or HRI for diagnosing ŌēźS1 or ŌēźS2 (PŌēż0.003 for all). For the diagnosis of S3, both TSI-p and TAI-p also showed higher AUCs than the visual scores or HRI, with statistical significance (PŌēż0.029 for all). The sensitivity and specificity for ŌēźS1, ŌēźS2, and S3 using the cut-off values for each US parameter are described in Table 3. For detecting ŌēźS1, a TSI-p>0.910 resulted in a sensitivity of 65.9% (60 of 91) and a specificity of 92.8% (141 of 152), while a TAI-pŌēż-0.078 MHz/cm resulted in a sensitivity of 83.5% (76 of 91) and a specificity of 77.6% (118 of 152).
Clinical and Laboratory Determinants of TSI-p and TAI-p
In the univariate linear regression analysis, BMI, TE-based fibrosis grade, and CAP-based steatosis grade were significant factors affecting TSI-p. Additionally, BMI, skin-liver capsule distance measured on B-mode US, alanine aminotransferase levels, and the CAP-based steatosis grade were significant factors affecting TAI-p (Table 4). In the multivariate analysis, the fibrosis grade and steatosis grade were independent determinants for TSI-p, showing negative and positive relationships (P=0.034 and P<0.001), respectively. The steatosis grade was an independent determinant for TAI-p, with a negative relationship (P<0.001) (Table 4).
For ŌēźS1, ŌēźS2, and S3, the AUCs of TSI-p and TAI-p in patients without significant fibrosis were higher than those in patients with significant fibrosis (Supplementary Table 2). However, a statistically significant difference between subgroups was found only in TSI-p for detecting ŌēźS1 (AUC, 0.897 vs. 0.705; P=0.003).
Intra- and Inter-observer Reliability of TSI-p and TAI-p
On the given parametric maps, the intra-observer reliability of TSI-p and TAI-p measurements of the liver parenchyma was excellent, with ICCs of 0.989 and 0.968 and CVs of 2.9% and 13.0%, respectively. The inter-observer reliability of TSI-p and TAI-p was also excellent, with ICCs of 0.944 and 0.945 and CVs of 11.4% and 23.6%, respectively (Supplementary Table 3).
Discussion
Our study of patients with chronic liver diseases showed that TSI-p and TAI-p of the liver parenchyma, which are quantitative US parameters from RF data analysis, were well correlated with CAP-based hepatic steatosis grades and that each of those parameters performed well in diagnosing Ōēźmild (S1), Ōēźmoderate (S2), and severe (S3) steatosis. Moreover, both TSI-p and TAI-p showed significantly higher AUCs than the visual scores or HRI for predicting ŌēźS1 or ŌēźS2. The multivariate linear regression analysis revealed that the hepatic steatosis grade was an independent determinant of both TSI-p and TAI-p and that the hepatic fibrosis grade was also an independent determinant of TSI-p. The measurements of TSI-p and TAI-p showed excellent intra- and inter-observer reliability. These results support the clinical applicability of TSI-p and TAI-p for assessing hepatic steatosis.
In our study, TSI-p and TAI-p showed significant positive and negative correlations with steatosis grade, respectively (Žü=0.593 and Žü=-0.617; P<0.001 for both). These findings can be explained by the interaction of the US beam with liver tissue. If the concentration of fat droplets (the acoustic scatterers) increases in a homogeneous medium such as the liver parenchyma, the US backscattered statistics shift from a pre-Rayleigh to a Rayleigh distribution, which increases TSI-p [14]. Moreover, when the amount of fat droplets increases in the liver, US beam attenuation along the acoustic path becomes more severe, especially for the high-frequency beam components [24]. This supports our findings of a negative correlation between the steatosis grade and TAI-p. Given their strong relationships with the steatosis grade as shown in our study, TSI-p and TAI-p are expected to be useful in diagnosing hepatic steatosis. TSI-p and TAI-p showed good diagnostic performance in our study, with AUCs of 0.827 and 0.844 for ŌēźS1; 0.914 and 0.914 for ŌēźS2; 0.917 and 0.909 for S3, respectively. These results agree with those of previous studies of US backscattering or attenuation-related parameters in NAFLD or other chronic liver diseases (AUCs of 0.84-0.90 for ŌēźS1; 0.89-0.95 for ŌēźS2; and 0.93-0.96 for S3) [30,31].
Early detection of mild hepatic steatosis has clinical implications as it enables timely lifestyle interventions that may prevent or delay the further progression of steatosis and associated comorbidities [32]. In our study, both TSI-p and TAI-p showed significant differences between S0 and S1, while visual scores and HRI did not. Moreover, when applying the cut-offs determined for the ROC curve analysis, TSI-p and TAI-p provided balanced sensitivity and specificity in each (sensitivity, 65.9% and 83.5%, respectively; specificity, 92.8% and 77.6%, respectively). Our results suggest the potential application of RF data-driven parameters as a screening method for hepatic steatosis. However, the cut-off values need to be further validated. Of note, the diagnostic performance of visual scores and HRI for hepatic steatosis in our study was somewhat poorer than has been reported in previous studies [33,34]. This difference could be associated with the characteristics of the study population, as the majority of our study population had chronic liver disease with or without hepatic steatosis, while previous studies [33,34] focused on NAFLD patients.
According to the multivariate linear regression analysis in our study, the hepatic steatosis grade was an independent determinant of both TSI-p and TAI-p, with positive and negative relationships (P=0.034 and P<0.001), respectively, and the hepatic fibrosis grade was an independent determinant of TSI-p, with a negative relationship (P<0.001). However, the hepatic fibrosis grade did not show a significant relationship with TAI-p, even in the univariate analysis. Potential explanations for the relationships between steatosis and TSI-p or TAI-p are discussed above. The inverse relationship of hepatic fibrosis with TSI-p in our study is concordant with previous studies using Nakagami imaging [35,36]. This can be explained as follows: backscattered US signals from normal liver tissues mainly consist of randomly distributed scatterers, conforming to a near-Rayleigh distribution (pre-Rayleigh due to the vessel walls). Contrastingly, those from a cirrhotic liver with more resolvable scatterers (fibrotic structures and nodules) exhibit more of a pre-Rayleigh distribution, resulting in a decrease in the Nakagami parameter, the pixel-wise value of TSI-p [36,37]. Moreover, the diagnostic performance of TSI-p for ŌēźS1 was significantly lower in patients with significant hepatic fibrosis than in those without significant fibrosis in our study. However, conflicting results have been reported on the effect of hepatic fibrosis on US attenuation. A previous study [38] revealed that hepatic fibrosis worsened US attenuation, while other studies [30,39] have reported that hepatic fibrosis did not have a significant effect on US attenuation, similar to our study. Our results suggest that TSI-p is more strongly affected by hepatic fibrosis than TAI-p, and it is necessary to consider the effects of both steatosis and fibrosis when interpreting TSI-p. Given that SWE, an extensively validated technique for hepatic fibrosis [40], is now available on many diagnostic US machines, the addition of SWE data could be useful for accurately diagnosing hepatic steatosis using TSI-p.
There are several limitations to our study. Firstly, our study population was heterogeneous and had various chronic liver diseases. As steatosis patterns and other parenchymal changes may vary depending on the etiology of liver disease, the performance of US parameters need to be evaluated according to the etiology. Secondly, in our study, CAP-based steatosis grades were used as the reference standard. Although CAP is a well-validated tool for hepatic fat quantification [10], its values can be influenced by several covariates such as BMI and diabetes [40] and the reported cut-offs for steatosis grades vary across studies. To determine the associations of RF data-driven parameters with each histologic feature (e.g., steatosis, fibrosis, and inflammation, etc.), future studies with histologic results would be required. Thirdly, as all US examinations with RF data acquisition were performed using one US machine with a predefined preset, the reproducibility of quantitative RF data-driven parameters and the optimal scan settings should be further investigated.
In conclusion, TSI-p and TAI-p derived from US RF data may be useful in the detection and severity assessment of hepatic steatosis, which could be superior to B-mode US parameters. These results support the possibility that multi-parametric US examinations, including B-mode US, RF data analysis, and elastography may be a promising approach for a comprehensive assessment of liver pathologies, including steatosis as well as fibrosis, although further validation is required.
 Download Citation
 PDF Links
 PubReader
 ePub Link
 Full text via DOI
 Full text via PMC


