

 Print
Print facebook
 twitter
 Linkedin
 google+

Introduction
Biliary atresia (BA) is a disease involving sclerosing inflammation and obstruction of the bile ducts in early infancy that causes the liver to be unable to excrete bile into the duodenum [1,2]. BA is the most common cause of liver cirrhosis and hepatic failure in young children and often leads to liver transplantation [3]. However, the existence of multiple variants of BA can make it difficult to diagnose BA. One such variant, cystic BA (cBA), accounts for approximately 5%-10% of BA cases [4,5]. When considering the three types of BA, cystic dilatation of the bile duct could be present at the point above or between the obliteration [2,6,7]. Therefore, a cyst of varying size could be present anywhere along the bile ducts, so this condition can mimic a choledochal cyst (CC) on imaging at the first presentation.
The diagnosis of BA early in infancy is important for the effective drainage of bile flow with the Kasai operation [8]. Early bile flow diversion before 60 postnatal days leads to better outcomes in BA patients, even though cBA cases were found to have higher native liver survival rates than patients with conventional BA [7]. Moreover, the surgical methods differ between cBA and CC (hepaticojejunostomy and choledochojejunostomy, respectively) [9]. Therefore, early and accurate differentiation between cBA and CC is essential.
The typical sonographic findings for BA include a dysmorphic gallbladder (GB), an absent extrahepatic bile duct, a positive triangular cord sign, increased hepatic subcapsular flow, and an increased hepatic artery diameter [10-13]. In addition to ultrasonography (US), magnetic resonance imaging (MRI) and hepatobiliary scintigraphy can aid in the preoperative diagnosis of BA [14-16]. A microcyst in the porta hepatis is also known to be a specific sign for diagnosing BA [17]. However, distinguishing cBA from CC using imaging is particularly difficult when the cyst is large and extends into the extrahepatic space, resembling CC type Ia/b according to the Todani classification [18]. Differentiation is also difficult in prenatal assessments [19,20]. Some authors suggested that cBA and CC could be interim entities belonging to the same pathologic continuum [21]. However, limited studies have focused on the differentiation of cBA with a large extrahepatic cyst from CC type Ia/b using various imaging modalities and prenatal images.
Therefore, the purpose of this study was to compare the clinical and radiologic differences between cBA and CC type Ia/b, including both prenatal and postnatal imaging.
Materials and Methods
Subjects and Demographics
The Institutional Review Board approved this retrospective study and waived informed consent. Infants (Ōēż12 months old) who were surgically confirmed to have cBA after the Kasai operation or CC type Ia or Ib from 2005 to 2019 were included and categorized into the cBA and CC groups, respectively. cBA was confirmed on intraoperative cholangiography and postoperative liver pathology. We only included cases of Todani classification type Ia/b (entire or segmental cystic dilatation of the extrahepatic bile duct) in the CC group because we surmised that the morphology of cysts in these types would resemble cBA. Other types, including type IV, were not included in the CC group because it was straightforward to exclude BA based on the presence and dilatation of intrahepatic bile ducts.
For the comparison of clinical and radiologic findings between cBA and CC groups, clinical findings such as age at the time of the postnatal US examination, sex, and initial preoperative laboratory results, including serum aspartate aminotransferase (AST), alanine transaminase (ALT), total bilirubin (T.bil), direct bilirubin (D.bil), ╬│ -glutamyl transferase (╬│GT), and alkaline phosphatase (ALP) were evaluated from a medical chart review. We also recorded the patientsŌĆÖ age at the time of operation and the time interval between the postnatal US study and operation to evaluate whether any operations were delayed in these groups.
Prenatal and Postnatal US
Postnatal abdominal US was randomly performed with one of three machines (HDI 5000, Advanced Technology Laboratories, Bothell, WA, USA; iU22, Philips Healthcare, Bothell, WA, USA; and Aixplorer, SuperSonic Imagine, Aix-en-Provence, France) with both microconvex and linear probes of each machine throughout the study period. The thickness of the triangular cord (mm) and diameters of the hepatic arteries (mm) were retrospectively reviewed by a pediatric radiologist with 10 years of experience in pediatric radiology. For GB, the presence of collapse and mucosal irregularity were evaluated. The size of cysts (cm) and the presence of internal sludge in cysts were checked.
In the available prenatal US studies, the visibility and size of the GB and changes in the cyst size (recorded using the longest diameter) from prenatal US to postnatal preoperative US were evaluated. The prenatal US examinations were performed by experienced gynecologists. The size of the GB (recorded using the longitudinal diameter) on prenatal and postnatal US was retrospectively measured by an experienced pediatric radiologist who was blinded to the patientŌĆÖs results.
Postnatal MRI
We also reviewed preoperative abdominal MRI examinations, which were routinely performed at our hospital in patients who were suspected to have BA or CC. The MRI examinations were performed using a 1.5 T system (Intera Achieva, Philips Healthcare, Best, the Netherlands). The images were reviewed using T2-weighted fast spin-echo axial images (repetition time, 1,500-1,600 ms; echo time, 80 ms; section thickness, 3 mm; slice spacing, 3 mm; flip angle, 90┬░; matrix size, 256├Ś256; and field of view, 19-25 cm), T1-weighted spin-echo axial images (repetition time, 525 ms; echo time, 10 ms; section thickness, 3 mm; slice spacing, 3 mm; flip angle, 90┬░; number of excitations, 1; matrix size, 256├Ś256; and field of view, 19-25 cm), and three-dimensional magnetic resonance cholangiopancreatography coronal images (repetition time, 1,500 ms; echo time, 650 ms; section thickness, 2 mm; slice spacing, 1 mm; flip angle, 90┬░; number of excitations, 1; matrix size, 256├Ś256; and field of view, 19-25 cm). On the MRI examinations, the same radiologist also reviewed the triangular cord thickness (mm), diameters of the hepatic artery and portal vein (mm), GB morphology (collapse, length, width, and ratio of GB length to width), and the longest diameter of the cyst (cm). In addition, the visualization of the distal common bile duct in the pancreas head, size of spleen (cm), and the presence of splenomegaly based on the patientsŌĆÖ age could be evaluated on MRI [22]. The thickness of the triangular cord sign on MRI was measured in accordance with a previous study [23].
All US and MRI examinations were performed after at least 4 hours of fasting for neonates and young infants.
Statistical Analysis
Statistical analyses were performed using the SPSS software package version 23 (IBM SPSS Statistics, IBM Corp., Armonk, NY, USA) and MedCalc version 19.1.3 (Ostend, Belgium). Values were presented as median values with ranges or as percentages within the corresponding group. Either the Mann-Whitney U test or the Fisher exact test was used to compare the clinical and radiologic differences between the cBA and CC groups. The Wilcoxon signed-rank test was used to compare measurements between US and MRI findings. Logistic regression and area under the receiver operating characteristic curve (AUC) analyses were performed for the diagnosis of cBA. A P-value of <0.05 was considered to indicate statistical significance.
Results
Subjects and Laboratory Results
PatientsŌĆÖ demographic characteristics and imaging findings are summarized in Tables 1 and 2. Of the 182 patients with postoperatively confirmed BA during the study period, 10 (5.5%; median, 48 days old; M:F=2:8) were diagnosed with cBA. During the study period, 11 (4.0%; median, 20 days old; M:F=3:8) of the 275 infants with CC had type Ia/b CC without intrahepatic biliary dilatation and were included in the CC group. In the CC group, 10 infants had type Ia CC and one had type Ib CC. Age and sex were not significantly different between the two groups (P=0.605 and P>0.99, respectively).
Among the laboratory results, AST, ALT, D.bil, and ALP levels were higher in the cBA group than in the CC group (Table 1). However, the T.bil and ╬│GT levels were not significantly different. The age at the time of operation was 14-105 days (median, 56 days) in the cBA group and 11-297 days (median, 25 days) in the CC group, which was not a significant difference (P=0.654). The time interval between the preoperative US study and operation was 6-12 days (median, 6 days) in the cBA group and 5-112 days (median, 8 days) in the CC group, which was also not a significant difference (P=0.387).
Comparison of Prenatal and Postnatal US Findings between the cBA and CC Groups
On postnatal US, the thickness of the triangular cord was greater in the cBA group than in the CC group (median, 5.2 mm vs. 3.1 mm; P<0.001). The hepatic artery diameter was larger in the cBA group than in the CC group (median, 2.3 mm vs. 1.3 mm; P=0.007).
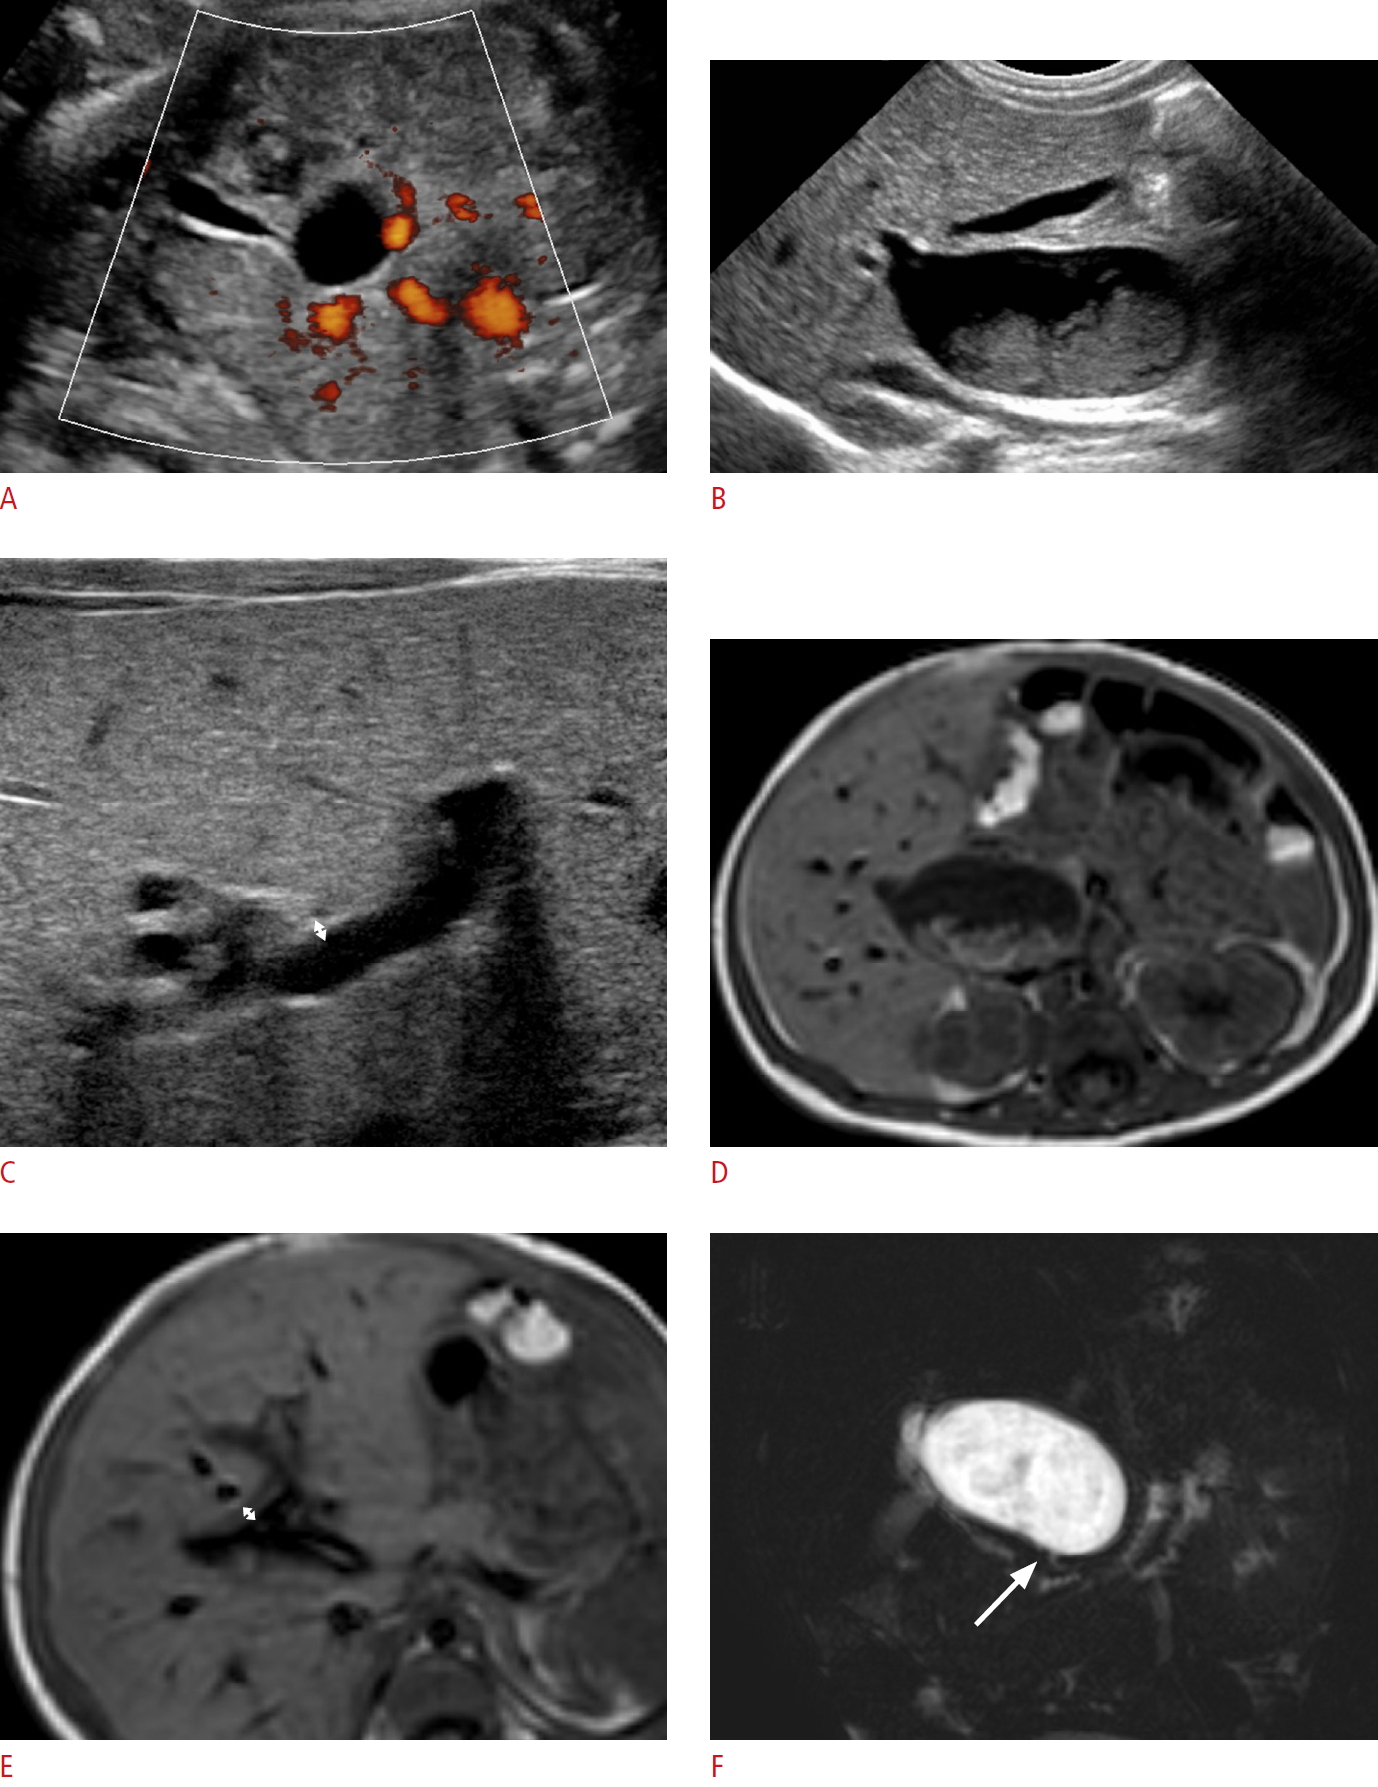
The GB was collapsed in 40.0% (4 of 10) of patients in the cBA group, whereas 18.2% (2 of 11) of the patients in the CC group had a collapsed GB (P=0.361). GB mucosal irregularity was observed in all 10 (100%) patients in the cBA group, but was not detected in the CC group (P<0.001) (Fig. 1). The two cases of collapsed GB in the CC group demonstrated a normal GB wall layer without a focal mucosal lesion. The GB length was 0.9-4.5 cm (median, 3.0 cm) in the cBA group and 1.9-3.4 cm (median, 2.5 cm) in the CC group (P=0.796). Two patients (2 of 11, 18.2%) in the cBA group and no patients in the CC group had a GB length less than 1.5 cm.
The cyst size on postnatal US was 0.7-3.4 cm (median, 2.0 cm) in the cBA group and 2.0-6.1 cm (median, 3.4 cm) in the CC group. The cysts were significantly larger in the CC group than in the cBA group (P=0.002) (Fig. 2). Sludge in the cyst was seen in only one patient (1 of 10, 10.0%) in the cBA group and in six patients (6 of 11, 54.5%) in the CC group, which was not a significant difference (P=0.063).
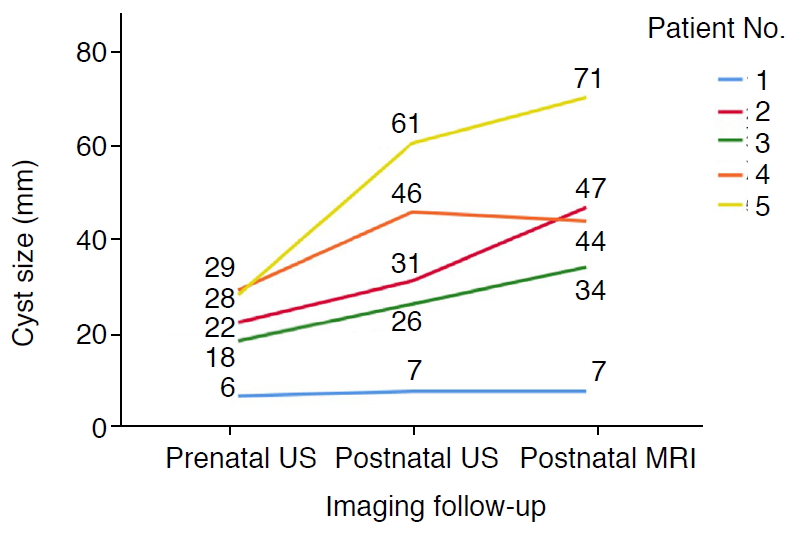
Only five patients at our institution (one in the cBA group and four in the CC group) had available prenatal US images. Three patients in the CC group had two serial prenatal US examinations. The GB was visible in three patients in the CC group, with sizes of 1.3, 1.9, and 2.0 cm. The GB was not detected in the cBA patient on prenatal US. The prenatal cyst size was 6 mm in the cBA group (Fig. 1A) and 18-46 mm in the CC group. When we compared the serial cyst size changes from the prenatal US and postnatal US and MRI images, as shown in Fig. 3, all of the patients in the CC group showed a gradual increase, with all cysts being larger than 1 cm. In contrast, the size of the cyst in the patient in the cBA group was stable and less than 1 cm (6 mm on prenatal US and 7 mm on postnatal US and MRI).
MRI Findings
All of the included patients underwent MRI. On MRI, the triangular cord was thicker in the cBA group than in the CC group (median, 5.2 mm vs. 3.5 mm; P<0.001) (Table 2). The cBA group had larger hepatic arteries and smaller portal vein diameters (P=0.029 and P=0.001, respectively). However, the prevalence of a collapsed GB was not significantly different between the two groups (40% vs. 9.1%, P=0.149). The cBA group had narrower GBs and larger GB ratios, corresponding to an elongated shape (Fig. 1), than the CC group (Table 2). The cysts were larger in the CC group (median, 3.6 cm; range, 2.7 to 7.2 cm) than in the cBA group (median, 2.1 cm; range, 0.6 to 4.3 cm) (P=0.001).
The difference between the postnatal US and MRI measurements was not significant for triangular cord thickness (P=0.411), but was significant for the hepatic artery diameter (median, 0.5 mm overall, 0.4 mm in the cBA group, and 0.6 mm in CC group; P=0.003) and cyst size (median, 2 mm overall, 0.5 mm in the cBA group, and 8 mm in the CC group; P=0.048). However, the difference in these measurements was not significant between the two groups (P=0.918 for triangular cord thickness, P=0.193 for the hepatic artery diameter, and P=0.349 for cyst size).
On MRI, it was also possible to evaluate the visibility of the distal common bile duct and the presence of splenomegaly. The distal common bile duct was visualized in all patients in the CC group, while no patient had a visible distal common bile duct in the cBA group (P<0.001). Spleen size and the prevalence of splenomegaly were not significantly different between the two groups (Table 2).
Regression Analyses and Diagnostic Performance
Univariate logistic regression analyses using the variables of triangular cord thickness and cyst size showed significant differences between the cBA and CC groups on both US and MRI. The odds ratio (OR) of triangular cord thickness on US for cBA was 26.015 (95% confidence interval [CI], 1.566 to 432.164; P=0.023) and the OR of cyst size on US for cBA was 0.149 (95% CI, 0.030 to 0.748; P=0.021). On MRI, the OR of triangular cord thickness for cBA was 10.542 (95% CI, 1.271 to 87.400; P=0.029) and the OR of cyst size for cBA was 0.177 (95% CI, 0.037 to 0.860; P=0.032).
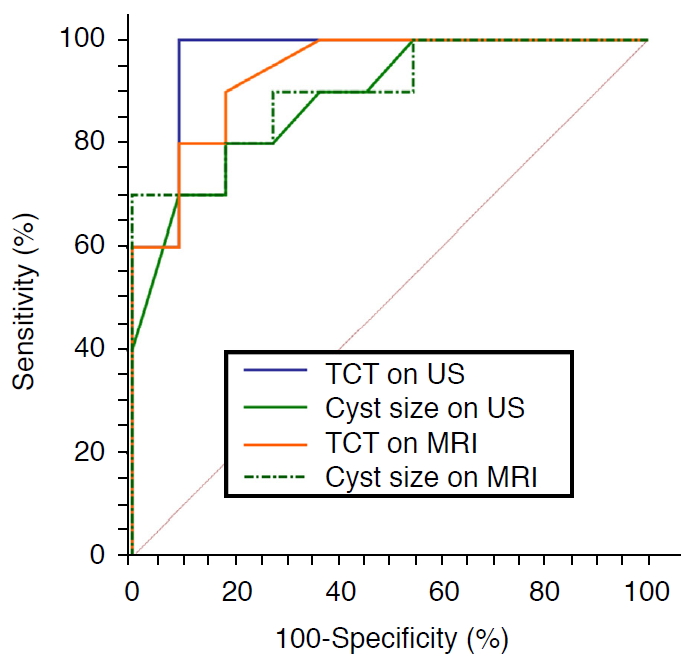
For the diagnosis of cBA in our study population, the AUC was 0.964 (95% CI, 0.779 to 1.000) for US triangular cord thickness, 0.886 (95% CI, 0.673 to 0.982) for US cyst size, 0.936 (95% CI, 0.739 to 0.996) for MRI triangular cord thickness, and 0.900 (95% CI, 0.690 to 0.987) for MRI cyst size (all, P<0.001) (Table 3). The AUCs of these four variables were not significantly different (Fig. 4).
The cutoff value of Ōēź4 mm for US triangular cord thickness showed 100% sensitivity and 90.9% specificity, while the cutoff value of Ōēź4 mm for MRI triangular cord thickness showed 90% sensitivity and 81.8% specificity. When considering cyst size, the cutoff value of Ōēż2.8 cm on US had 80% sensitivity and 81.8% specificity, while the cutoff value of Ōēż2.2 cm on MRI had 70% sensitivity and 100% specificity.
The combination of triangular cord thickness or cyst size on US with GB mucosal irregularity increased the AUC to 1.000. The combined diagnosis of triangular cord thickness or cyst size on MRI with a nonvisible distal common bile duct also increased the AUC to 1.000 (Table 3).
Discussion
cBA can be misdiagnosed as CC, especially when the cyst is large and not limited to the periportal tract. However, it is important to differentiate these two disease entities early in infancy because they have different clinical outcomes without an early intervention [24]. Our study showed that an increased triangular cord thickness (cutoff value of 4 mm on US, the same cutoff as in the original research on BA [10]), smaller cyst size, GB mucosal irregularity, and non-visibility of the distal bile duct on US or MRI were the key diagnostic features for differentiating cBA from CC type Ia/b, with excellent diagnostic performance, even though T.bil and ╬│GT levels were not significantly different between the two groups. These imaging features should be carefully examined when encountering infants with extrahepatic biliary dilatation.
In a previous study, the most frequently described difference between cBA and CC was the cyst size. Several studies mentioned that cysts were significantly smaller on postnatal US in cBA than in CC, with cutoff values ranging from 1.5 to 3.5 cm [5,24-26]. Even though the cyst size in cBA can be variable, and cysts can extend below the hepatic hilum, the cysts in infants with cBA were also significantly smaller than those in infants with CC in our study. In addition, on prenatal studies, the cysts in the CC group were all larger than 1 cm and showed a tendency for gradual growth after birth, while the cyst in the cBA group for which information was available was smaller than 1 cm and stable in size. Other studies also mentioned that the cyst size in infants with cBA was stable during follow-up in the prenatal period [20,27,28] and smaller than that reported in a postnatal study [4], even though the size itself varied considerably across infants (0.5-4.0 cm). Obliteration between the intrahepatic and extrahepatic bile ducts in BA, rather than the normal development of the bile ducts, could contribute to the stable cyst size in utero [29]. Another theory suggested that overexpression of CD56 at the portal area represented dysregulation of the cell or intercellular matrix interactions in ductal plate remodeling in prenatal cBA patients [30]. These immune and inflammatory responses could affect various features of the size and growth patterns of cysts in cBA and CC prenatally. The differences in patterns of changes in cyst sizes from the prenatal to postnatal period could assist in the early diagnosis of cBA and the provision of appropriate interventions.
Triangular cord thickness is the most useful US feature for diagnosing BA and MRI can show comparable diagnostic performance to US using triangular cord thickness [10,14,23]. The combination of a thickened triangular cord sign, abnormal GB morphology, and non-visibility of the common bile duct showed excellent diagnostic performance for differentiating BA using both US and MRI [23]. Our study showed that these features could also help in the differentiation of cBA from CC. Zhou et al. [19] suggested that a positive triangular cord sign (cutoff, 4 mm), smaller cyst size without internal sludge, hepatic artery enlargement, and GB mucosal irregularity could represent cBA on US. Those results are comparable with the findings of our study, except for sludge in the cyst, because one cBA patient in our study had sludge in the cyst. Furthermore, our study is meaningful since no other study has demonstrated imaging differences between US and MRI, including prenatal US. Even though US has benefits due to the better spatial resolution of neonatal abdominal US compared with MRI, both US and MRI showed excellent diagnostic performance for diagnosing cBA based on the triangular cord sign and cyst size. In addition, MRI has certain benefits, including clear visualization of the distal bile duct and its usefulness for preoperatively assessing vessel and bile duct anomalies, including anomalous pancreaticobiliary ductal union. In our study, a combination of US and MRI features, including triangular cord thickness Ōēź4 mm, cyst size Ōēż2.2-2.8 cm, GB mucosal irregularity, and a nonvisible distal common bile duct, showed excellent diagnostic performance.
The morphology of GB plays an important role in both prenatal and postnatal imaging. A small or nonvisible GB in the second trimester increases the suspicion of BA on prenatal US [28,29]. Postnatally, the GB also shows an atretic or abnormal shape in cBA patients [19,25,26]. In our study, the case of cBA with prenatal US had a nonvisible GB, whereas three of the four CC patients with available prenatal US showed normal GB. Postnatal US also showed GB mucosal irregularity in all cases of cBA and no cases of CC. Even though the GB size was not significantly different between the cBA and CC groups in our study on either US and MRI, atretic GB (<15 mm) was only seen in the cBA group. Moreover, abnormal GB morphology (a narrower GB and larger GB ratio) was a characteristic finding of cBA, rather than CC, on MRI. Not only an atretic or small GB, but also abnormal morphology (e.g., a tubular or elongated shape) can be an important marker for differentiating cBA from CC.
There are several limitations in this study. First, there was a small number of patients in each group because of the rarity of these diseases, even given the long study period at a tertiary hospital. We could not statistically compare the patterns of changing prenatal and postnatal cyst size because prenatal US images were only available for five patients, including one patient in the cBA group. Further research is needed on prenatal cyst size criteria. Second, because this was a retrospective study, there was a lack of information on some imaging features. A retrospective analysis of obtained images might identify differences in the hepatic artery diameter and cyst size depending on the imaging modality, even though the measurement difference was not significant between the groups. Third, neither pathologic correlations with the imaging findings nor clinical outcomes were assessed. Further evaluation through a multicenter study, including prenatal images, is needed for the clinical validation of these results.
Even though the cysts in cBA can resemble CC morphologically, key imaging features can aid in the differentiation of cBA from CC with excellent diagnostic performance. For cBA, a small cyst size (<1 cm) on prenatal US, triangular cord thickening Ōēź4 mm, and GB mucosal irregularity on postnatal US, as well as a small cyst size (Ōēż2.2 cm) and invisible distal common bile duct on MRI can discriminate cBA from CC type Ia/b in infancy. Careful evaluation and consideration of cBA are needed when we encounter a CC-like lesion in an infant.

 Download Citation
 PDF Links
 PubReader
 ePub Link
 Full text via DOI
 Full text via PMC


