

 Print
Print facebook
 twitter
 Linkedin
 google+

Introduction
Doppler ultrasonography is a relatively simple and accurate method for determining the existence and the direction of the blood flow and diagnosing various diseases that influence the blood flow. It involves analyzing the difference within the frequency of the Doppler waveforms of the bloodstream that may provide functional information about the stenosis in upper blood vessels and the change in the resistance in the distal blood vessels. Among several parameters of a Doppler waveform analysis, the resistive index (RI) has been widely used for supporting diagnostic and therapeutic procedures. Its value has been confirmed in various clinical settings of renal diseases, including acute tubular necrosis, obstructive or medical nephropathy, atherosclerotic renovascular disease, and renal transplant dysfunction [1-7]. However, there is a lack of RI specificity in the evaluation of intrinsic renal disease, and several studies published to date have reported conflicting results about the utility of RI [8-10]. The lack of consensus on the utility of renal Doppler may be attributed to the limited understanding of Doppler waveforms in the evaluation of the changes in renal status and the pathophysiology of renal disease. The complex interaction between renal vascular resistance and compliance partly explains the failure of Doppler sonography to consistently differentiate among types of intrinsic renal disease [11].
Several studies have evaluated the usefulness of Doppler ultrasonography in detecting renal artery stenosis [12,13]. Hemodynamically significant stenosis of the renal artery causes changes in the shape of the time-velocity waveform in the downstream arterial network. It generally refers to delayed or prolonged early systolic acceleration and diminished amplitude and rounding of the systolic peak, which has been described as the classic signs of pulsus tardus and parvus (PTP). However, the cause of this phenomenon remains unclear. To analyze the possible factors and their relationships and interactions in Doppler signals, we constructed a renal blood flow phantom that showed a low-resistance waveform in a complete closed circuit corresponding to unilateral kidneys on the basis of the pulsating blood flow model of Chung et al. [14] with an artificial heart pump. The aim of this study was to investigate factors that influence renal arterial Doppler waveforms in a renal flow phantom with a focus on the RI and the phenomenon of PTP in order to provide a more accurate and comprehensive explanation of the Doppler signal.
Materials and Methods
Institutional Review Board and Institutional Animal Care and Use Committee approvals were not required because this study did not use any human or animal data.
Research Materials
A closed-circuit in vitro blood flow model was constructed from glass tubes, a water tank, rubber tubes, polyethylene tubes, and the artificial heart of an electrohydraulic ventricular assist device controlled by a computer (Fig. 1). The artificial heart model was the Korean-type total artificial heart (Kor-TAH) developed by the Department of Biomedical Engineering of Seoul National University Hospital. This model controls the stroke volume, the heartbeat, and the compressed waveforms through six control factors, namely the left stroke angle, right stroke angle, left velocity, right velocity, left break time, and right break time, which has similar pressure mechanisms that can produce a pulsatile blood flow similar to that produced by an in vivo heart. Through such preliminary experiments, the control variables for the artificial heart were fixed as follows: left stroke angle, 30┬░; right stroke angle, 5┬░; left velocity, 20┬░/sec; right velocity, 10┬░/sec, left break time, 0 msec; and right break time, 30 msec, which remained unchanged throughout the experiment.
In order to simulate the blood vessels, rubber tubes and polyethylene tubes (length, 0.5 m, 1 m, and 2 m) were used, where two specific materials were chosen to assess the influence of a change in compliance. The external and internal diameters of the tubes were 16.6 mm and 11.5 mm, respectively. The ultrasound could not pass well through these two types of tubes; therefore, glass tubes were placed in the middle of the circuit, which made it possible to conduct the Doppler ultrasound study. The measurements of the glass tube were as follows: length, 30 cm; external diameter, 15 mm; internal diameter, 12 mm; and thickness, 1.5 mm. The glass tube was installed in a plastic support device filled with water for the ultrasound to pass through easily. The part of the glass tube that stood outside of the plastic support device was stopped in order to avoid water leakage, and both ends of the glass tube were connected to tubes of different lengths and materials, namely rubber and polyethylene, so that the compliance of both proximal and distal blood vessels of the examined site could be checked through a Doppler ultrasound study. At the end of the distal tubes, a stopcock controlled the degree of openness, which influenced the resistance level in the distal vessels and corresponded to the resistance in the peripheral vessels such as the arterioles, which provide significant resistance to the blood flow and serve as a major determinant of the blood pressure in the human body. The blood that flowed through the stopcock placed at the very end of the distal tubes was first collected in a water tank that corresponded to the capillary network and was subsequently pumped into the artificial heart by a small pump.
In order to mock the viscosity of the blood at 20Ōäā, 350 mL of glycerol was added per liter of water [15]. To achieve an adequate Doppler signal, 1 g of corn starch was added per liter of water for the scattering effect; this mixture was constantly stirred in the water tank in order to maintain an equal distribution [12].
Research Method
As shown in Fig. 1, the closed circuit was designed in the following order: artificial heart model, rubber or polyethylene tube, glass tube, rubber or polyethylene tube, stopcock, water tank, polyethylene tube, and artificial heart model. This design simulated a unilateral renal vascular flow model. By using a computer system, we manipulated control variables and assessed the Doppler waveforms to find the conditions under which the triphasic waves were transformed into waveforms that resembled the ski slope form, like that of the renal blood flow. A spectral Doppler waveform was obtained by switching the rubber and polyethylene tubes at the sites where the glass tube was connected, while the control variables of the artificial heart were kept fixed, in order to examine the influence of the change in the compliance of the blood vessels. For both rubber and polyethylene tubes, two of each of 0.5-m-, 1-m-, and 2-m-long tubes were used, which made a total of 36 combinations possible. The resistance effects were evaluated using a vascular model, made out of either rubber (2H-2H) or polyethylene tubes (2L-2L), in which the proximal and distal parts were 2 m long, respectively. The effects of distal resistance were assessed by changing the stopcock angles (either 0┬░, 30┬░, or 60┬░) located at the end of the distal tube. In contrast, to assess the effects of proximal resistance, small tubes with four different diameters and two different tube lengths (1.5 cm and 3 cm) were coaxially inserted into a rubber tube (internal diameter, 11.5 mm) to make a four-degree stenosis model. All stenoses were graded in one of the following five groups: grade 0 (0% diameter stenosis), grade 1 (21% diameter stenosis), grade 2 (45% diameter stenosis), grade 3 (67% diameter stenosis), and grade 4 (77% diameter stenosis) (Fig. 1C). In order to examine the influence of the change in the heart beat, the left break time was varied as 0, 10, 30, 50, 70, 90, 110, and 200 milliseconds, while all the other variables were kept fixed during the Doppler examination.
Spectral Doppler sonography was conducted under the same condition by using a 7-MHz linear transducer, and one researcher performed the examination in order to reduce the inter-observer variation. In the Doppler frequency shift waveforms gathered through the spectral Doppler examination, the peak systolic velocity (PSV), minimum diastolic velocity (MDV), RI, pulsatility index (PI), early systolic acceleration time (AT), and acceleration index (AI) were measured. The RI is equal to the value of the PSV with the MDV subtracted and then divided by the PSV; the PI refers to the PSV subtracted by the MDV divided by the mean velocity, which were easily calculated by the built-in software of the ultrasonic devices. The AT denotes the time interval between the beginning of systole and the early systolic compliance peak, and the AI represents the ratio of the AT to the PSV, which was also calculated by the software inside the ultrasonic device. Based on such measurements, the influences of the vessel compliance, resistance, and heart beat rate on the spectral Doppler waveform were analyzed with special attention to the influences on the RI and the phenomenon of PTP in order to provide a more accurate and comprehensive explanation of the Doppler signal.
For the statistical evaluation, a linear regression analysis was used and regression coefficients were compared with a one-way analysis of variance to determine whether the linear regression fits differed significantly; a P-value smaller than 0.05 was considered to indicate a statistically significant difference.
Results
Influence of the Changes in Compliance on the Parameters of the Spectral Doppler Waveforms in the Absence of Stenosis
The measurements are summarized in Table 1 and supplementary Table 1.
Changes in the Doppler waveforms depending on the compliance
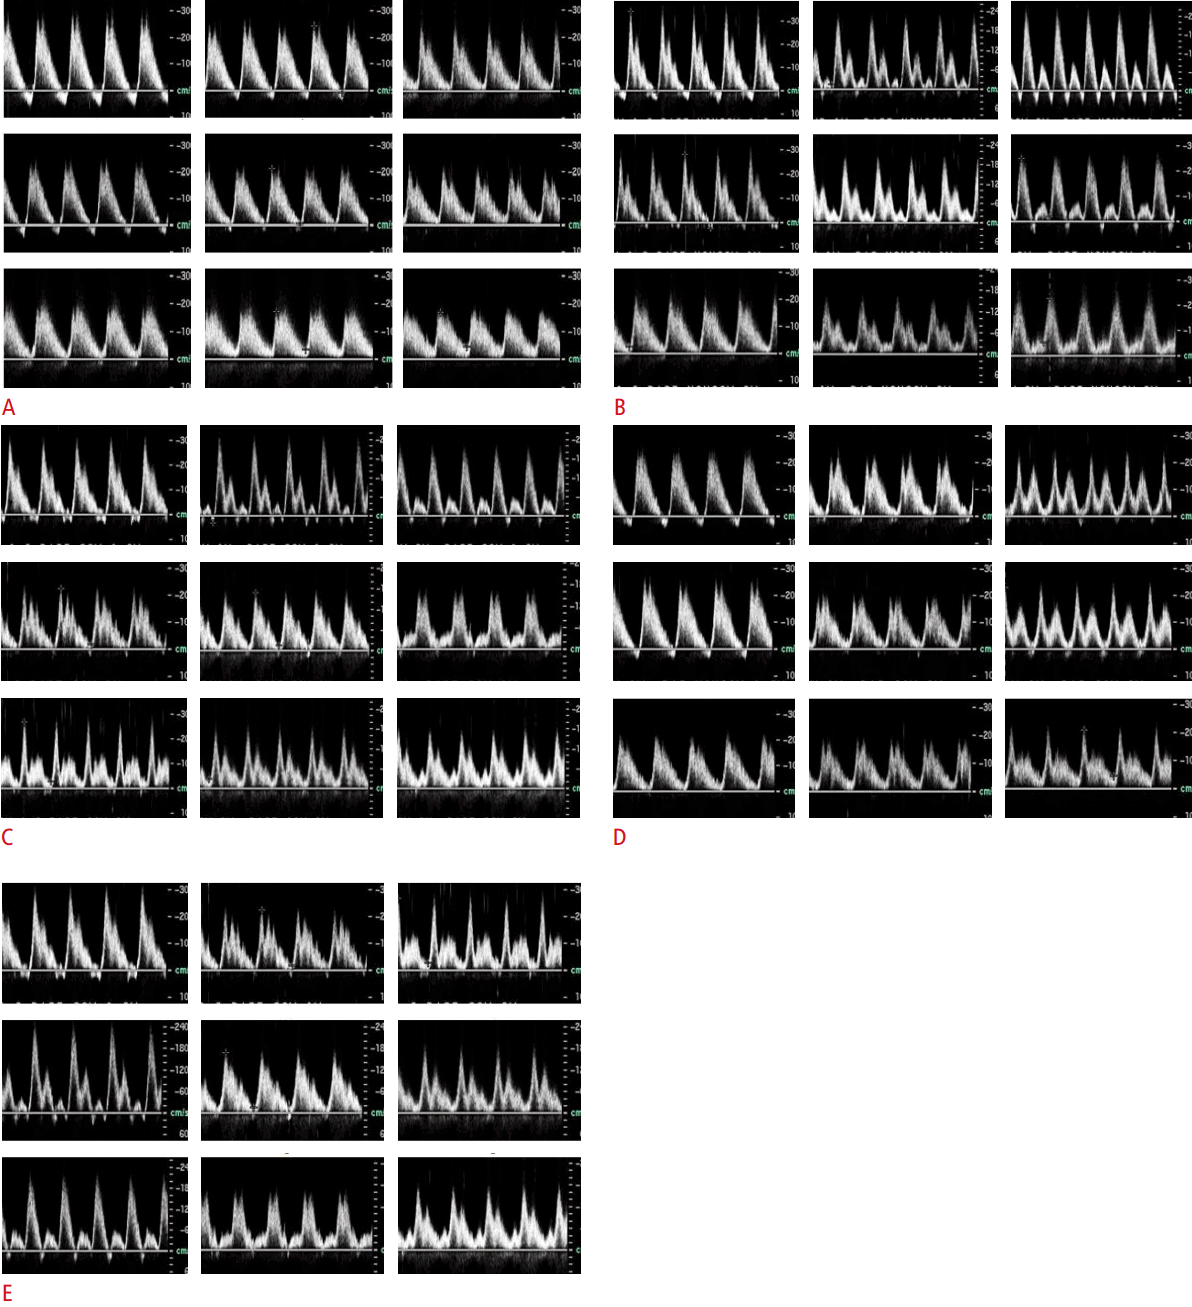
In the combination of polyethylene tubes that had a lower compliance for both proximal and distal vessels, the spectral Doppler waveforms peaked in the early systole with a rapid increase until the second peak in an adjacent area, and slowly decreased until the end of the diastolic phase, which most resembled the waveforms of the renal vessels (Fig. 2A). When the polyethylene tubes were replaced by rubber tubes, which had a higher compliance, more complicated spectral Doppler waveforms were observed. The tendency depicted in various combinations in the proximal and distal vessels cannot be simplified; however, certain characteristics could be theorized as follows: in the case of lower compliance in the distal vessels, when the proximal vessel compliance is increased, the second peak after the early-systole peak was delayed, which may result in the formation of a triphasic waveform by the separation of the second peak from the first peak and the second peak in the diastole after showing a reversed flow (Fig. 2B). In the case of higher distal vessel compliance, we observed similar results but weaker changes as compared to the setting of lower distal vessel compliance when the proximal vessel compliance was increased (Fig. 2C). Therefore, similar to the triphasic waveforms in large arteries in the human body, the diphasic waveforms transformed into triphasic waveforms when the distal compliance was low and the proximal compliance was high. In the case of lower proximal vessel compliance, a more prominent late systolic peak was seen with increasing distal vessel compliance (Fig. 2D). In the case of higher proximal vessel compliance, higher distal vessel compliance resulted in slightly more diastolic flow (Fig. 2E).
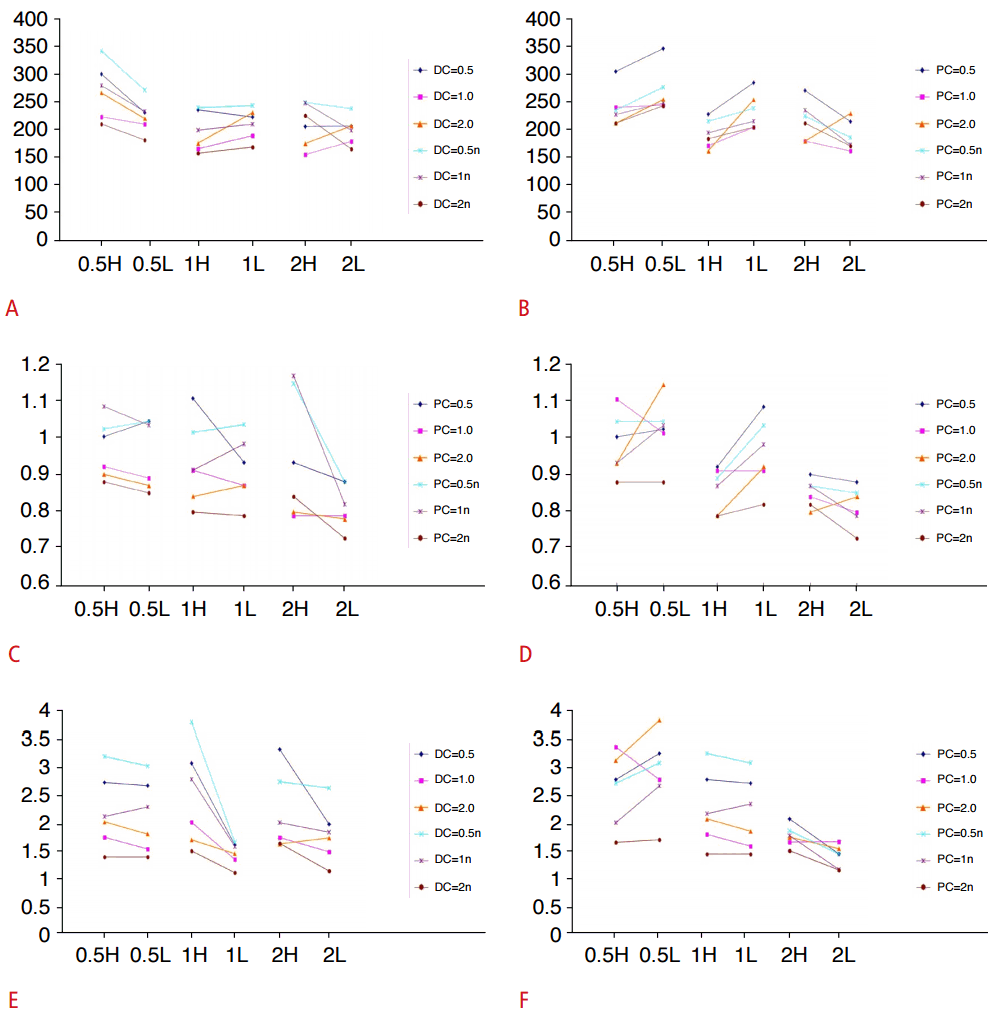
Influence of vessel compliance on PSV
The PSV did not show any consistent tendency when analyzed with different compliance combinations with the same length, in the cases of both distal and proximal vessel compliance (P>0.05) (Fig. 3A, B). Longer tubes produced increased resistance as well as increased compliance. Therefore, a greater length of the tubes produced a simultaneous increase in both compliance and resistance if the material was kept the same. Despite the weak effect, there was a decreasing tendency in the PSV when the tubes in the front and the back of the examination site were longer, and the tendency was clearer when the length of the distal tube was changed as compared to the change in the proximal tube length.
Influence of vessel compliance on RI
With the distal tube fixed, when the difference in the RI between the rubber and the polyethylene tubes as a proximal vessel was compared, extensive evidence showed that the RI was lower when the compliance of the proximal tube was lower. However, in some cases, contradicting results were observed; therefore, a fixed correlation was impossible (Fig. 3C, D). With the proximal tube fixed, when the difference in the RI between the rubber and the polyethylene tubes as a distal vessel was compared, many cases showed that the RI was lower when the compliance of the distal tube was lower, but contradicting results were also observed. Thus, there was no correlation between the proximal or distal tube compliance and RI (P>0.05).
Influence of vessel compliance on PI
A comparison of the PI under the same condition and length, but various combinations of vessel compliances showed some difficulties in drawing a correlation, similar to the case mentioned above. In distal tubes, the PI showed no significant changes based on the tube compliances; however, in proximal tubes, higher compliances resulted in a higher PI rather than a lower tube compliance (Fig. 3E, F). Such an observation can also be inferred by a qualitative analysis of the Doppler waveform, based on the fact that pulsatile waveforms were detected when the proximal vessel compliance was higher.
Influence of the Resistance Change in the Vessels Distal to the Doppler Sonography Examination Site
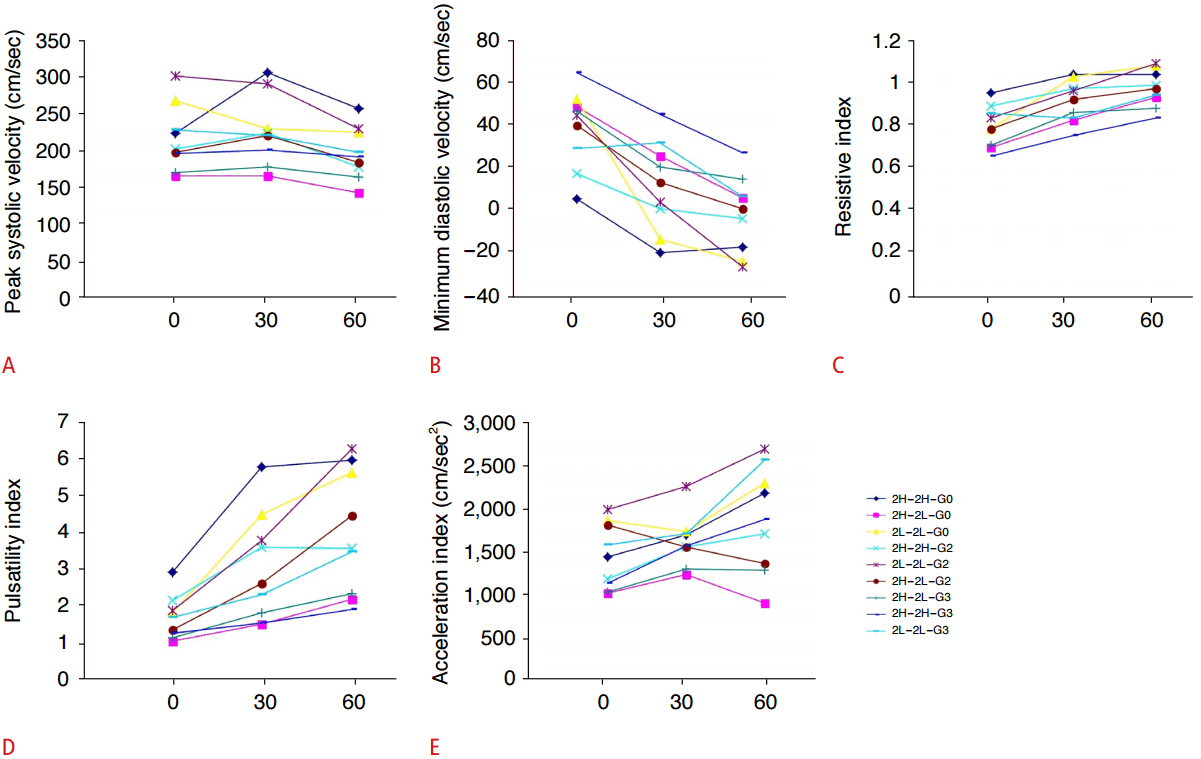
The measurements are summarized in Table 2. An increase in the resistance of the tubes distal to the Doppler examination site resulted in a slight decrease in the PSV, without any statistical significance (Fig. 4). In contrast, the MDV decreased more clearly than the PSV, even resulting in a reversal; therefore, both the RI and PI increased with an increase in the distal resistance (P<0.05). Despite contradicting results, the AI tended to increase when the distal resistance increased.
Influence of the Resistance Change in the Vessels Proximal to the Doppler Sonography Examination Site
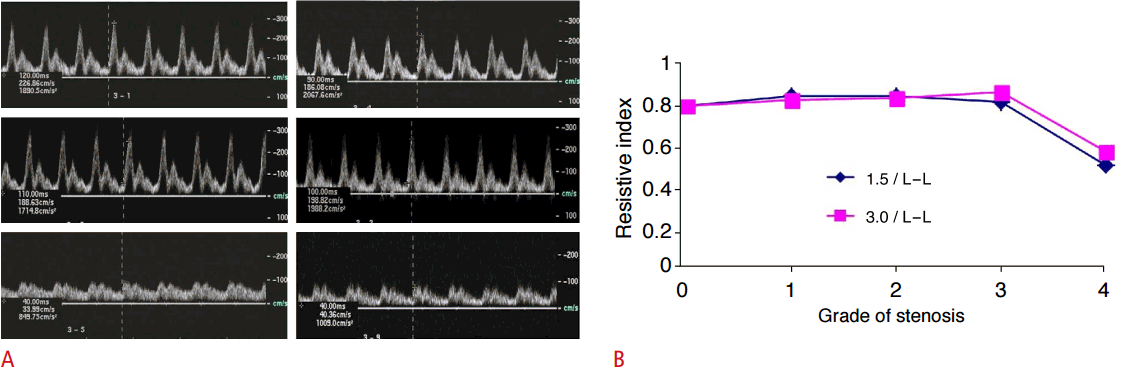
The PSV tends to decrease with increasing proximal stenosis. Although there was no noticeable decrease in mild stenosis, it dramatically decreased at a certain threshold (Fig. 5A). Compared to relatively hard polyethylene tubes, rubber tube models demonstrated the pulsus parvus phenomenon more clearly due to lower PSV values. There was no meaningful difference in the PSV between different lengths of stenosis (i.e., 1.5 cm vs. 3 cm). Stenosis in the proximal part resulted in relatively low minor changes in the MDV, as compared to the PSV; therefore, the RI, PI, and AI decreased as well. The RI was maintained up to a certain level, yet it dramatically decreased in the significant pulsus parvus (Fig. 5B). The polyethylene tube models, with less elasticity, represented a pulsus parvus wave in grade 4, whereas the more elastic rubber tubes demonstrated the same phenomenon between grade 2 and grade 3 stenosis models. In the rubber tube models, the pulsus parvus was observed in grade 3 when the stenosis length was 1.5 cm. In contrast, it was observed in grade 2 when the stenosis length was 3 cm. With the presence of proximal stenosis, a reduction of the AI as well as pulsus parvus in response to a reduction in the PSV was demonstrated. However, no correlation between the degree of stenosis and AT, defined as time to reach the early systolic peak, was observed. When a greater resistance was applied on the distal part, the PSV and MDV fell while the RI and AI increased; this made it more difficult to diagnose vascular stenosis in the proximal part, as compared to a case where the distal part was subjected to a lower resistance.
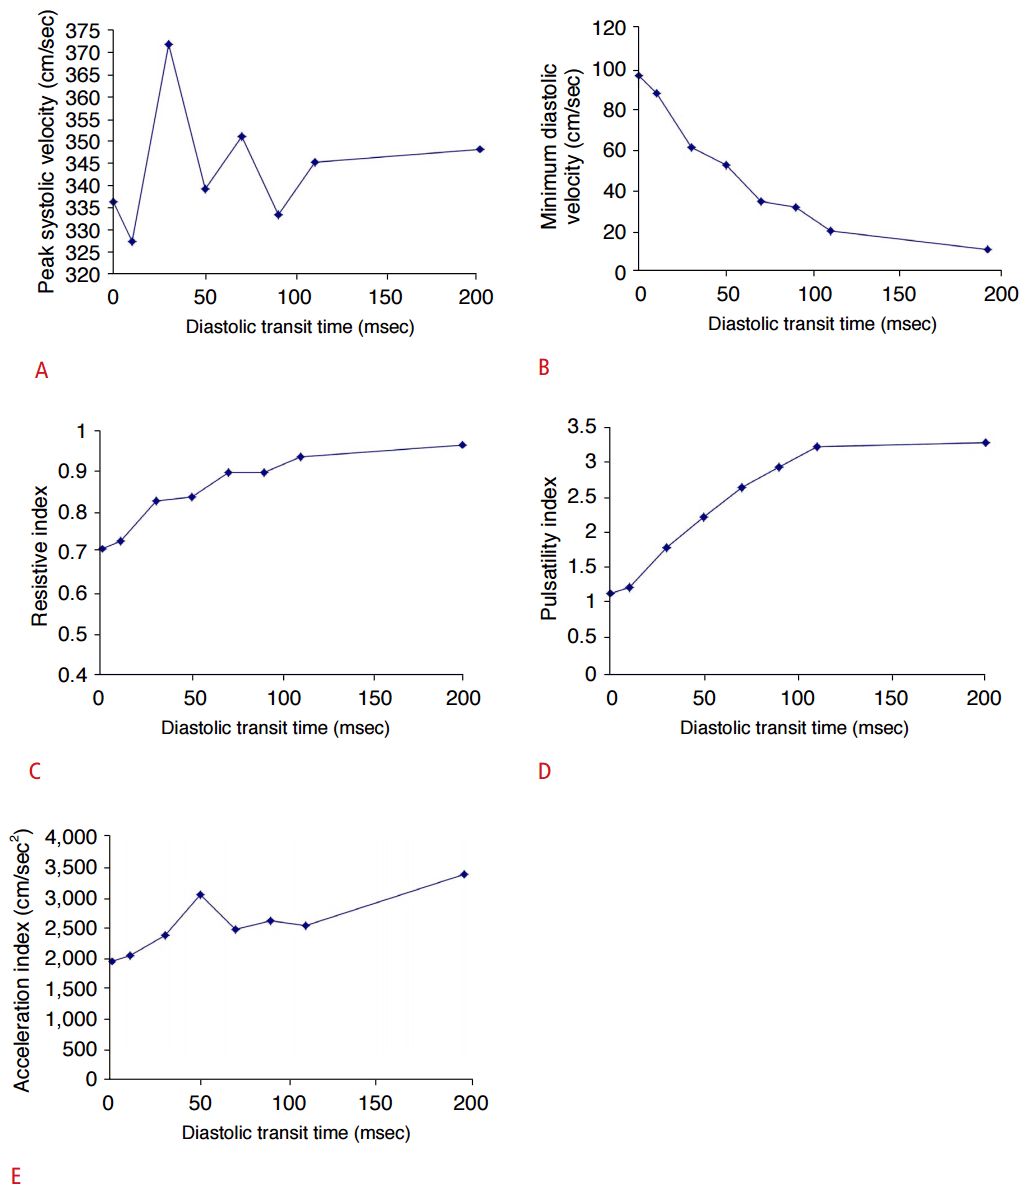
Influence due to Changes in the Pulse Rate
The pulse rate decreased with a prolonged delay of the diastole. The PSV fluctuated in various ways as the pulse rate decreased; however, the MDV steadily decreased. Accordingly, the RI, PI, and AT increased as the pulse rate decreased due to the prolonged diastolic transit time (P<0.05) (Table 3, Fig. 6).
Discussion
One of the characteristics of the vascular system is that the blood vessels have the ability to be dilated; i.e., the system possesses distensibility. Such distensibility plays an important role in the circulation; e.g., the arteryŌĆÖs distensibility adjusts the output of the heartbeat and provides an averaging effect so that the consistent and continual blood flow can reach the very small vessels at the very end of the tissues. However, hemodynamically, the capacity of the vessels to reserve the blood depending on the increase in the blood pressure has more significance than the distensibility itself. The increase in the volume dependent on the increase in the blood pressure is usually defined as the blood vessel compliance, or capacitance. We used two types of tubes with three different lengths in the vascular phantom to evaluate the influence of compliance on the Doppler waveform. Rubber tubes with high compliance were used for simulating the compliance of human blood vessels, and tubes made of polyvinylchloride resin, which have lower compliance than the rubber tubes, replaced the rubber tubes in order to induce change and observe the influence of changes in compliance on arterial Doppler waveforms.
The relatively consistent waveforms observed in the case of the tubes with very low compliance can be explained by the transmitted pulses. In contrast, when the tubes proximal and distal to the examination site were replaced with higher compliance tubes, the waveforms changed into more complex and various forms. This can be explained by the temporary reservation of the kinetic energy that originated from the systolic pressure pulse in the form of potential energy that was exerted due to compliance at the end of systolic phase when the blood pressure decreased. Therefore, the early systolic peak of the Doppler waveforms can be explained by the first transmitted pulse, and the second peak that forms more broadly in the systolic phase can be caused by the vessel compliance. The proximal vessel compliance plays a crucial role in the formation of the second peak after the early-systole peak. Further, the compliance peak was influenced by the resistance of the distal area, in which with the low distal resistance, the blood flow caused by the compliance was sent to the distal area to prolong the systolic blood flow while the blood volume increased in the diastolic phase. In the case of a high resistance in the distal area, the energy reserved via compliance could reverse the blood flow. Therefore, the complex Doppler waveforms that cannot be explained by the compliance in the proximal area were possibly influenced by the compliance of the distal area, and the resistance factor.
Although the compliance of proximal or distal tubes influences changes in Doppler waveforms, this experiment did not show any consistent tendency of the effect of compliance on the changes in the PSV, RI, PI, AT, and AI. In this study, the compliance and resistance in both proximal and distal areas were manipulated to determine an effect; however, within human bodies, the resistance can change from 0 to infinity but not the vascular compliance. Analogous to a spring, within the limit of the spring, the compliance remains the same irrespective of the amount of increase. Even though the vessels are regulated by the autonomous nervous system that controls the smooth muscles, the blood vessels within a certain area have the same compliance irrespective of the amount of increase. The hardening of the arteries or the swelling of the interstitium, cellular infiltration, etc., can influence the compliance of the vessels; however, compliance does not have the property of dynamic change like the resistance, and cannot be changed drastically. Therefore, while the blood waveforms are usually influenced by the pressure waves, and the proximal and distal resistances, the vessel compliance does not change significantly, which cannot constitute the main influential factor, but a dependent variable.
Bude and Rubin [16] showed that in the case where there is no compliance, that there was no correlation between the resistance and RI; Tublin et al. [17] reported that even in the case of a strong increase in the resistance by injecting phenylephrine in an in vivo rabbit experiment, the RI increased insignificantly. In the experiment with polyethylene tubes that minimalized the compliance, the RI changed as the distal resistance increased or the length of the tube changed. With very low compliance, proximal Doppler waveforms were not attenuated but delivered until the distal area, so that the RI between the proximal and the distal areas remained about the same. However, the resistance of the vessels attenuates the Doppler waveforms so that the blood flow changes from a pulsatile to a continual non-pulsatile flow (i.e., the RI is 0), which results in a change in the RI values. The distal resistance increase influenced the RI by changing the velocity of the systole and the diastole with varying ratios. This study showed that the MDV decreased more clearly than the PSV, even resulting in a reversal, so that the RI and the PI both increased with an increase in the distal resistance. Therefore, the changes in the distal vessel resistance significantly influence the changes in the RI. In contrast, Tublin et al. reported little effect on the RI despite the rapid change in renal vessel resistance suggesting the influence of a vasoconstrictor cannot be limited to the resistance in the proximal or distal area [17]. The vasoconstrictor constricts not only distal vessels but also the other vessels simultaneously; moreover, it influences other factors such as the heart rate.
For the diagnosis of renal artery stenosis, an early Doppler test directly examined the stenotic segment of renal arteries, yet favorable results were not demonstrated because of technical difficulties to implement the test as well as a high likelihood of false-negative or false-positive. Multiple studies reported that renal vascular stenosis might be diagnosed via small systolic wave and delayed systolic acceleration (known as PTP) [18,19]; peripheral arteries in kidneys were examined using the Doppler test instead of stenotic arteries. As the stenosis worsened reflecting the resistance in the proximal blood vessels, the PSV on the sonogram site dramatically decreased to a certain degree. In contrast, the MDV showed relatively small changes and induced a reduction in the RI. The PI and AI tend to lower with an increase in the degree of stenosis. A longer stenosis part indicates the greater degree of stenosis and increased resistance in the proximal part. With longer stenosis, therefore, clear PTP formation was demonstrated despite a low degree of stenosis. Despite the significance of stenosis in the formation of PTP, it was also demonstrated at a lower degree of stenosis when the compliance of blood vessels was greater. Therefore, a more accurate diagnosis might be achieved if compliance or factors impacting compliance are taken into consideration in a case where PTP was utilized as a surrogate marker to predict proximal vascular stenosis. In the presence of proximal stenosis, the systolic AI and RI increased in response to the increased resistance on distal blood vessels, thereby masking the formation of PTP. Therefore, the formation of PTP might be contrasted with lesser resistance on distal blood vessels, thus facilitating a diagnosis of a lower degree of stenosis. Rene et al. [20] reported that diagnostic sensitivity for renal artery stenosis could be improved by administrating captopril to achieve a reduction in the renal vascular resistance and maximize the formation of PTP.
In addition to resistance or compliance, renal arterial Doppler waveforms are influenced by various non-renal factors such as cardiac function, and anatomical structure of the blood vessels [13]. Cardiac functions affecting waveforms include systolic and diastolic pressure or time, pulse pressure, cardiac output, pulse rate, and others. Since these factors are profoundly associated, it is difficult to analyze them independently. The pulse rate decreased when the delay rate was prolonged when other controlled variables of the artificial were fixed. With decreased pulse rate, several parameters, specifically, the RI, PI, and AI, were increased. Mostbeck et al. [21] reported that a significant correlation was found between the RI and the heart rate. Since the bodyŌĆÖs compensatory responses serve to maintain a normal blood flow volume or blood pressure as the pulse rate decreases. When the pulse rate increases, the PSV remains almost the same while the RI is decreased with an increase in the EDV as the systole takes place without a sufficient period of diastole.
A limitation of our study concerns the difference in the compliance of the renal arteries in the human body and tubes in the phantom model. The range or volatility of compliance of two types of tubes in the phantom is wide and narrow, and the tube exchange only represents the increased or decreased compliance. Further, the tube length is far from reality. However, they reflect the effect of compliance on the Doppler waveform. Experimental models using animals are not suitable for the evaluation of the effect of vascular compliance because of the narrow range of alteration and difficulty in making changes to the compliance. Our phantom model mimics a kidney model and does not reflect the autoregulatory ability of the kidney. However, our experimental work in vitro showed considerable value in the interpretation of the effects of various variables on Doppler waveforms and would avoid some elements of uncertainty in the direction and magnitude of the changes in compliance or resistance.
On the basis of this research, it was possible to construct a mock renal blood flow model with low resistance, which facilitated the analysis of arterial Doppler waveforms in the renal blood flow, and evaluation of the factors that influenced the waveforms. The research showed that spectral Doppler waveforms of the artificial renal blood flow are influenced by many variables including vascular compliance and resistance. There was correlation between the distal resistance and RI, while there was no consistent tendency of the influence of the compliance on the changes in the PSV, RI, PI, AT, and AI. Without the changes in intrinsic factors such as compliance or resistance, the changes in the pulse rate showed an influence on the RI as an extrinsic factor. With decreased pulse rate, several parameters, specifically, the RI, PI, and AI, are increased. This research can help in providing fundamental information necessary in other experiments on Doppler waveforms and its application in the clinical studies.

 Download Citation
 PDF Links
 PubReader
 ePub Link
 Full text via DOI
 Full text via PMC


