

 Print
Print facebook
 twitter
 Linkedin
 google+

Introduction
Diffuse liver diseases have recently received increasing consideration due to their mounting incidence, with particular attention to hepatic steatosis [1], which is related to two main clinical-pathological entities: alcoholic fatty liver disease and nonalcoholic fatty liver disease (NAFLD). NAFLD affects approximately 90% of the obese population, as well as 15%-40% of the general population. NAFLD can result in a multistep progressive disease, potentially evolving into nonalcoholic steatohepatitis (NASH), advanced fibrosis (in approximately 25% of cases), cirrhosis (10%-20% of cases), and hepatocellular carcinoma (4% of cases) [2-4]. In NAFLD patients, the most important clinical end-points are the differentiation of NASH from simple hepatic steatosis and the identification of advanced fibrosis. Considering the increased risk of liver failure and hepatocellular carcinoma in patients with cirrhosis, it is of the utmost relevance to follow-up fibrosis evolution noninvasively in order to establish an appropriate treatment and avoid disease progression [5].
The reference standard for the diagnosis of hepatic fibrosis is liver biopsy, an invasive procedure with known complications that is prone to sampling errors, intra- and inter-observer variability, and limited repeatability. Among the various noninvasive methods as alternative tools for staging hepatic fibrosis, the currently mostused technique in clinical practice is transient elastography (TE; FibroScan, Echosens, Paris, France). However, this technique has some limitations, such as obesity (which was partially overcome by the introduction of a new XL probe), narrow intercostal spaces, and the presence of ascites. When using the conventional M probe, in patients with steatosis of >66% at liver biopsy, TE provides a higher false-positive rate in terms of liver stiffness (LS) measurements. Therefore, TE (using the M probe) may overestimate liver fibrosis in patients with a body mass index (BMI) >30 kg/m2 and severe steatosis [6].
Point shear-wave elastography (p-SWE) may represent an alternative to TE. SWE is integrated into conventional ultrasound equipment, enabling a rapid quantitative evaluation of LS [7]. SWE allows the operator to precisely visualize where the measurements are performed on B-mode ultrasound images, even in presence of ascites [8]. Preliminary results have shown high accuracy of p-SWE for the assessment of liver fibrosis in patients affected by chronic viral hepatitis [9-11], but few data are available regarding the comparison between p-SWE and TE, especially in patients with NAFLD [12,13] and to our knowledge, no prior study has assessed NAFLD using an RS80A ultrasound system. Therefore, in the last version of the European Federation of Societies for Ultrasound in Medicine and Biology (EFSUMB) guidelines on the clinical use of liver ultrasound elastography, recommendations are still lacking on the preferred first-line method for the assessment of hepatic fibrosis in patients with NAFLD [14].
The aim of our study was to prospectively assess the accuracy of p-SWE for the quantitative evaluation of LS in patients with NAFLD, in comparison with TE and liver biopsy, and to determine the optimal cutoff values for significant and advanced fibrosis.
Materials and Methods
This prospective study was approved by the Ethics Committee of University Hospital, a tertiary center for the treatment of chronic liver disease (Palermo 1 ID-2014). All subjects provided written informed consent for this study in accordance with the Declaration of Helsinki.
Population
Between March 2017 and November 2018, 56 consecutive adult patients with a histological diagnosis of NAFLD prospectively underwent TE (FibroScan, Echosens) and p-SWE (RS80A ultrasound system, Samsung Medison, Seoul, Korea) on the same day. The following exclusion criteria were considered: (1) a history of significant alcohol consumption (>21 standard drinks per week in men or >14 standard drinks per week in women) or virus-related chronic hepatitis; (2) a history of taking drugs that may cause steatosis, obstructive cholestasis, acute hepatitis, and infiltrative liver diseases, which may affect the reliability of LS measurements; (3) liver inflammation, as indicated by aspartate transaminase (AST) and/or alanine transaminase (ALT) elevation >5 times the normal limits. In addition, after performing p-SWE, 10 (17.8%) patients were excluded due to failure of more than 75% of the SWE measurements considering a qualitative numeric index (the Reliability Measurement Index [RMI]) automatically calculated by the SWE software and shown on the ultrasonography (US) device screen.
The same day of TE and p-SWE examinations, laboratory markers including ALT (IU/L), AST (IU/L), total cholesterol (mg/dL), and triglycerides (mg/dL), as well as BMI (kg/m2), were collected.
Imaging Techniques
All patients underwent TE performed with the FibroScan (Echosens) using the M or XL probe (46 and 10 patients, respectively). LS was assessed after at least 4 hours of fasting by a trained operator with more than 15 years of experience who had previously performed at least 300 examinations in patients with chronic liver disease. The probe was positioned at the level of the right liver lobe through the intercostal spaces with patients in the supine position with the right arm in maximum abduction. TE displayed the region of interest (ROI) in ultrasound A-mode and measured LS in a volume represented by a cylinder 1 cm wide and 4 cm long located between 25 mm and 65 mm below the skin surface. Uncorrected acquisitions are automatically ruled out from the US software. The results were expressed in kilopascals (kPa) and ranged from 2.5 to 75 kPa.
The most important parameter for assessing the reliability of TE evaluation is the interquartile range (IQR), which reflects the variability of the validated measures, and should not exceed 20%-30% of the median value. All LS measurements were classified into three reliability categories: (1) very reliable (IQR/M Ōēż0.10); (2) reliable (0.10<IQR/MŌēż0.30, or IQR/M >0.30 with LS median <7.1 kPa); or (3) poorly reliable (IQR/M >0.30 with LS median Ōēź7.1 kPa). Only patients with 10 valid measurements were included, and poorly reliable results were excluded from the analysis, without being further enrolled for SWE [15].
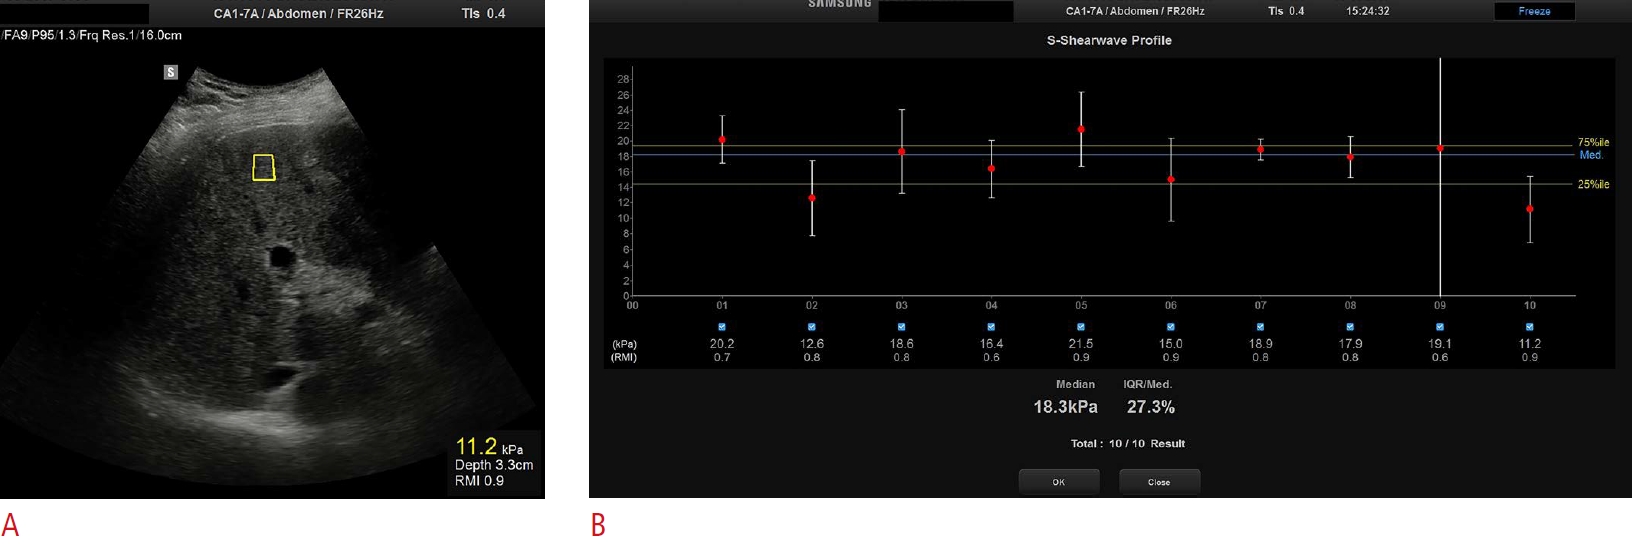
All p-SWE examinations were performed by one radiologist, blinded to biopsy and laboratory results, using an ultrasound machine (Samsung RS80A, Samsung Medison Co.) equipped with p-SWE software on a convex broadband probe (CA1-7A). All patients fasted for a minimum of 2 hours and rested for a minimum of 10 minutes before undergoing p-SWE evaluation. During the LS measurements, the probe was positioned on the right liver lobe, through the intercostal spaces with the patient lying in supine position with the right arm in maximal abduction. LS measurements were obtained as median values in kilopascals (kPa) from a rectangular ROI placed between 2 cm from the liver capsule and at a maximum depth of up to 5 cm beneath the skin in the hepatic parenchyma, carefully avoiding large intrahepatic vessels and biliary structures, and positioning the focus at the level of the ROI. During the LS measurements, patients were asked to stop breathing without a deep inspiration. For each measurement, the US equipment provided the RMI as an indicator of the calculated stiffness reliability, with a maximum value of 1. The US manufacturer developed this performance index through phantom and in vivo studies, since elastography data are often impaired by low signal-to-noise ratio, making the results unreliable. It is obtained by the weighted sum of the residual of the wave equation and the magnitude of the shear wave. Pre-established RMI cutoff values are highly correlated with reproducible measurements and can be utilized to rule out unreliable measurements, thereby improving shear wave elastography performance [16]. Only measurements with an RMI Ōēź0.6 and IQR/M ratios Ōēż30% were considered acceptable. Ten consecutive reliable measurements expressed in kPa were acquired in this study.
Reference Standard
Liver biopsy was considered as the reference standard and was performed in all patients within 1 month in order to confirm the final diagnosis of NAFLD/NASH and to grade liver fibrosis. All biopsy specimens were evaluated by a single experienced pathologist, who was blinded to the patients' clinical and LS results. Hepatic fibrosis was graded according to the Kleiner score for NAFLD, as follows: F0, absence of fibrosis; F1, perisinusoidal or periportal fibrosis; F2, perisinusoidal and portal/periportal fibrosis; F3, septal or bridging fibrosis; and F4, cirrhosis [17]. The NAFLD activity score (NAS), grade of steatosis (0-3), lobular inflammation (0-3), and hepatocyte ballooning (0-2) were also recorded for each patient [18]. For the purposes of this study, grades F2-F4 were defined as significant fibrosis, while grades F3-F4 were defined as advanced fibrosis.
Statistical Analysis
The statistical analysis was performed by an expert statistician, in order to (1) compare patients with valid and failed p-SWE; (2) assess differences in diagnostic performances using p-SWE with 10 measurements (SWE-10), the first five (SWE-5), and the first three (SWE-3) LS measurements; (3) calculate optimal TE and p-SWE cutoffs for the diagnosis of significant (F2-F3) and advanced (F3-F4) fibrosis; and (4) correlate TE and p-SWE measurements with histopathological and laboratory markers.
Continuous variables were expressed as mean and standard deviation. Categorical variables were expressed as numbers and percentages. Continuous variables were compared using analysis of variance and the independent t test, while categorical variables were compared using the chi-square test. Receiver operating characteristic (ROC) curves with 95% confidence intervals (CIs) and areas under the ROC curve (AUROCs with 95% CIs) were calculated to assess the diagnostic performance of successful TE and p-SWE measurements for the diagnosis of significant and advanced fibrosis. AUROCs for TE and p-SWE were compared using the DeLong test. Optimal cutoff values based on the Youden index of sensitivity and specificity, as well as alternative cutoffs for sensitivity Ōēź90% and specificity Ōēź90% were calculated. The correlations between TE, p-SWE, fibrosis, histopathological features of NASH (i.e., NAS, steatosis, inflammation, and ballooning), and laboratory markers (i.e., total cholesterol, triglycerides, AST, and ALT) was evaluated using the Spearman rank correlation coefficient (Spearman rho).
The statistical significance level was set at P<0.05, except for the Spearman rho, for which it was set at P<0.01 due to multiple comparisons. The statistical analysis was conducted using SPSS software version 20.0 (IBM Corp., Armonk, NY, USA).
Results
Population Characteristics
The demographic and histopathological characteristics in the study population are summarized in Table 1. The final study population included 46 patients (27 men, 19 women; mean age, 54.7┬▒9.1 years; range, 40 to 73 years) with NAFLD. Patients' BMI ranged from 21.2 to 40.4 kg/m2 (mean value, 29.4┬▒4.5 kg/m2). Diabetes was present in 18 patients (39.1%), whereas four patients (8.7%) had impaired fasting glycemia. Eleven patients (23.9%) presented cholesterol >200 mg/dL and six patients (13.0%) had triglyceride levels >175 mg/dL.
Through percutaneous liver biopsy, hepatic fibrosis was graded as F0 in four cases (8.7%), F1 in 15 cases (32.6%), F2 in nine cases (19.6%), F3 in five cases (10.9%), and F4 in the remaining 13 cases (28.2%). Overall, significant fibrosis (F2-F4) was present in 27 patients (58.7%), while advanced fibrosis (F3-F4) was observed in 18 patients (39.1%).
None of the patients had poorly reliable TE evaluations, whereas 10 (17.8%) subjects were excluded from the initial population due to failure of more than 75% of the SWE measurements. The excluded subjects had advanced (F3-F4) or significant (F2) fibrosis in nine cases (90.0%) and one case (10.0%), respectively. Compared to patients with successful p-SWE LS measurements, those with failed p-SWE measurements more frequently had advanced fibrosis (P=0.006), as well as having a higher BMI (mean, 33.7┬▒4.9 kg/m2; P=0.011), and higher TE LS measurements (mean, 28.9┬▒25.4 kPa; P<0.001).
Diagnostic Performance of TE and SWE
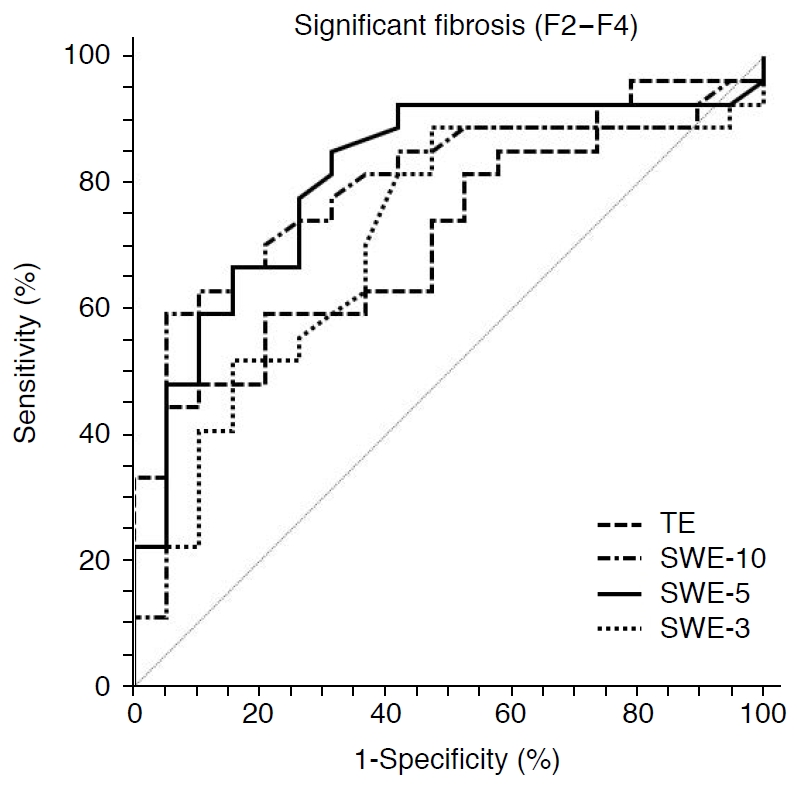
The diagnostic performance of TE and SWE is presented in Table 2. For the diagnosis of significant fibrosis, both SWE-10 (AUROC, 0.787; 95% CI, 0.646 to 0.927; P=0.002) and SWE-5 (AUROC, 0.809; 95% CI, 0.676 to 0.942; P=0.001) provided higher diagnostic performance than TE (AUROC, 0.719; 95% CI, 0.572 to 0.867; P=0.016) and SWE-3 (AUROC, 0.714; 95% CI, 0.560 to 0.869; P=0.021), although the differences among AUROC curves were not statistically significant (P=0.301) (Figs. 1, 2).
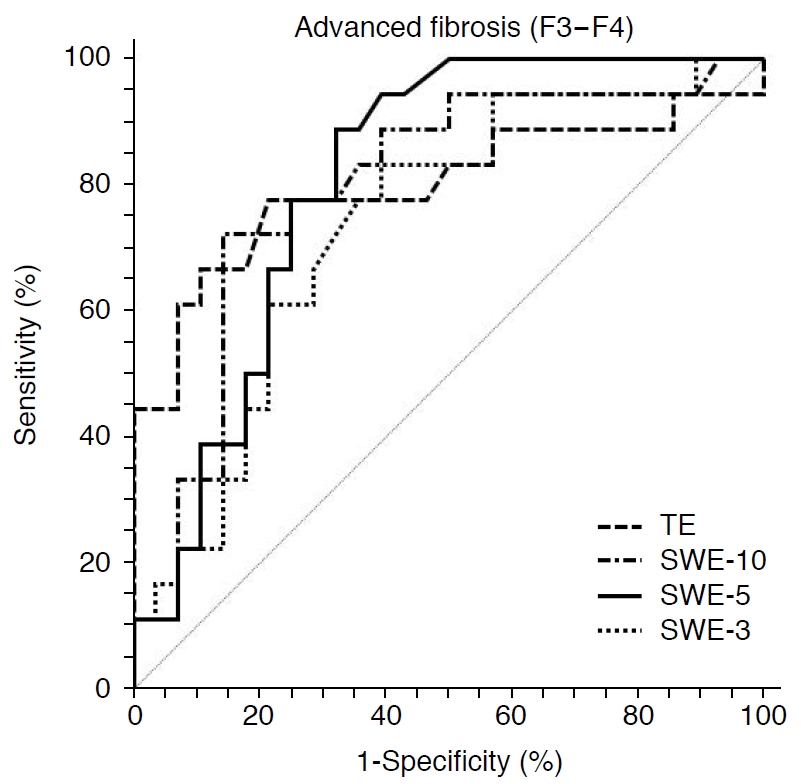
For the diagnosis of advanced fibrosis, SWE-5 showed a higher diagnostic performance (AUROC, 0.809; 95% CI, 0.684 to 0.933; P<0.001) than TE (AUROC, 0.799; 95% CI, 0.646 to 0.952; P<0.001), SWE-10 (AUROC, 0.797; 95% CI, 0.659 to 0.935; P<0.001), and SWE-3 (AUROC, 0.736; 95% CI, 0.587 to 0.885; P=0.003), although the differences among AUROC curves did not reach statistical significance (P=0.496) (Figs. 3, 4).
Optimal Cutoff for the Diagnosis of Significant and Advanced Fibrosis
The optimal cutoff values based on the Youden index of sensitivity and specificity are reported in Table 3. When using TE, an LS Ōēź7.9 kPa demonstrated a sensitivity of 63.0% and a specificity of 63.2% for the diagnosis of significant fibrosis, while an LS Ōēź8.5 kPa had a sensitivity of 77.8% and a specificity of 78.6% for the diagnosis of advanced fibrosis. When using the conventional SWE-10, an LS of Ōēź8.4 kPa demonstrated a sensitivity of 74.0% and a specificity of 73.7% for the diagnosis of significant fibrosis (Fig. 2), while an LS Ōēź9.1 kPa had a sensitivity of 72.2% and a specificity of 78.5% for the diagnosis of advanced fibrosis (Fig. 4). A slight increase in sensitivity, without a significant loss in specificity, was noted for the SWE-5 cutoffs of Ōēź7.8 kPa for the diagnosis of significant fibrosis and Ōēź8.8 kPa for the diagnosis of advanced fibrosis (sensitivity of 77.8% with both cutoffs).
Alternative cutoffs calculated in order to achieve the highest sensitivity and specificity (Ōēź90%) are presented in Table 4. When using TE, an alternative cutoff of 4.6 kPa increased the sensitivity of the diagnosis of advanced fibrosis to 94.4%, with a significant drop in specificity to 14.3%. Interestingly, an alternative cutoff of 7.6 kPa for SWE-5 increased the sensitivity to 94.4%, with little drop in specificity (60.7%) for the diagnosis of advanced fibrosis.
Correlations of LS Measurements with Clinical and Histopathological Parameters
Table 5 shows the correlations between LS measurements measured with TE and p-SWE and fibrosis grade, histopathological markers of NASH, and selected laboratory parameters. There were statistically significant correlations between TE and SWE-10 (P=0.001), SWE-5 (P=0.001), and SWE-3 (P=0.006). Statistically significant correlations were likewise observed between fibrosis grade and TE (P<0.001), SWE-10 (P<0.001), SWE-5 (P<0.001), and SWE-3 (P=0.005). LS measurements were significantly different in patients with and without diabetes using TE (P=0.006), SWE-10 (P=0.006), and SWE-5 (P=0.016), but not using SWE-3 (P=0.125).
Discussion
Our study demonstrated that p-SWE provided accurate results for the assessment of hepatic fibrosis in patients with biopsy-proven NAFLD, with a fair-to-good performance for the diagnosis of significant and advanced fibrosis. Compared to TE, there were no significant differences in diagnostic performances of SWE-10, SWE-5, or SWE-3 for the diagnosis of both significant (P=0.301) and advanced (P=0.496) fibrosis, although SWE-10 and SWE-5 had higher performance. Moreover, TE and different p-SWE measurements showed significant correlations with the fibrosis grade evaluated on biopsy specimens. Considering the widespread prevalence of NAFLD in the general population related to the increased prevalence of obesity and metabolic syndrome, our results may have significant relevance for the appropriate first-line noninvasive assessment of patients with NAFLD. Indeed, the presence of significant and advanced fibrosis is an independent predictor of liver-related mortality, and has been associated with an increased risk of hepatocellular carcinoma, cardiovascular mortality, and type 2 diabetes mellitus [19].
Limited literature exists comparing different methods for LS measurements in the same study population affected by NAFLD, especially in comparison with biopsy results [12,17,20,21]. Our results are concordant with those of Furlan et al. [20], who reported comparable diagnostic accuracy of SWE to conventional TE for the identification of significant and advanced fibrosis in NAFLD patients. In our study, the optimal cutoffs of Ōēź8.4 kPa and Ōēź9.1 kPa obtained by SWE-10 provided a sensitivity of 74.0% and a specificity of 73.7% for the diagnosis of significant fibrosis, and a sensitivity of 72.2% and a specificity of 78.5% for the diagnosis of advanced fibrosis, respectively. This evidence supports the use of p-SWE in clinical practice as a valuable alternative noninvasive method for the quantification of LS and a potential alternative to liver biopsy for the staging and follow-up of patients with NAFLD. SWE may have advantages over TE in patients with ascites or obesity, and may enable a simultaneous evaluation of focal liver lesions and LS measurements in patients undergoing surveillance for NAFLD [6].
Moreover, our study assessed the performance of the p-SWE technique with fewer measurements. In agreement with other recent evidence evaluating cohorts with different etiologies of chronic liver disease, we observed that SWE-5 provided the highest diagnostic performance (AUROC), sensitivity, and specificity for both significant (0.809, 77.8%, and 73.4%, respectively) and advanced fibrosis (0.809, 77.8%, and 75.0%, respectively) with respect to SWE-10 and for significant fibrosis with respect to TE, even if the differences were not statistically significant [22,23]. Interestingly, when exploring alternative cutoffs for maximizing sensitivity and specificity, SWE-5 with a cutoff of Ōēź7.6 kPa yielded an increase in sensitivity to 94.4%, with only a slight drop in specificity (60.7%) for the diagnosis of advanced fibrosis. In contrast, SWE-3 showed the lowest performance (AUROC, sensitivity, and specificity) for both significant (0.714, 66.7%, and 63.2%, respectively) and advanced fibrosis (0.736, 66.7%, and 71.4%, respectively). Although current guidelines still recommend a minimum of 10 valid measurements for the appropriate p-SWE examinations, conducting an evaluation with five valid LS measurements may potentially save time during examinations in clinical practice, without compromising the diagnostic performance for the assessment of hepatic fibrosis [14].
In our study, LS measurements by TE and p-SWE showed significant correlations with fibrosis grade, while no correlations were observed for BMI, histopathological markers of NASH, or laboratory results. However, in a non-negligible proportion of patients (17.8% of the initial cohort), LS measurements by p-SWE failed. In particular, patients with failed p-SWE more frequently had advanced fibrosis (90.0% vs. 39.2%, P=0.006), and also had higher BMI (mean, 33.7┬▒4.9 kg/m2; P=0.011) and higher TE measurements (mean, 28.9┬▒25.4 kPa; P<0.001) than patients with valid LS measurements. Cassinotto et al. [12], along with other evidence, also reported fewer reliable results in patients with a BMI Ōēź30 kg/m2 and a waist circumference Ōēź102 cm [16,24]. We speculate that, in our study population, this non-negligible percentage of failed p-SWE could be related to US equipment technology. Of note, the US equipment is undergoing constant updates, and the latest version deems the results to be reliable when the RMI is Ōēź0.4 instead of the previously suggested value of Ōēź0.6. This technical aspect could potentially decrease the percentages of failed p-SWE measurements, and applying this cutoff would have allowed us to include many more patients in our study.
It should also be noted that, on the basis of the current literature, each ultrasound equipment is different from the others, with particular reference to quantitative evaluation and optimal SWE cutoff values to classify significant and advanced liver fibrosis, which are specific for each ultrasound machine. Indeed, different software methods can be used to measure shear wave arrival time and speed [25]. This could be considered a limitation of p-SWE, since a reliable follow-up should always be performed in the same patient using the same US machine. In our study, according to EFSUMB guidelines, we evaluated all patients using the same US equipment by the same manufacturer; as such, we report our experience with this specific US equipment. Therefore, cutoff values are different for other US machines, even if the p-SWE technique has been well-known for some years. It should be also noted that an unquestionable advantage of TE with respect to p-SWE is the capability to quantify liver fatty content by using the controlled attenuation parameter (CAP), which measures ultrasound beam attenuation (a parameter directly related to the amount of steatosis), and enables the stratification of each patient in a different stage (no steatosis; mild, moderate, or severe steatosis) with a robust correlation with biopsy results. CAP measurements are important for the TE LS evaluation since LS can be overestimated in patients with high CAP values, which has led to the adjustment of TE cutoff values and the development of new ultrasound software [26-28]. Moreover, before performing SWE, confounding factors should be assessed to prevent the overestimation of LS measurements; patients with liver inflammation (AST and/or ALT elevation >5 times the normal limits), obstructive cholestasis, liver congestion, acute hepatitis, and infiltrative liver diseases should be excluded before measuring LS, as recommended by EFSUMB guidelines [14].
Our study has multiple limitations that need to be acknowledged. First, our study population was limited by the relatively small number of prospectively-enrolled patients in a single Institution related to our selection criteria and the RMI cutoff values considered to indicate reliable measurements. The final number of included patients and the exclusion of patients with failed SWE measurements may have limited the evaluation of differences in diagnostic performance between TE and p-SWE with different measurements. However, all the included subjects underwent histopathological examinations with percutaneous liver biopsy within 1 month and underwent laboratory tests on the same day of TE and p-SWE evaluation. Second, p-SWE was performed by a single radiologist, therefore, inter-reader agreement could not be evaluated. Other studies have already investigated the inter- and intra-reader reproducibility of SWE techniques [29]. Finally, our population included only four patients lacking fibrosis (F0) on biopsy specimens.
In conclusion, TE and p-SWE had similar fair-to-good diagnostic performance for the diagnosis of biopsy-proven significant and advanced fibrosis in patients with NAFLD.

 Download Citation
 PDF Links
 PubReader
 ePub Link
 Full text via DOI
 Full text via PMC


