

 Print
Print facebook
 twitter
 Linkedin
 google+

Introduction
Fatty liver is the accumulation of fat within the hepatic parenchyma. It can induce various inflammatory cytokines, and approximately 20% to 30% of patients with fatty liver may develop histologic signs of fibrosis and necroinflammation, indicating the presence of non-alcoholic steatohepatitis [1,2]. In addition, incidentally-identified fatty liver disease may enable the early detection of associated medical diseases such as diabetes mellitus, hypertension, hypertriglyceridemia, and low levels of high-density lipoprotein cholesterol, which are major features of metabolic syndrome [3,4].
Ultrasonography (US) is the primary method for the reliable and accurate detection of fatty liver due to its low cost, absence of radiation exposure, and easy accessibility [5]. The recent guidelines for management of non-alcoholic fatty liver disease (NAFLD) [6] present US as an important part of the routine work-up for screening NAFLD in patients with obesity or metabolic syndrome. However, the sonographic evaluation of fatty liver is based on subjective interpretations of hepatic echogenicity and posterior attenuation of the US beam and has limitations due to interobserver and intraobserver variability [7].
To overcome these limitations, the hepatorenal index (HRI) has been used as a specific US parameter that allows for a more objective evaluation of hepatic steatosis [8]. It evaluates fatty liver by comparing the brightness of the liver to that of the right kidney, and has been reported to be a quantitative method that is more reproducible and less operator-dependent for the evaluation of fatty liver [9,10]. However, it is still operator-dependent to some degree due to the need to select the region of interest (ROI) for the HRI calculation. In addition, quantitative measurements of HRI values are time-consuming since additional manual processing is necessary, which therefore limits the routine use of the HFI in daily practice. Recently, considerable interest has emerged in applications of deep learning with convolutional neural networks (DCNN) to medical imaging in various subspecialties [11-13]. However, no study has yet developed a DCNN for automatically calculating the HRI using grayscale US images.
In this study, a DCNN was developed for fully-automatic quantification of the HRI, and its accuracy was evaluated in comparison with the measurements of experienced radiologists.
Materials and Methods
Compliance with Ethical Standards
The institutional review board approved the study at Samsung Medical Center in Korea (SMC 2019-08-089), and the requirement for informed consent was waived due to retrospective nature of the study using fully-anonymized US images.
Study Overview
This retrospective study was conducted at a tertiary academic referral center, Samsung Medical Center, Sungkyunkwan University School of Medicine, Seoul, Korea. Technical support was provided by Samsung Medison and Samsung Electronics (Seoul, Korea). However, the authors had full control of the data and information submitted for publication.
Subjects
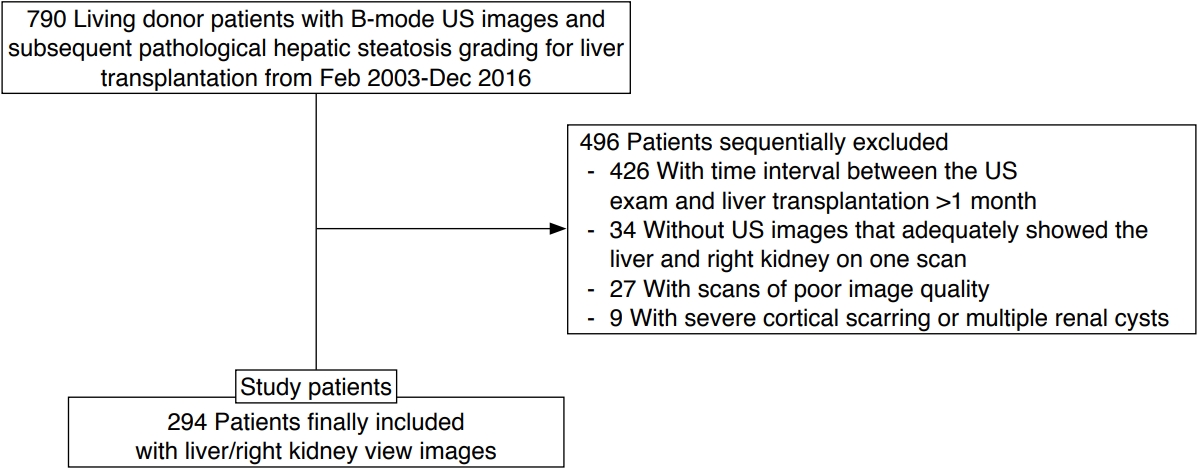
US images of healthy adults who underwent US as a routine work-up before living-liver donation surgery were selected for algorithm validation. This is because living-liver donors have no known underlying chronic liver or renal disease, and their degree of fatty liver, if any, is routinely quantified histologically during donation surgery at the authors’ medical center. To identify these subjects, electronic medical records were searched for subjects who underwent living-liver donation surgery between February 2003 and December 2016, and identified 790 subjects. Among them, only those who underwent a US examination before surgery were initially included. One radiologist reviewed the US images of the subjects and sorted out images that were inappropriate for measuring the HRI based on the following exclusion criteria: (1) the time interval between the US exam and liver transplantation was more than 1 month (n=426), (2) subjects without a US image that adequately showed the liver and right kidney in one scan (n=34), (3) poor image quality (n=27), and (4) difficulty of measurement of renal brightness due to cortical scarring or multiple renal cysts (n=9). The reasons for poor image quality included motion artifacts and posterior acoustic shadowing from ribs that obscured the liver and/or the right kidney, from which the appropriate measurements of hepatic and/or renal brightness were unable to be obtained. Ultimately, 294 subjects with 294 liver/right kidney view images were selected for this study (Fig. 1).
US Examination
The US examinations were performed using one of the following US systems: iU22, HDI UM-9 or -3000 or -5000 (Philips Medical Systems, Bothell, WA, USA), LOGIQ E9 (General Electric Medical Systems, Milwaukee, WI, USA), and Acuson Sequoia 512 or model 128XP (Siemens Medical Solutions, Mountain View, CA, USA) by radiologists. According to the clinical guidelines of the Korean Society of Ultrasound in Medicine, a sagittal or oblique US image showing the liver and right kidney in one scan was one of the views on the routine checklist, which is necessary for HRI measurements. During the US exam, various imaging parameters including gain, focal zone, depth, and dynamic range were optimized by the radiologist performing the US scans to obtain adequate images.
Data Preprocessing
Each subject’s US images were archived as a Digital Imaging and Communications in Medicine (DICOM) file using a commercial picture archiving and communication system (Centricity; GE Healthcare). The selected US images showing the liver and right kidney were retrieved and de-identified for anonymization. The US DICOM images were converted into Portable Network Graphics format and resized to 640×480. All preprocessing steps were conducted using Python 3.5 (Python Software Foundation, 2009).
Automated HRI Calculation Algorithm
The HRI was defined as the relative brightness of the hepatic parenchyma compared to that of the renal parenchyma, and was measured by dividing the mean brightness level of the ROI pixels in the hepatic parenchyma by that of the pixels in the renal parenchyma [10]. The algorithm for HRI calculation consisted of four steps: liver and kidney segmentation, kidney ROI extraction, liver ROI extraction, and calculation of the HRI. For automatic organ segmentation, the DCNN was developed with the Image Cascade Network (ICNet) using a computer equipped with an Intel Xeon Gold 5118 CPU at 2.30 GHz and 2.29 GHz (Intel, Santa Clara, CA, USA), 128 gigabytes of RAM, and two Nvidia Quadro P5000 graphic processing units (NVIDIA, Santa Clara, CA, USA). ICNet is a modified model of a pyramid scene parsing network, which has high segmentation performance. It performs segmentation based on three different resolution branches. Semantic predictions are extracted on low-resolution branches to reduce the computation time. Medium- and high-resolution branches help recover and refine the coarse prediction to achieve high-quality segmentation [14]. The implementation of ICNet was based on Keras 2.2.4 with a TensorFlow 1.13.1 backend machine. It was trained and validated using 2,021 abdominal US images (1,377 for training, 250 for validation, and 294 for testing) which were collected in the authors’ previous study of a DCNN for the quantification of hepatic fibrosis [15]. Anatomical markings for the boundary of the liver and kidney were manually drawn by a technician and confirmed by one radiologist. A threshold value of more than 50% of the probability map was applied for the segmentation of the liver and the kidney. Only maximum-sized objects among the segmentation results were used as final results. In the independent test set (n=294) from the authors’ previous study [15], the accuracy of the segmentation compared against the gold standard was 89.4% in the kidney using the Jaccard index, which measures dissimilarity between two samples as intersection over union. Only 1% had a Jaccard index of under 70%, and the automated HRI calculation did not fail in any cases. In the liver, the segmentation accuracy was 76.6% using the same Jaccard index.
Regarding kidney ROI extraction, a normalized distance map that computed the distance between every pixel position and the center position of the mask was applied in order to separate the outer area from the kidney using 0.5 as the threshold value. Gaussian mixture modeling with three brightness classes was adopted to extract only the cortex and to avoid other anatomical structures and image artifacts. The brightest class had a range higher than that of the cortex, such as the calyx and renal pelvis. The area containing the median brightness class was considered to be the renal cortex. The lowest class was clustered lower than the cortex brightness, such as medullary pyramids and image artifacts caused by rib shadows. To extract the kidney ROI from the homogeneous parenchyma area, the sliding window technique was used to identify the location having minimum variation with the average value of the median class of Gaussian mixture modeling [16].
The liver ROI was located in the liver parenchyma area and had similar depth to the kidney ROI to minimize the brightness variation. Three classes of Gaussian mixture modeling were also used to extract only liver parenchyma, avoiding other anatomical structures and image artifacts. The brightest class was assumed to be the range higher than that of the parenchyma, such as the vessel wall. The area containing the median class was considered to be liver parenchyma. The lowest class was darker than the parenchyma and was considered to be vessel and rib shadowing. The ROI was extracted by the same algorithm used for kidney ROI extraction. Finally, liver and kidney ROIs measuring 15×15 mm2 were extracted and the HRI value was calculated as the ratio of the average brightness of the liver and kidney ROIs (Fig. 2).
Agreement of the Measured HRI between the DCNN and Radiologists
To compare measurements of the HRI between the automated HRI algorithm and the radiologists, a dedicated application made using Python 3.5 was used. It randomly displayed an anonymized grayscale US image from 294 patients. First, the automated algorithm using DCNN calculated each HRI from 294 subjects using grayscale US images. Then, two board-certified radiologists (D.I.C. and T.W.K. with 8 and 13 years of experience in performing and interpreting abdominal US images, respectively) were independently asked to draw ROIs on the liver and the kidney on the US images to measure the HRI values using same dataset as the simulation test program (Fig. 3). The average echogenicity of each ROI and the HRI were automatically calculated.
Statistical Analysis
To evaluate the intraobserver agreement, each radiologist measured the HRI two times. After the first measurement session, a 4-week interval was given until the second session to minimize learning bias. In addition, interobserver agreements between the first and second hepatic and renal brightness measurements and the calculated HRI were evaluated for each radiologist. Intraclass correlation coefficients (ICCs) were calculated to evaluate intraobserver and interobserver agreements of the same task by both radiologists and between the average values of the two radiologists and the DCNN. In addition, a Bland-Altman plot was used to analyze intraobserver agreement. The interpretation of ICCs was as follows: poor agreement was shown by an ICC of 0-0.50, moderate agreement by an ICC of 0.51-0.70, high agreement by an ICC of 0.71-0.90, and excellent agreement by an ICC of 0.91-1.0 [17]. Statistical analyses were performed using SAS version 9.4 (SAS Institute Inc., Cary, NC, USA). A P-value of <0.05 was considered to indicate statistical significance.
Results
Subject Characteristics
Table 1 shows the baseline characteristics of the 294 subjects. There were 205 men (69.7%), 95 subjects (32.3%) had a normal liver, 198 subjects (67.3%) had mild fatty liver, and one subject (0.3%) had a moderate degree of fatty liver on histology. No subjects had severe fatty liver or diabetes mellitus. Three subjects (1.0%) were receiving medication for hypertension.
Intraobserver and Interobserver Agreement of the Measured Brightness Values of the Liver and the Right Kidney, and the Calculated HRI Values between Two Radiologists
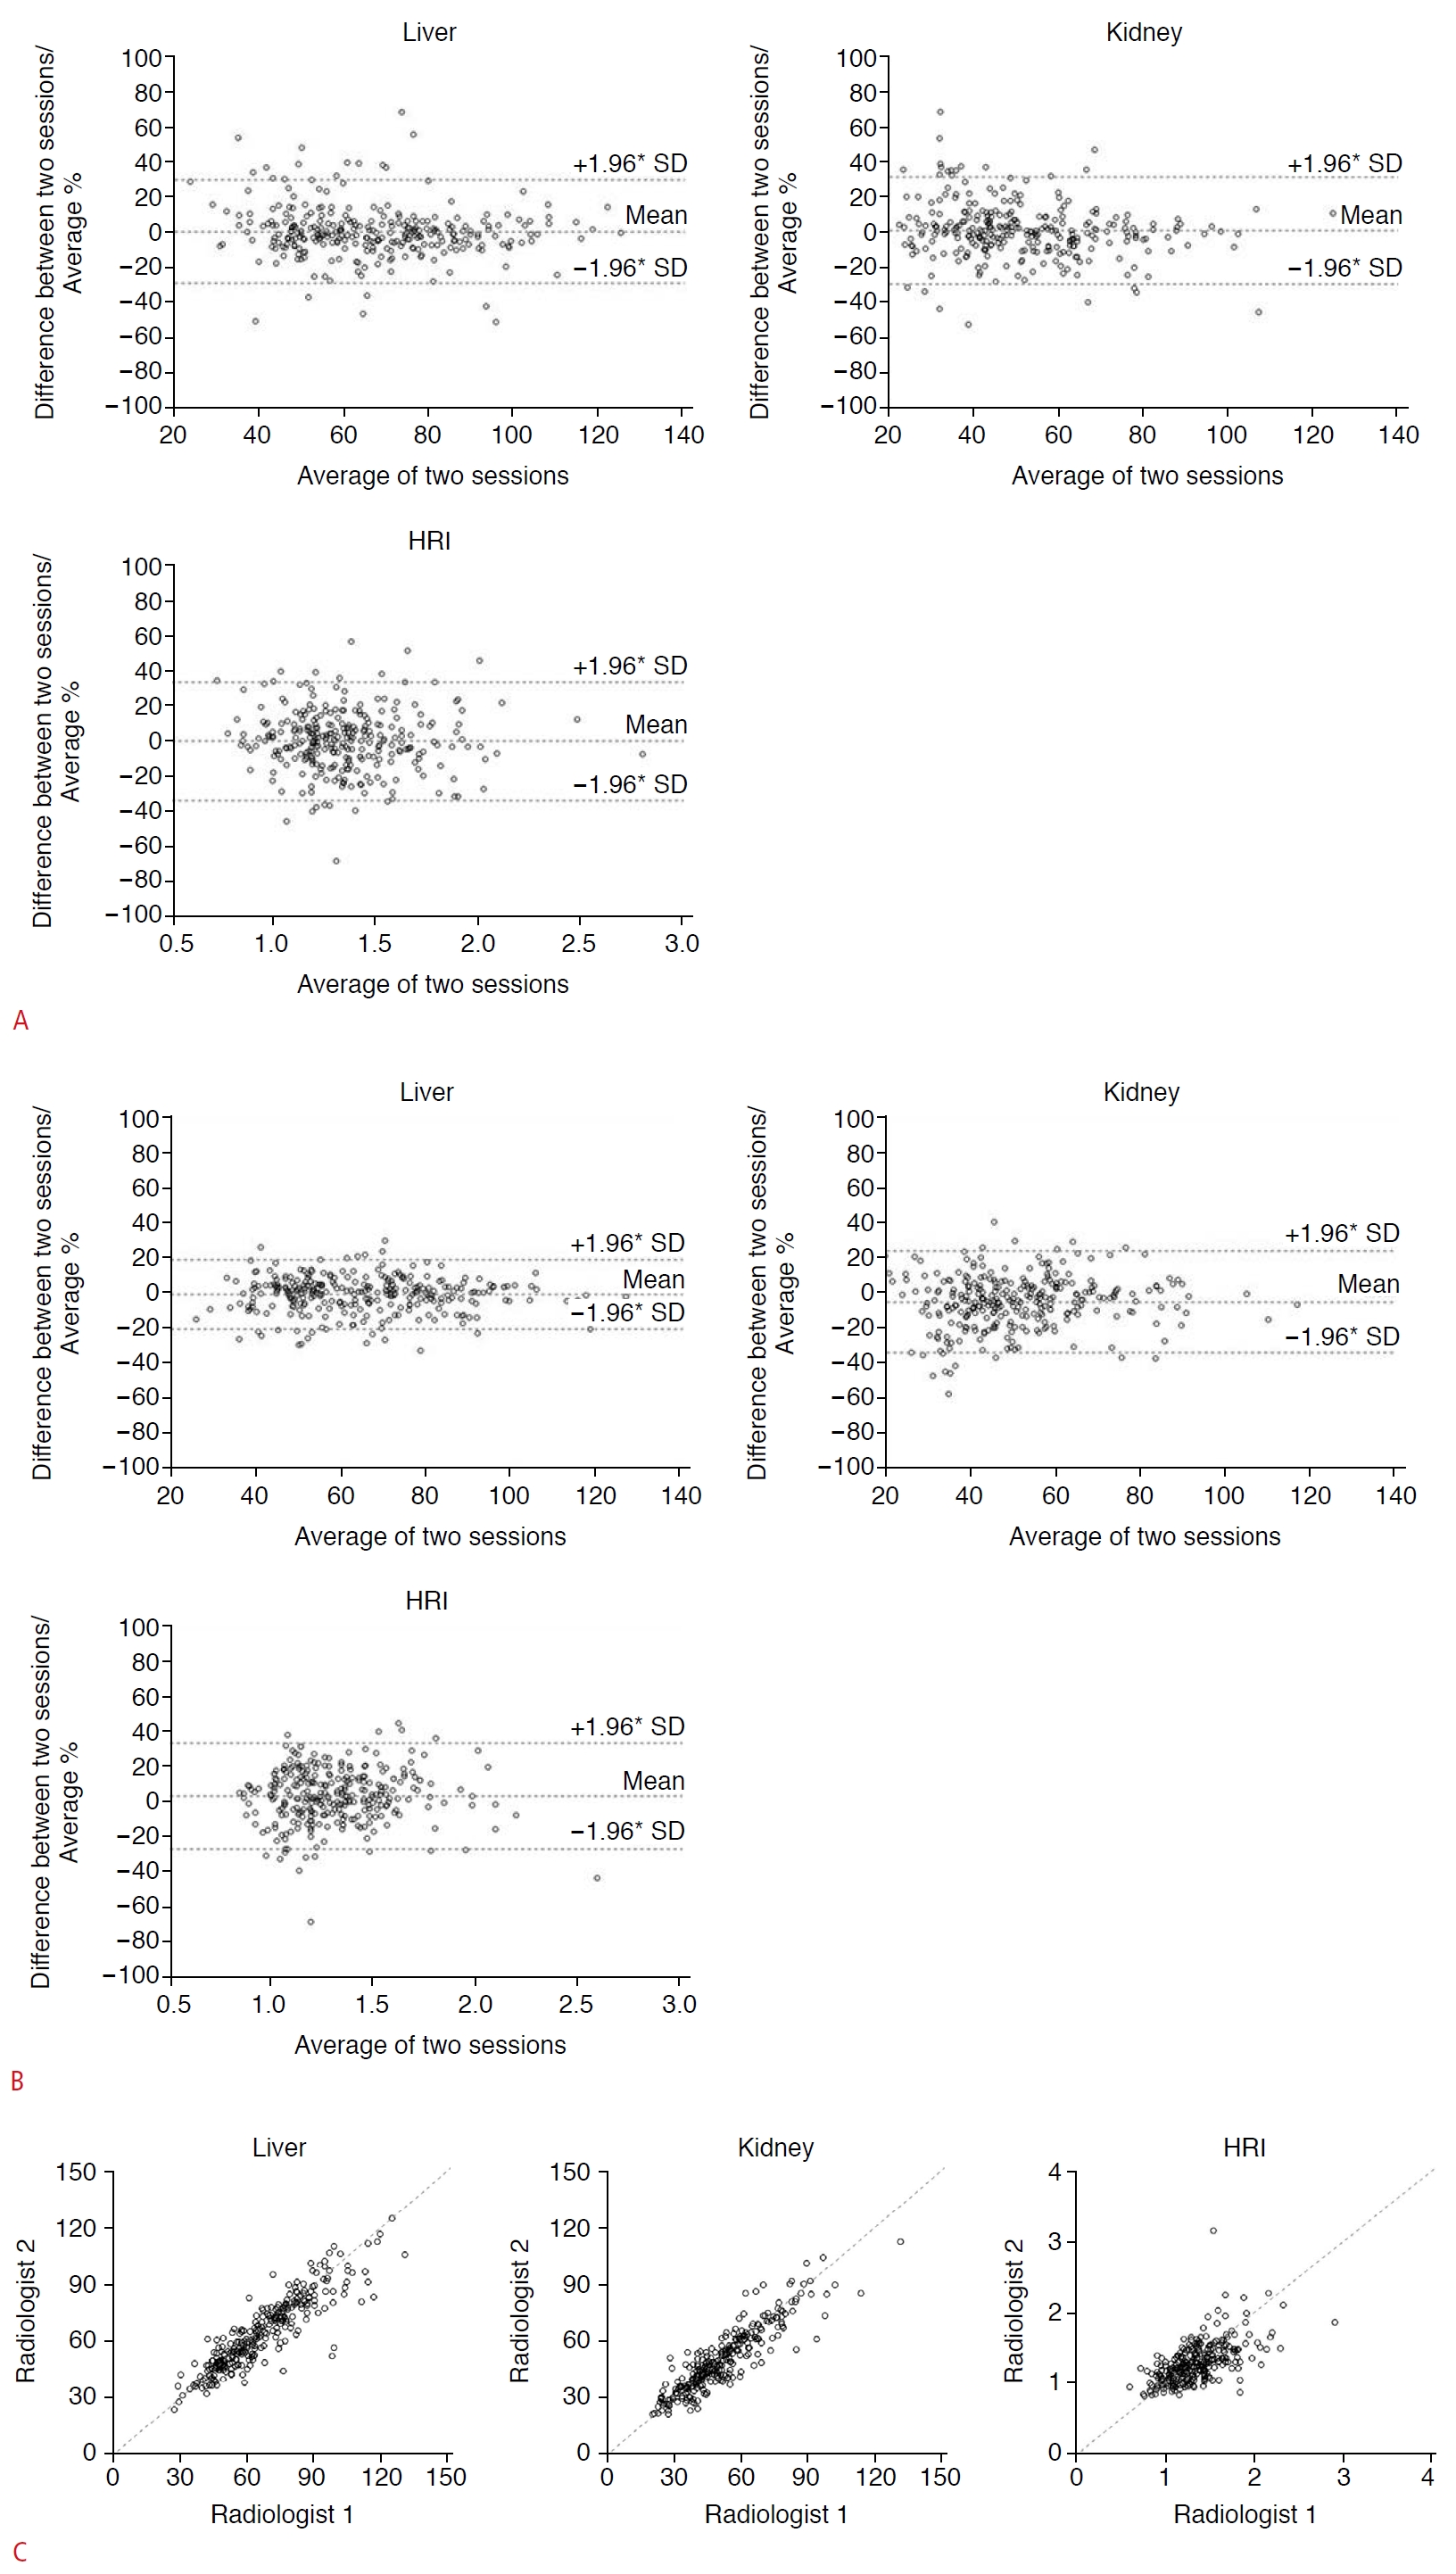
The results of the measured brightness values of the liver and the right kidney, and the calculated HRI values of the two radiologists are shown in Table 2. The ICCs between the first and second sessions for hepatic and renal brightness measurements and the calculated HRI were 0.878 (95% confidence interval [CI], 0.849 to 0.902), 0.905 (95% CI, 0.882 to 0.924), and 0.701 (95% CI, 0.638 to 0.755) for the first observer and 0.935 (95% CI, 0.919 to 0.948), 0.890 (95% CI, 0.863 to 0.911), and 0.703 (95% CI, 0.641 to 0.757) for the second observer, respectively; they ranged from high to excellent agreement. The ICCs for interobserver agreement between the two radiologists for hepatic and renal brightness measurements and the calculated HRI were 0.892 (95% CI, 0.866 to 0.913), 0.898 (95% CI, 0.873 to 0.918), and 0.681 (95% CI, 0.615 to 0.738) for the first session and 0.920 (95% CI, 0.901 to 0.936), 0.874 (95% CI, 0.844 to 0.898), and 0.579 (95% CI, 0.497 to 0.650) for the second session, respectively; these values ranged from moderate to excellent agreement (Table 3, Fig. 4).
Interobserver Agreement between Radiologists and the DCNN
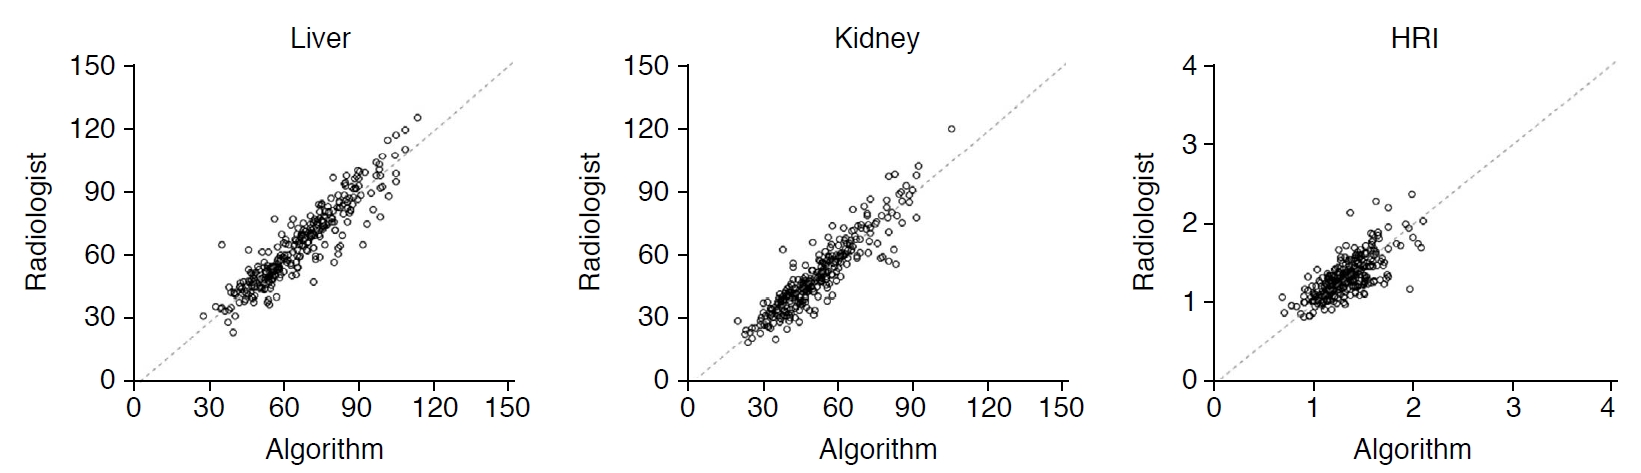
The ICC of the hepatic and renal measurements and the calculated HRI between the average values of the two radiologists and DCNN were 0.919 (95% CI, 0.899 to 0.935), 0.916 (95% CI, 0.895 to 0.932), and 0.734 (95% CI, 0.676 to 0.782), respectively, showing high to excellent agreement (Table 3, Fig. 5). The mean time for automatic HRI calculation using grayscale US images by the DCNN was 80 ms (range, 75 to 134 ms).
Discussion
The results of this study showed that a DCNN could automatically measure the HRI with similar performance to that of experienced board-certified radiologists. The degree of agreement between the radiologists and the DCNN was excellent for hepatic measurements, and high for renal measurements and HRI calculations. This implies that software using a DCNN can calculate the HRI as well as experienced radiologists.
Previous studies regarding US assessments of fatty liver reported that there was considerable intraobserver and interobserver variability when grayscale US images were used to evaluate fatty liver, with kappa values ranging from 0.21 to 0.63 [7,18]. In contrast, use of the HRI can improve the reproducibility of assessment of hepatic steatosis on US examination [19]. In the results of this study, the intraobserver agreement for the HRI, with ICCs ranging from 0.701 to 0.703, was higher than the interobserver agreement between the radiologists, with ICCs ranging from 0.579 to 0.681. This could suggest that there remains room for improvement in quantitative HRI measurements as a less operator-dependent method of fatty liver diagnosis. In this regard, the algorithm presented herein does not require selecting the ROI to quantify liver and kidney brightness manually and can overcome this source of subjectivity. In addition, its robustness based on the high interobserver agreement between radiologists and the DCNN (ICC, 0.734), could increase the clinical value of US in assessing fatty liver. If this algorithm is mounted in a commercially available US machine, it could enable calculation of the HRI by simply showing the liver and right kidney on a single US image plane without the need for additional manual post-processing.
A recent study [20] that used transfer learning with DCNN for assessing steatosis with grayscale US images showed that DCNN-based feature analysis showed similar diagnostic performance compared to the classical HRI in terms of classification of mild fatty liver. However, their DCNN selected for the unknown features of grayscale US images in patients with hepatic steatosis, unlike the intuitive HRI calculation. The corresponding method did not explain how the deep learning algorithm weights from the US image features contributed to the final decision layer, and interpretation of its output would be difficult [21]. Thus, the role of the DCNN was limited to segmentation of the liver parenchyma and right kidney, and the HRI as a final output was obtained by a mathematical calculation with Gaussian mixture modeling [16] since the HRI would be more eidetic and more generalizable for use in routine clinical practice.
There are several limitations of this study. First, this was a retrospective study, composed of subjects who were donors for liver transplantation. This would have led to selection bias as most liver donors would be healthy. Thus, it is not certain whether the algorithm described herein can be applied to moderate or severe fatty liver as well as subjects with chronic liver or renal disease, which can make segmentation of liver and kidney difficult. Second, since the image data only included several major US machine vendors, the algorithm may not work effectively with US images from machines made by other manufacturers. Third, the accuracy of liver segmentation was less accurate than that of kidney segmentation due to posterior acoustic shadowing from the rib and lung. However, there were no cases in which automated ROI extraction failed, because the algorithm mainly focused on the part of the liver that was close to the right kidney, rather than the entire liver. Fourth, new indicators of hepatic steatosis developed directly from the DCNN were not created. Instead, this study analyzed the HRI, which is already widely used, for better generalizability and usability in daily practice. Finally, the algorithm using the DCNN was not externally validated in other environments. Further prospective studies using this algorithm with subjects with various degrees of fatty liver are needed to confirm whether the automatically calculated HRI is effective for assessment of patients with moderate to severe fatty liver in real clinical practice. In addition, a comparative analysis of the accuracy of liver fat quantification with other recently introduced US technologies will be needed [22,23].
In summary, the DCNN accurately measured liver and right kidney brightness on B-mode US images and automatically calculated HRI. It achieved similar performance to that of radiologists for calculation of the HRI in patients with normal or mild fatty liver. The simplicity of US examinations with automated quantitative HRI calculations may provide a more reliable and objective method for mass screening and longitudinal evaluation of fatty liver.


 Download Citation
 PDF Links
 PubReader
 ePub Link
 Full text via DOI
 Full text via PMC


