

 Print
Print facebook
 twitter
 Linkedin
 google+

Introduction
The assessment of the status of cervical lymph nodes is critical in clinical decision-making, especially in terms of whether they are malignant or benign. Cervical lymph node assessment can predict the prognosis and contribute to the management plans of patients with primary tumors in other places [1]. Conventional ultrasonography (US) is the first choice of imaging modality for diagnosing malignant cervical lymph nodes preoperatively. It can characterize the distribution and morphology of superficial lymph nodes, including their shape, border, internal structure, and vascularity [2]. However, there are no standardized criteria for US in the diagnosis of malignant lymph nodes with satisfactory sensitivity and specificity [3,4].
In recent years, US elastography has been introduced to measure the elasticity of lymph nodes, which is a parameter based on the strain or deformation in response to a physical force related to the degree of malignancy, as most malignancies reliably exhibit reduced elasticity and increased stiffness due to the nature of neoplastic growth [5]. Elastography can be divided into quasi-static elastography and shear wave elastography, including supersonic shear impulse (SSI) elastography and acoustic radiation force impulse (ARFI) elastography. Quasi-static elastography involves collecting numerical data with a quasi-static method, such as the elasticity score, which is a qualitative classification, and the strain index or the muscle-to-lymph node strain ratio, which are often considered as semiquantitative; this technique is widespread and has been extensively studied. A meta-analysis of quasi-static elastography demonstrated that the summary sensitivity and specificity for diagnosing superficial malignant lymph nodes were 0.74 and 0.90 for the elasticity score and 0.88 and 0.81 for the strain ratio, respectively [1]. SSI elastography is an objective and quantitative modality, which is less operator-dependent. SSI elastography analyzes tissue stiffness using the elastic modulus (kPa), which provides absolute quantification of lymph node elasticity [6], while ARFI uses the shear wave speed (m/s) for the quantitative analysis. In addition, SSI elastography does not require freehand compression, making it independent of the compression technique [6].
A previous systematic review reported that the sensitivity and specificity of shear wave elastography in the diagnosis of cervical lymph nodes were 0.81 and 0.85, respectively [3]. However, that study used the maximum elastic modulus for SSI and shear wave velocity (m/s) for ARFI as a cutoff value, and did not systematically provide results for the maximum, mean, minimum, and standard deviation (SD) values of the elastic modulus. Furthermore, studies of SSI elastography for evaluating cervical lymph nodes have been carried out in small and selected patient samples, and have had observational designs. Therefore, this study was conducted to provide new clinical evidence regarding differences in elastic modulus values using SSI elastography between malignant and benign cervical lymph nodes and the diagnostic performance of SSI elastography for diagnosing malignant cervical lymph nodes.
Materials and Methods
This systematic review and meta-analysis of diagnostic test accuracy was conducted following the Preferred Reporting Items for Systematic Review and Meta-Analyses (PRISMA) extension for diagnostic test accuracy statement [7]. This systematic review and meta-analysis was registered with PROSPERO (https://www.crd.york.ac.uk/prospero/) with an ID of CRD42020165574.
Literature Search
A systematic search was conducted in PubMed, Embase, and Cochrane Library Central Register of Controlled Trials databases up to December 1, 2020. The search strategy employed Boolean logic to merge discrepant concepts and synonyms. The search terms were the following: (cervical lymph node OR neck lymph node OR cervical lymphadenopathy OR neck node OR cervical node) AND (elastography OR sonoelastography OR sonoelastography OR supersonic imaging OR supersonic shear imaging OR supersonic shear wave elastography OR supersonic shear-wave elastography). Two independent investigators first screened the title and abstract of each article. The references of the eligible articles and reviews were then screened.
Eligibility Criteria
First, English studies or their subsets that reported SSI elastography data as a predictor of malignant cervical lymph nodes, were eligible for inclusion. Then, the final diagnoses of cervical lymph nodes were determined based on histopathology reports after surgery or fine-needle aspiration biopsy. The exclusion criteria were as follows: (1) articles that did not fall within the scope of this review; (2) review articles, editorials or letters, comments, and conference proceedings; (3) case reports or case series.
Data Extraction
Descriptive data were extracted by one investigator and then confirmed by another researcher. The extracted descriptive data included the study characteristics (authors, year of publication, region, study design, duration of patient recruitment, and sample size), clinical characteristics (the number of lymph nodes, both benign and malignant, patient age, type of primary tumor, elastic modulus [kPa] and cutoff values), and diagnostic accuracy test characteristics. Two reviewers independently extracted the numerical data. Inconsistent extractions were resolved by consensus. When the data were not extractable, an attempt was made to contact the corresponding authors for additional data.
Quality Assessment
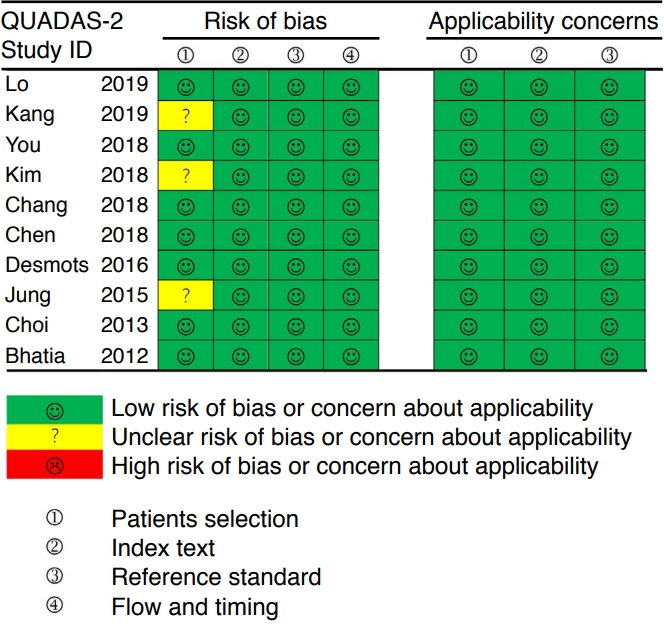
Two reviewers independently assessed the risk of bias and concerns about applicability based on the Quality Assessment of Diagnostic Accuracy Studies 2 (QUADAS-2) tool [8]. Discrepancies were resolved by consensus.
Data Synthesis
For all mean, maximum, minimum, and SD values of the elastic modulus, the mean difference (MD) with a 95% confidence interval (CI) was analyzed. Heterogeneity was examined using the Q-test and the I2 statistic. When studies were heterogeneous (P<0.1 or I2>50%), a random effects model was used; otherwise, a fixed effects model was applied [9].
For diagnostic characteristics, a Bayesian bivariate model was implemented using integrated nested Laplace approximation (INLA) [10]. Accurate posterior marginal distributions for sensitivity and specificity, as well as all hyperparameters and covariates, were directly obtained by a bivariate model with no need for conventional Markov-chain Monte Carlo sampling [11,12]. Further, univariate estimates of sensitivity and specificity with 95% credible intervals (CrIs), as well as the summary receiver operating characteristic (SROC) curve, were directly available for interpretation. Moreover, the area under the receiver operating characteristic curve (AUC) values with 95% CrIs were calculated. The summary positive and negative likelihood ratios (LR+ and LR-, respectively) were calculated from the summary sensitivity and specificity estimates, and the same procedure was carried out for diagnostic odds ratios (ORs) and risk difference (RD). Alternative models were compared using the deviance information criterion (DIC), with a lower DIC considered to be better. In model 1, the sensitivity and specificity were modeled in the bivariate model. Models 2, 3, and 4 indicate that the sensitivity and false-negative rate (1-specificity), false-positive rate (1-sensitivity) and specificity, false-positive rate (1-sensitivity) and false-negative rate (1-specificity) were modeled in the bivariate model, respectively. The threshold effect was tested using Spearman correlations, and a P-value less than 0.05 was considered to indicate a significant threshold effect. Funnel plot asymmetry was also examined to enable a valid assessment of the extent and impact of publication and selective reporting bias in studies of diagnostic accuracy. Subgroup analyses were performed according to the study design (prospective or retrospective), age of included patients (over or less than the median age), histopathology (papillary thyroid cancer or other carcinoma), and prevalence of malignancy (over or less than the median rate).
All analyses were conducted using R software version 4.0.4 (R Foundation for Statistical Computing, Vienna, Austria; https://www.r-project.org) with the R package meta (4.18-2), meta4diag (2.0.8), and INLA (21.02.23) with their required packages.
Results
Literature Search and Study Characteristics
After excluding duplicate results and abstract screening, the full texts of potentially eligible publications were reviewed. After applying the exclusion criteria, 10 studies were included in this systematic review. The study selection process is described in Fig. 1.
Ten eligible articles with 590 patients (333 women and 257 men) were included in the study [13-22]. Seven of them were designed prospectively, and three had retrospective designs. Of 892 cervical lymph nodes, 301 (33.7%) were malignant. The prevalence of malignancy ranged from 19.5% to 60.7%, with a median of 29.7%. SSI elastography data included mean, maximum, minimum, and SD values of the elastic modulus, which were provided in six, nine, four, and three articles, respectively. The detailed characteristics of the 10 included studies are summarized in Table 1.
Risk of Bias
Two reviewers independently assessed the risk of bias and concerns about applicability based on the QUADAS-2 [8]. The results of the quality assessment using the QUADAS-2 tool are shown in Fig. 2. Overall, the applicability of the included studies was moderate to high, and all the studies satisfied at least four of the seven items.
Diagnostic Accuracy of Different Elastic Modulus Values
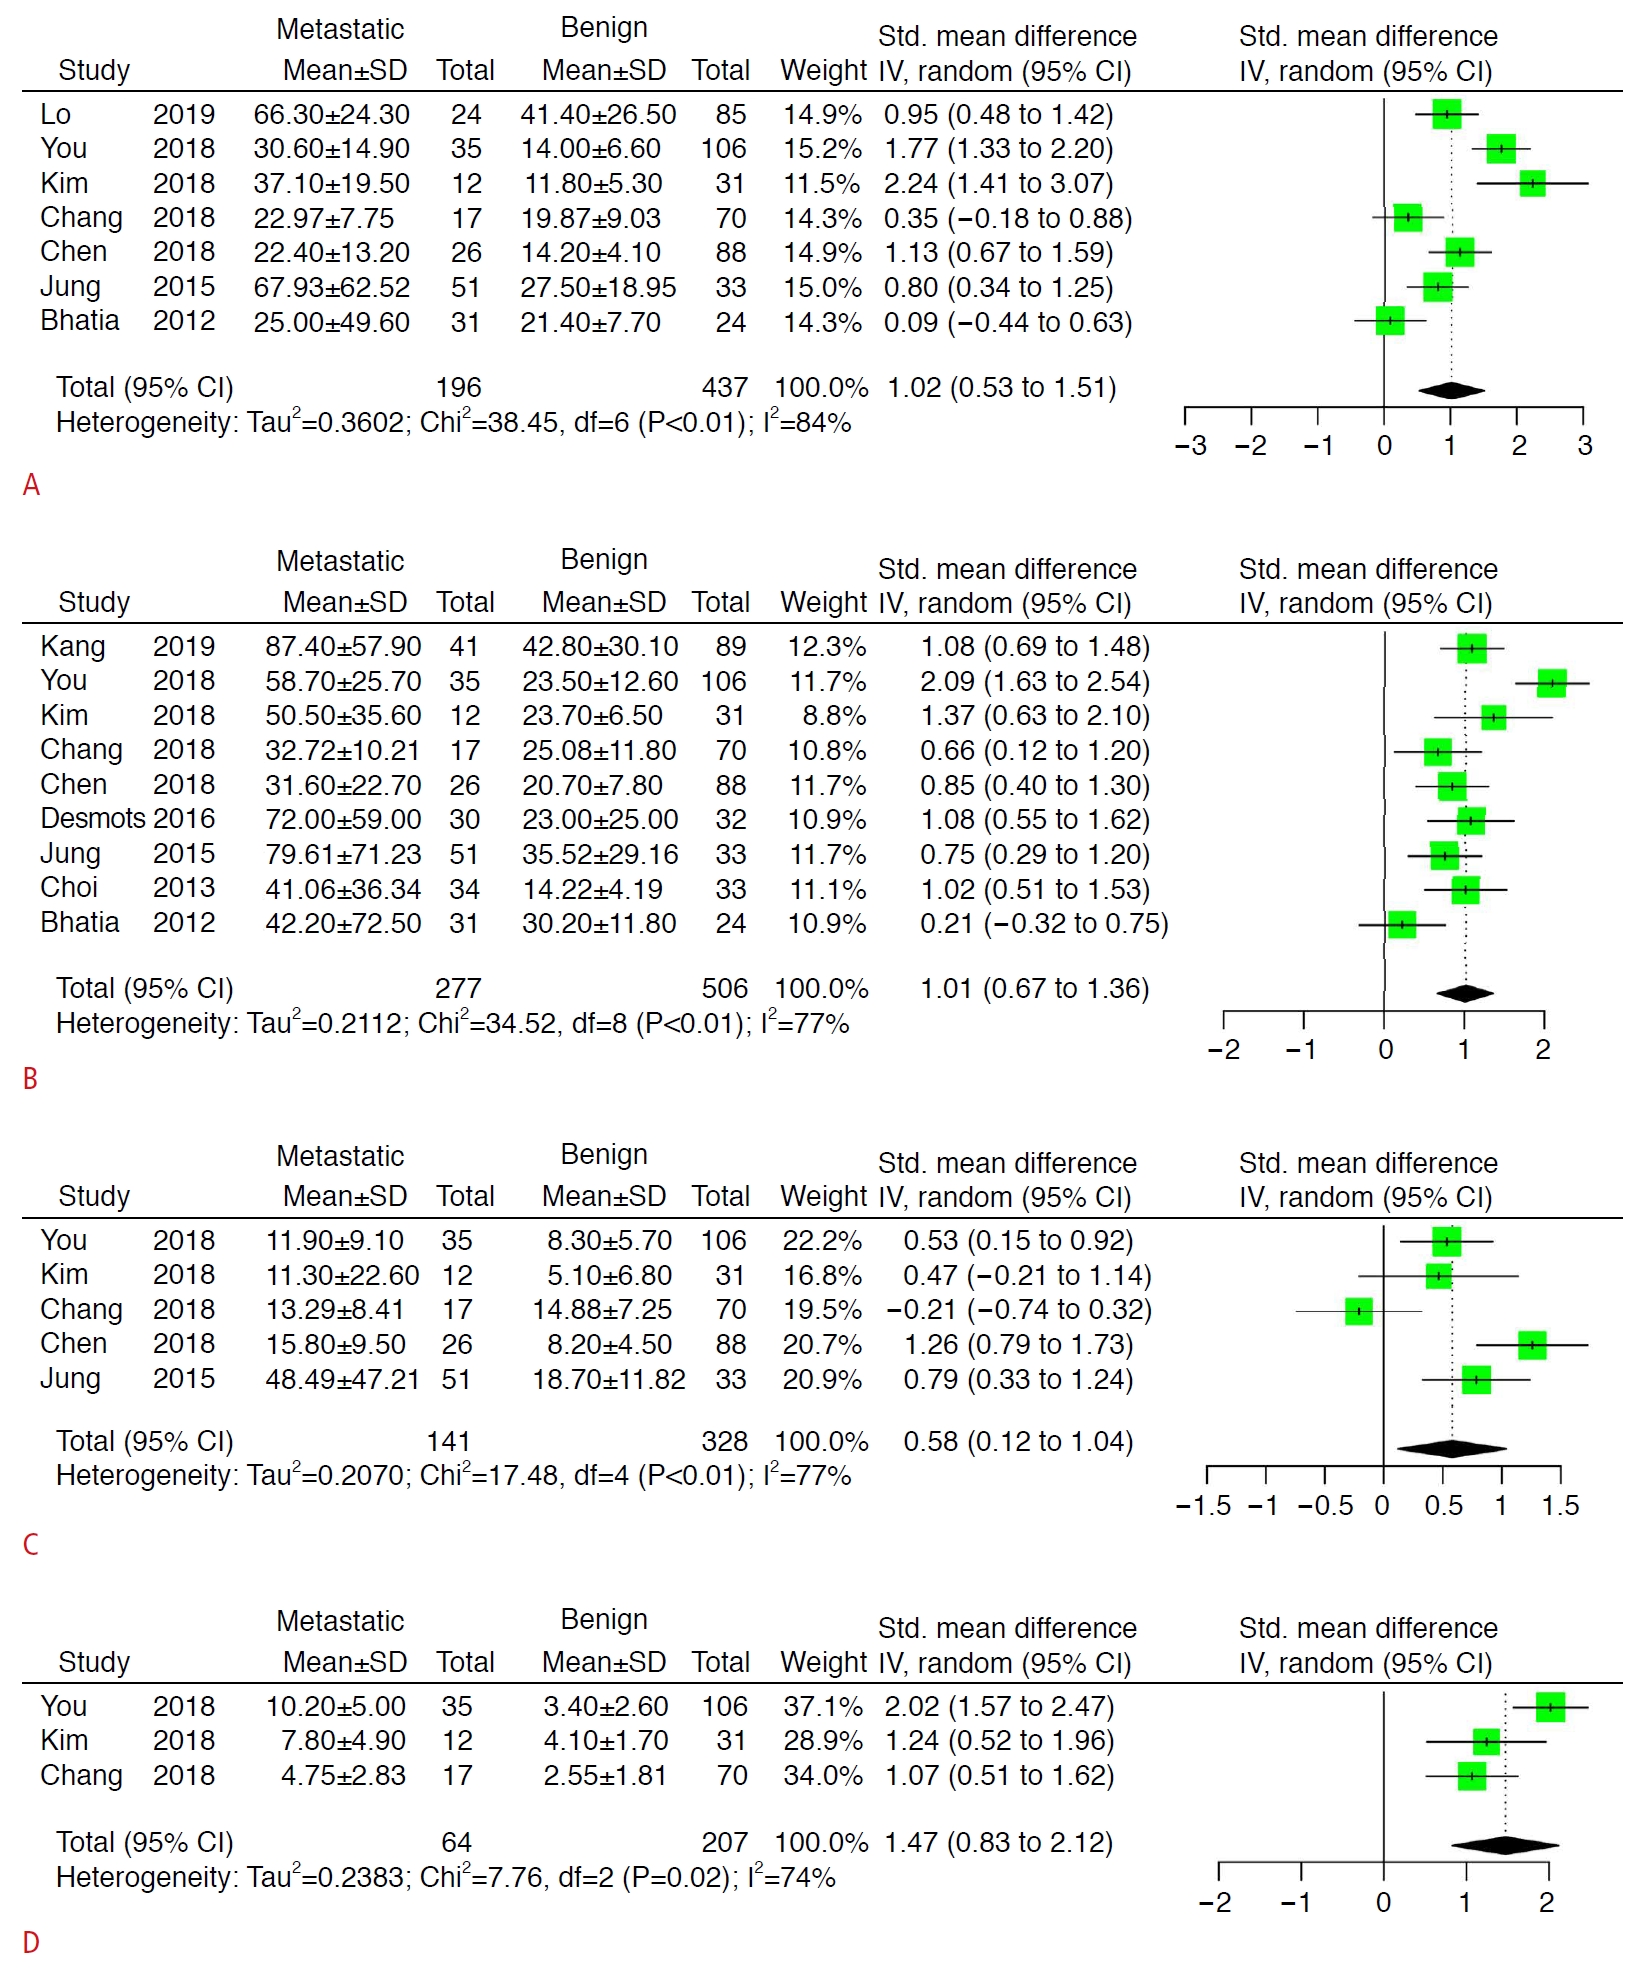
Comparisons of the mean, maximum, minimum, and SD values of the elastic modulus between malignant and benign lymph nodes are displayed in Fig. 3. The pooled differences of all elastic modulus values were statistically significant (P<0.05). However, the heterogenicity between studies could not be ignored.
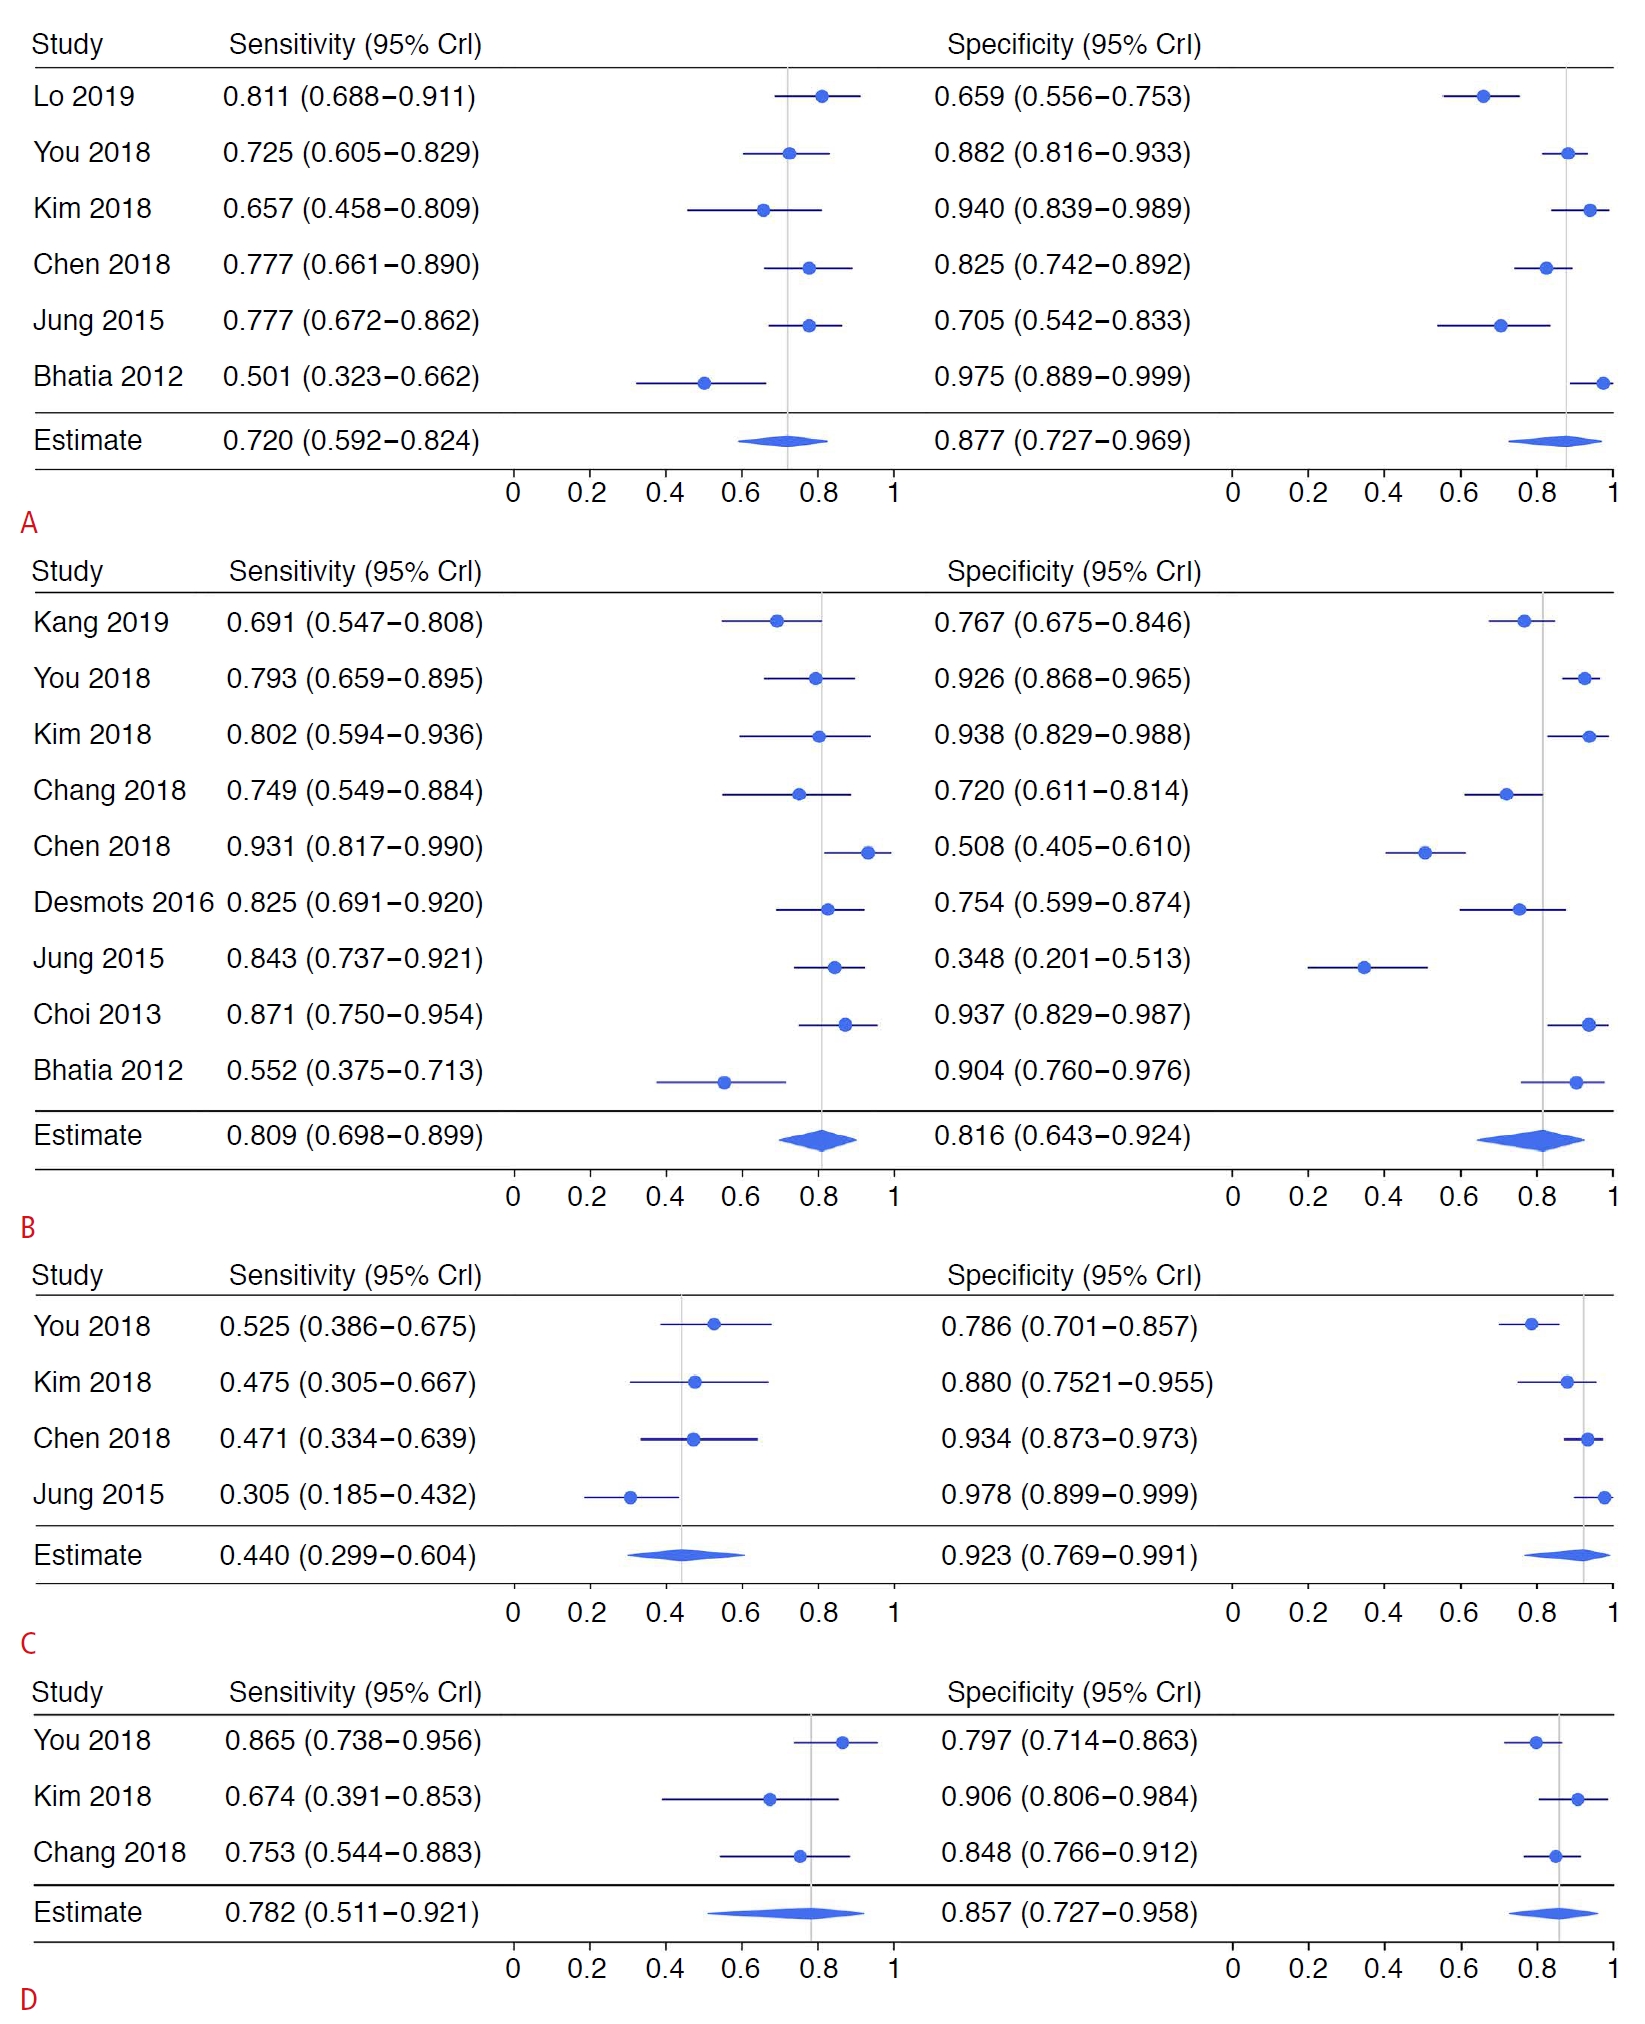
For the mean elastic modulus, the summary estimates for sensitivity and specificity were 0.720 (95% CrI, 0.592 to 0.824) and 0.877 (95% CrI, 0.727 to 0.969), respectively. The summary estimates for LR+ and LR- were 5.79 (95% CrI, 4.02 to 12.49) and 0.31 (95% CrI, 0.23 to 0.47), respectively. The summary estimates for the diagnostic OR and RD were 16.87 (95% CrI, 11.17 to 55.39) and 0.58 (95% CrI, 0.47 to 0.72), respectively. The estimated AUC was 0.845 (95% CrI, 0.672 to 0.914). There was no threshold effect according to Spearman correlation analysis (P=0.064). For the maximum elastic modulus, the summary estimates for sensitivity and specificity were 0.809 (95% CrI, 0.698 to 0.899) and 0.816 (95% CrI, 0.643 to 0.924), respectively. The summary estimates for LR+ and LR- were 5.78 (95% CrI, 3.15 to 11.82) and 0.24 (95% CrI, 0.13 to 0.34), respectively. The summary estimates for OR and RD were 27.67 (95% CrI, 11.15 to 65.75) and 0.67 (95% CrI, 0.54 to 0.76), respectively. The estimated AUC was 0.834 (95% CrI, 0.579 to 0.938). No threshold effect was found (P=0.699). The details regarding the minimum and SD values of the elastic modulus are shown in Table 2. The corresponding forest and SROC plots are displayed in Figs. 4 and 5, respectively.
Subgroup Analysis
Data for the mean and maximum values of elastic modulus were divided into subgroups for further analysis. For thyroid cancer, the summary estimates for sensitivity and specificity were 0.741 (0.616-0.834) and 0.870 (0.583-0.979), respectively. The summary estimates for LR+ and LR- were 11.75 (95% CrI, 7.55 to 28.19) and 0.30 (95% CrI, 0.28 to 0.40), respectively. The summary estimates for the OR and RD were 41.68 (95% CrI, 19.22 to 94.96) and 0.67 (95% CrI, 0.55 to 0.69), respectively. The estimated AUC was 0.768 (95% CrI, 0.381 to 0.859). A threshold effect was found (P<0.001). For the maximum elastic modulus value, the summary estimates for sensitivity and specificity were 0.808 (0.711-0.878) and 0.814 (0.372-0.975), respectively. The summary estimates for LR+ and LR- were 6.14 (95% CrI, 5.59 to 12.65) and 0.16 (95% CrI, 0.14 to 0.25), respectively. The summary estimates for the OR and RD were 39.04 (95% CrI, 22.35 to 87.87) and 0.72 (95% CrI, 0.64 to 0.80), respectively. The estimated AUC was 0.913 (95% CrI, 0.889 to 0.959). No threshold effect was found (P=0.800). Additional subgroup analyses regarding study design, other cancers, age, and malignancy prevalence are shown in Tables 3 and 4.
Discussion
The rising incidence of head and neck cancers requires better operative imaging assessments of the neck region to facilitate surgical decision-making. As an emerging technology, SSI is a shear wave-based elastography technique that is based on the use of an acoustic radiation force to generate a shear wave [23]. ARFI is another technique in this category; however, these techniques are different in terms of the frame rate and the strength of the acoustic radiation force [23]. SSI generates superior impulses that induce and amplify shear waves, which are then tracked throughout the entire window using ultrafast US tracking impulses, while ARFI generates an impulse with a single pushing beam [5,6]. As mentioned in a previous meta-analysis, shear wave elastography (including SSI and ARFI) is an acceptable imaging method for diagnosing malignant cervical lymph nodes, with a sensitivity of 0.81 (95% CI, 0.72 to 0.88) and a specificity of 85% (95% CI, 0.70 to 0.93) [3]. However, the results of SSI elastography from the subgroup analysis showed a sensitivity of 0.80 (95% CI, 0.69 to 0.91) and a specificity of 0.84 (95% CI, 0.67 to 1.00), although only four original articles were included. In addition, the previous meta-analysis only considered the diagnostic performance of the maximum elastic modulus value.
The current systematic review and meta-analysis first summarized the differences of elastic modulus values (mean, maximum, minimum, and SD) between malignant and benign cervical lymph nodes. Although all elastic modulus values were significantly different, heterogeneity was also obvious. No difference was found between malignant and benign cervical lymph nodes in 28.6% (2/7) of the articles for the mean elastic modulus, 11.1% (1/9) for the maximum elastic modulus, 60% (3/5) for the minimum elastic modulus, and 0% (0/3) for the SD of the elastic modulus. These findings indicate that not all parts of malignant lymph nodes were always significantly stiffer than benign lymph nodes, especially for the softest parts. Of course, according to these results, the fact that the maximum elastic modulus of malignant and benign lymph nodes was significantly different should be undisputed, and this finding aligns with the hypothesis that the heterogeneous histology of lymph node metastasis is more accurately reflected by the maximum value for detecting focal cortical metastasis or metastasis where the lymph node is entirely replaced by tumor cells [19,21]. It can also be concluded that the variation in the elastic modulus inside the malignant lymph nodes was significantly larger than that in the benign lymph nodes. Bhatia et al. also found that malignant lymph nodes were more likely to have heterogeneous elasticity, even when the nodes appeared uniform on US [22]. Nonetheless, the present results for the MD between malignant and benign cervical lymph nodes regarding each elastic modulus value could be helpful for building a future consensus about cutoff values.
According to the present meta-analysis, the mean elastic modulus showed potential superiority relative to the maximum elastic modulus regarding AUC (0.845 vs. 0.834), but the mean elastic modulus had lower sensitivity (0.720 vs. 0.809) and higher specificity (0.877 vs. 0.816). However, this difference might have resulted from a different number of included articles and different tumors, and more importantly, no direct evidence was provided. Many previous articles reported comparisons between the mean and maximum elastic modulus values. Bhatia et al. [22] reported the same AUC 0.77 for both mean and maximum elastic modulus values; however, they had distinct advantages regarding sensitivity (0.484 vs. 0.419) and specificity (0.918 vs. 1.000). Chen et al. [18] found the same trend as in the present study; that is, the AUC of the mean elastic modulus was higher than that of the maximum value (0.879 vs. 0.819), but the sensitivity and specificity were possibly lower (0.846 vs. 1.000) and higher (0.830 vs. 0.500), respectively. Another article by Jung et al. [20] also reported data supporting the findings of the present study that the mean elastic modulus had a higher AUC (0.748 vs. 0.738), lower sensitivity (0.7647 vs. 0.8431), and higher specificity (0.6667 vs. 0.3030). Therefore, the choice between different elastic modulus should depend on the situation and actual primary carcinoma. According to the present results, the mean elastic modulus might be more suitable for usual screening while the maximum elastic modulus might be more useful in preoperative evaluations. Meanwhile, the European Federation for Ultrasound in Medicine and Biology guidelines and recommendations suggest that elastography is unlikely to be suitable for the differential diagnosis, but is more likely to be useful for targeting malignant lymph nodes for fine-needle aspiration if multiple lymph nodes are present [24,25]. The heterogeneity inside metastatic lymph nodes, represented as the SD of the elastic modulus, was also a good parameter for distinguishing malignant and benign lymph nodes; however, further assessments should be conducted in the future, since only three articles reported this value.
A subgroup analysis showed that the diagnostic performance of SSI for lymph node metastasis from thyroid cancer was not significantly different from its performance for other cancers. The intrinsic curvature of the neck and the superficial location of cervical lymph nodes can cause an inhomogeneous stress distribution in the field of observation, although primary thyroid cancer would have advantages in SSI due to its hardness [14,22]. In addition, the older subgroups showed a trend for lower sensitivity, but higher specificity for both mean and maximum elastic modulus values. Older age is usually a risk factor for early metastasis or recurrence, especially for head and neck cancers [26], and elderly patients were more likely to have been selected for fine-needle biopsy at an early stage, which could have contributed to a higher false-negative rate [26,27]. Differences in trends in diagnostic performance according to age could be further investigated by direct comparisons.
Considering that the available studies were all studies with small samples and potential selection bias, a summarized meta-analysis is necessary to elicit results close to the truth. The use of Bayesian theory rather than the I2 method to assess heterogeneity is more precise according to the PRISMA extension for diagnostic test accuracy statement [7]. However, the present meta-analysis has the following limitations. First, only 10 articles were included, and not all articles provided data for all four elastic modulus values, which made it impossible to compare the outcomes directly. Secondly, mixed primary carcinomas still contributed to the bias in the present analysis, and it is hoped that further studies will focus on a single tumor type to improve the better validity.
SSI is an acceptable imaging technology for diagnosing malignant cervical lymph nodes and can play a complementary role currently. Both maximum and mean elastic modulus values should be taken into consideration to make a clinical judgment.


 Download Citation
 PDF Links
 PubReader
 ePub Link
 Full text via DOI
 Full text via PMC


