

 Print
Print facebook
 twitter
 Linkedin
 google+

Introduction
Ultrasonography is of increasing interest for the bedside examination of diaphragmatic function. Currently, mainly two-dimensional (2D) measures, such as diaphragm excursion, diaphragm thickness, and fractional thickening (FT) are used [1]. However, doubts regarding the reliability of these methods prompted a search for better alternatives. Existing measurements are merely able to measure the deformation of muscular diaphragmatic tissue in the transverse direction, while longitudinal measurements in the direction of contraction are not possible [2]. Speckle tracking ultrasonography, which is widely used in cardiac imaging, overcomes this disadvantage and allows observations of movement in the direction of the contracting muscle fibres. The algorithm follows small regions of the ultrasonographic image with a unique pattern of different echogenic spots from frame to frame, thus "tracking" them. The depicted movement of speckles represents the correlate of ultrasound interference inside the tissue and their movement towards each structure. It reflects myofibrils/muscle tissue during movement (i.e., contraction/relaxation), approximating contractile function [3,4]. The "strain" parameter approximates muscle deformation, while "strain rate" measures the deformation velocity [5,6]. In several studies, speckle tracking has been evaluated as a promising method to assess the diaphragm contractility in healthy subjects [2,7-10].
After cardiac surgery, patients often show alterations of the diaphragmatic contraction pattern, resulting in a clinically well-known reduction of diaphragmatic function [11,12] occurring in up to 85% of patients [13]. Several studies using conventional ultrasonographic methods to examine the diaphragm have been conducted in this patient group [14,15].
For the present study, it was hypothesized that it would be possible to demonstrate diaphragmatic dysfunction after cardiac surgery using speckle tracking ultrasonography of the diaphragm, and that dysfunction would manifest as a decrease of the strain and strain rate parameters. A second hypothesis was that the results of diaphragmatic 2D ultrasonography could be correlated with those derived from speckle tracking ultrasonography. Taken together, the present study aimed to explore the feasibility of speckle tracking ultrasonography for an evaluation of the diaphragm in a clinical setting.
Materials and Methods
Compliance with Ethical Standards
The present study was approved by the local Ethics Committee at the RWTH Aachen University Faculty of Medicine (EK 317/15). Written consent was obtained before patients were included in the study.
Study Protocol and Patient Enrolment
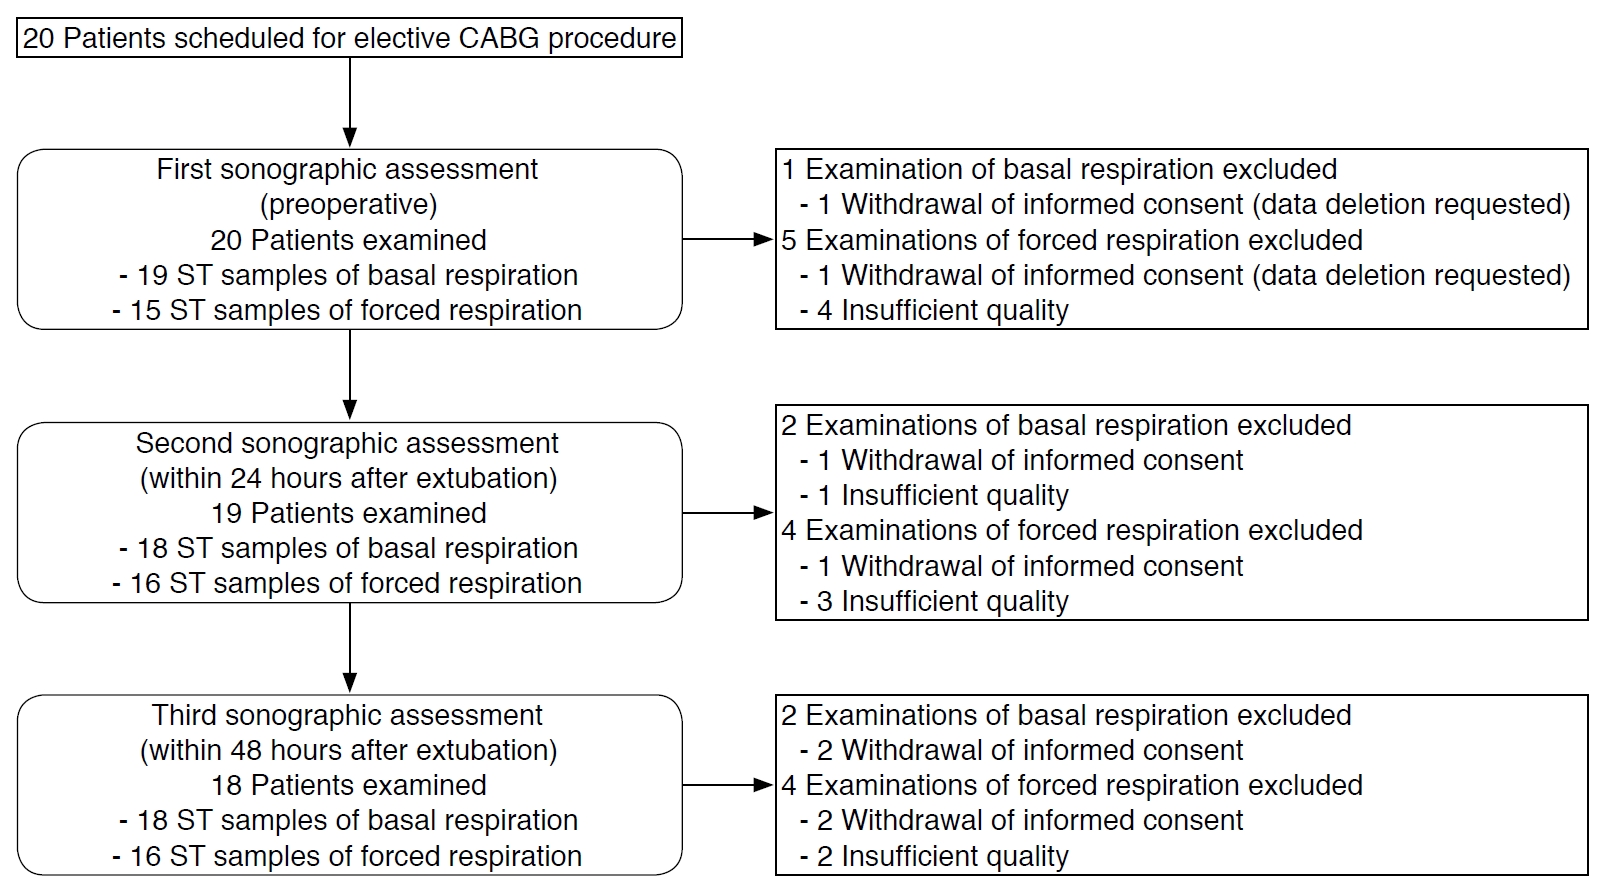
In March 2017, 20 adult patients scheduled for elective coronary artery bypass graft (CABG) were enrolled. The exclusion criteria were pregnancy and sepsis (preoperative or perioperative). A flowchart of the study population is given in Fig. 1. The study population comprised 18 (90%) men and two women, with a mean age of 63.9 years (range, 52 to 81 years). After surgery, sedation was maintained in the intensive care unit (ICU) until patients reached the required criteria for weaning from mechanical ventilation. Extubation was carried out by the ICU physician on duty as per standard institutional procedures. Clinical parameters with a potential impact on the function of the diaphragm were recorded and examined to assess their relationships with the values of the ultrasonographic assessment. Those parameters included preoperative and postoperative left ventricular cardiac function, which was categorised visually as normal or impaired (three levels of severity), as well as sociodemographic data, past medical history, the duration of surgery and mechanical ventilation, and fluid balance.
Ultrasonographic Assessments
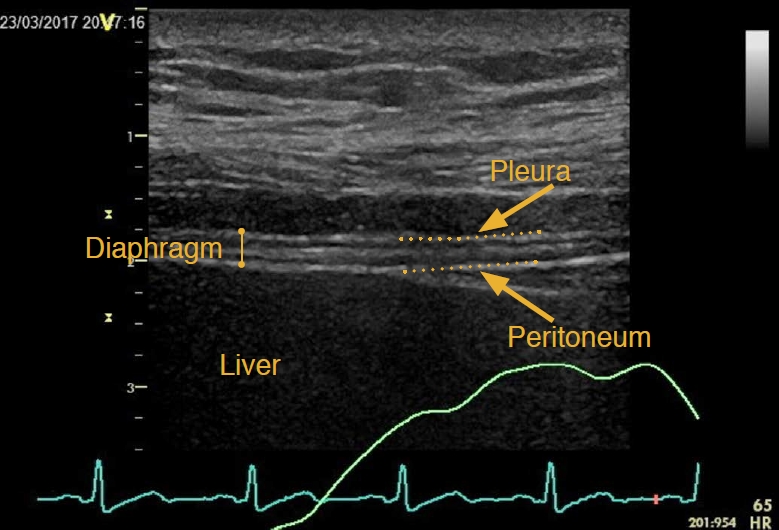
Each patient received three ultrasonographic assessments: (1) preoperatively, (2) within 24 hours, and (3) within 48 hours after extubation. Patients were placed in a 30° upright position and breathed spontaneously during the examinations. Ultrasound loops were recorded during tidal breathing and a voluntary maximal inspiratory manoeuvre. All assessments were performed by the same examiner. Ultrasonography of the diaphragm was performed using a 9-MHz linear transducer on a Vivid E 9 ultrasound device (General Electric Healthcare, Horten, Norway), which was positioned in the zone of apposition (eighth to 11th intercostal spaces) of the right hemithorax between the anterior axillary and the mid-axillary line longitudinal to the body axis. Two echogenic lines (pleura and peritoneum) above the liver tissue marked the diaphragm as the layer between them (Fig. 2). The penetration depth and focus were adjusted optimally and respiratory curves derived from electrocardiography were merged with the ultrasound picture. The cineloops were saved and analysed offline.
Offline Analysis
We used the EchoPac software (version 113, revision 1.0; General Electric Healthcare, Boston, MA, USA) for post hoc analysis.
FT was calculated using the following equation: (end-inspiratory thickness-end-expiratory thickness)/end-expiratory thickness. The diaphragmatic thickness was measured at the same anatomic position following the longitudinal downward motion of the respective location over all breaths of an entire cineloop. Only one of the hyperechogenic lines (usually the pleura) was included in the measured distance.
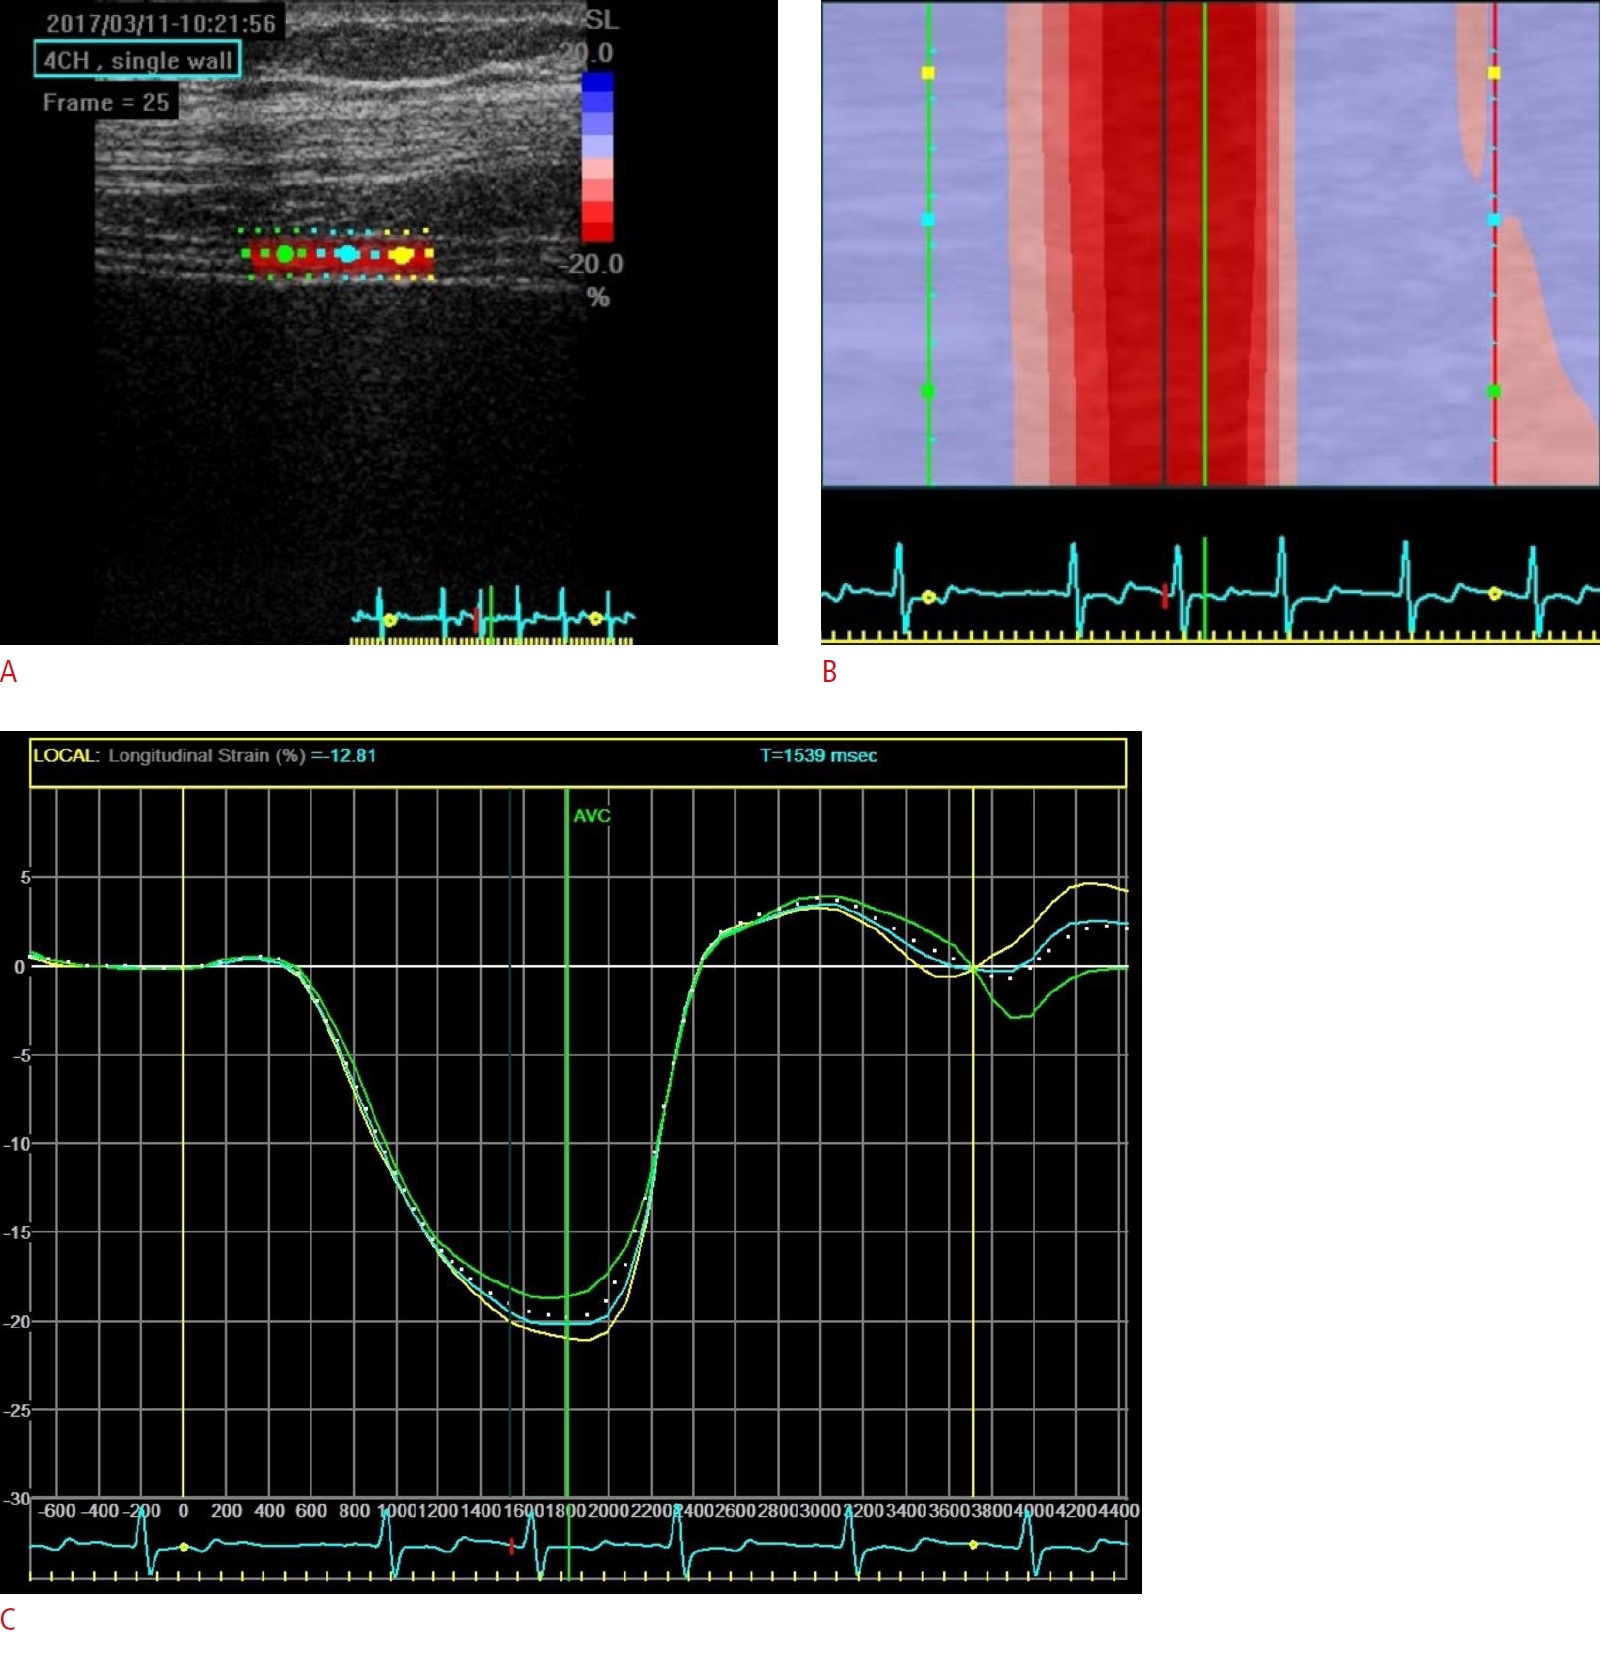
The Q-analysis tool of the EchoPac software was used to analyse the recorded ultrasound data with the speckle tracking technique using the 2D strain modality. Under basal respiration, at least three loops per examination were included in the analysis. Under forced inspiration, all analysable loops were included. The loop was adjusted to cover one entire breathing cycle. A region of interest (ROI) was manually drawn on a representative part of the diaphragm along one echogenic line. After placing the ROI in the longitudinal direction, the transverse dimension was adjusted. If required, the ROI was manually aligned with the borders of the diaphragmatic layer. The software then calculated the inspiratory peak strain and the inspiratory peak strain rate as parameters for longitudinal deformation (Fig. 3, Video clip 1). The longitudinal strain represents the relative change in length compared to an initial reference state (%), while the strain rate represents the velocity of deformation (1/s), which is independent of the referential state. In both cases, an increase in deformation and velocity is connected to a more negative parameter value. The tool for the analysis of transverse strain and strain rate was not available in the software version that was used. If the image quality was insufficient or successful tracking could not be obtained after several attempts, pictures were excluded from analysis.
Statistics
SPSS version 25 (IBM Corp., Armonk, NY, USA) was used for statistical analysis. Assessments in basal respiration and forced inspiration were analysed separately in terms of absolute values and relative to the initial values, as the postoperative value divided by the preoperative value for each patient. The non-parametric Friedman rank-sum test and Wilcoxon-Nemenyi-McDonald-Thompson multiple comparisons were calculated for all pairs of data for the outcome variables (strain, strain rate, and FT) as post-hoc tests. The correlations between speckle tracking measurements and administered fluids were calculated using the Spearman method. Two-tailed P-values less than 0.05 were considered to indicate statistical significance.
Results
Patient Characteristics and Clinical Course
Patients’ characteristics are given in Table 1. Two patients withdrew their consent at different timepoints. One patient suffering from prolonged thoracic bleeding in the ICU had to undergo redo surgery. All patients could be weaned from the ventilator within 26 hours after ICU admission. No reintubation was required. The mean duration of mechanical ventilation was 16 hours and 40 minutes (standard deviation, ±6 hours and 23 minutes).
Feasibility
Eighteen patients completed all examinations within the scheduled timeframe. In general, the pictures were acquired at bedside within 5 minutes. No patient voiced any complaints or signs of discomfort during the procedure. A successful analysis was possible in 96.5% (55/57) of the recorded ultrasonographic loops under basal respiration and 82.5% (47/57) of those under forced respiration. For a set of three sequential cineloops acquired in a single patient, please see Video clips 2-4 with the corresponding analysis in Supplementary Fig. 1.
Ultrasonographic Analysis of the Diaphragm
The results of the ultrasonographic assessment of the diaphragm are given in Table 2. P-values for the comparisons of the ultrasonographic parameters between the different assessments are given in Table 3.
Strain under basal respiration
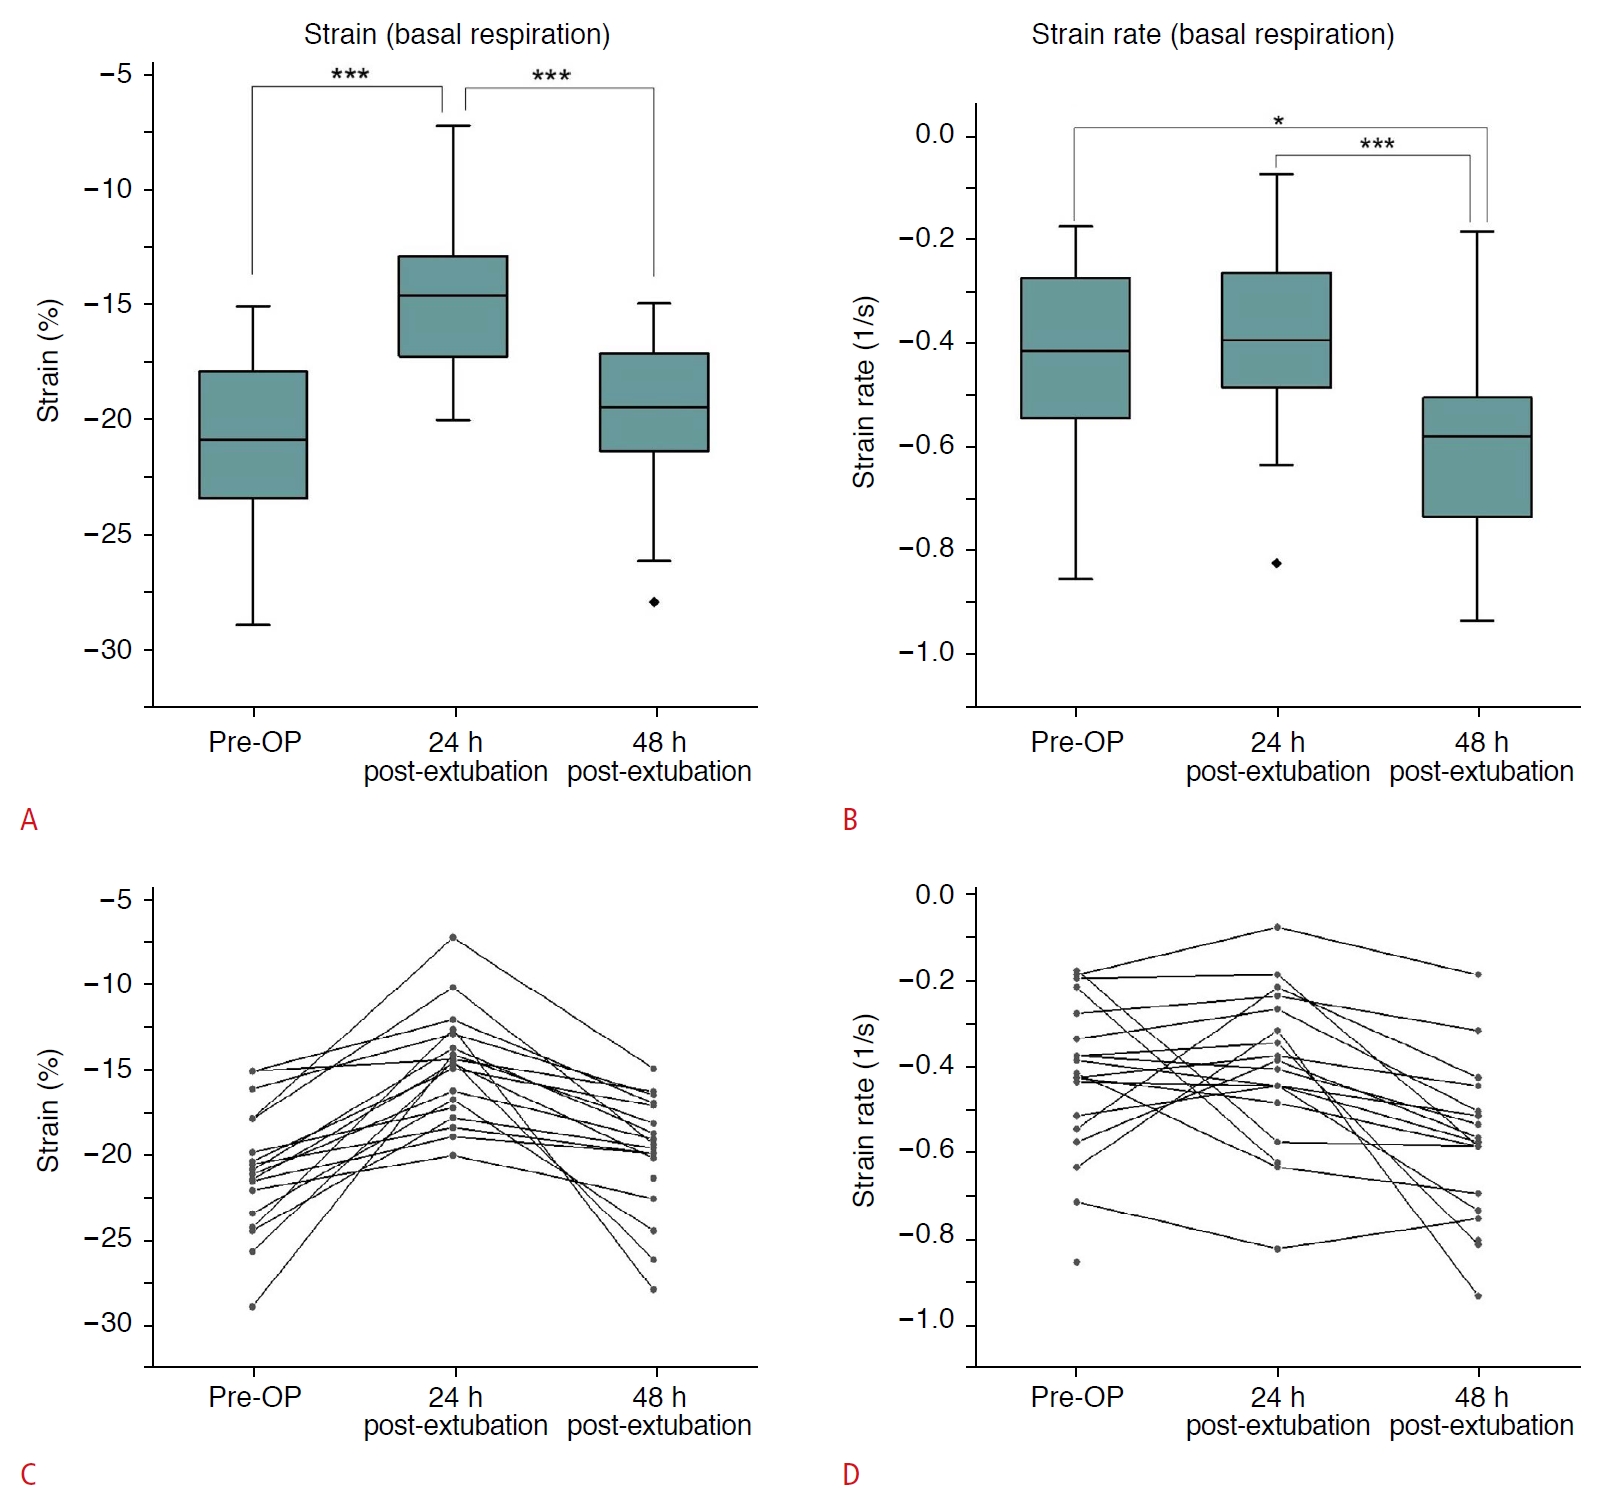
Within 24 hours after extubation, all patients showed a decrease of strain under basal respiration (Fig. 4A, C). The median strain decreased to 73% of the preoperative value. Within 48 hours after extubation, all patients recovered to strain values near the preoperative status. The decrease from the first to second assessment and the increase from the second to third assessment were both statistically significant (P<0.001 for both comparisons).
Strain rate under basal respiration
Postoperatively, the median strain rate remained nearly unchanged compared to the preoperative examination. However, several patients showed strong changes of this parameter in both directions, which only almost balanced each other in the sum. Remarkably, the median strain rate strongly increased 48 hours after extubation (Fig. 4B, D). All patients except one showed a full recovery to the preoperative condition or even a strain rate exceeding the preoperative values, with two of them showing a more than threefold increase. The increase of the third assessment was statistically significant compared to the preoperative values (P=0.010) as well as to the first postoperative assessment (P<0.001).
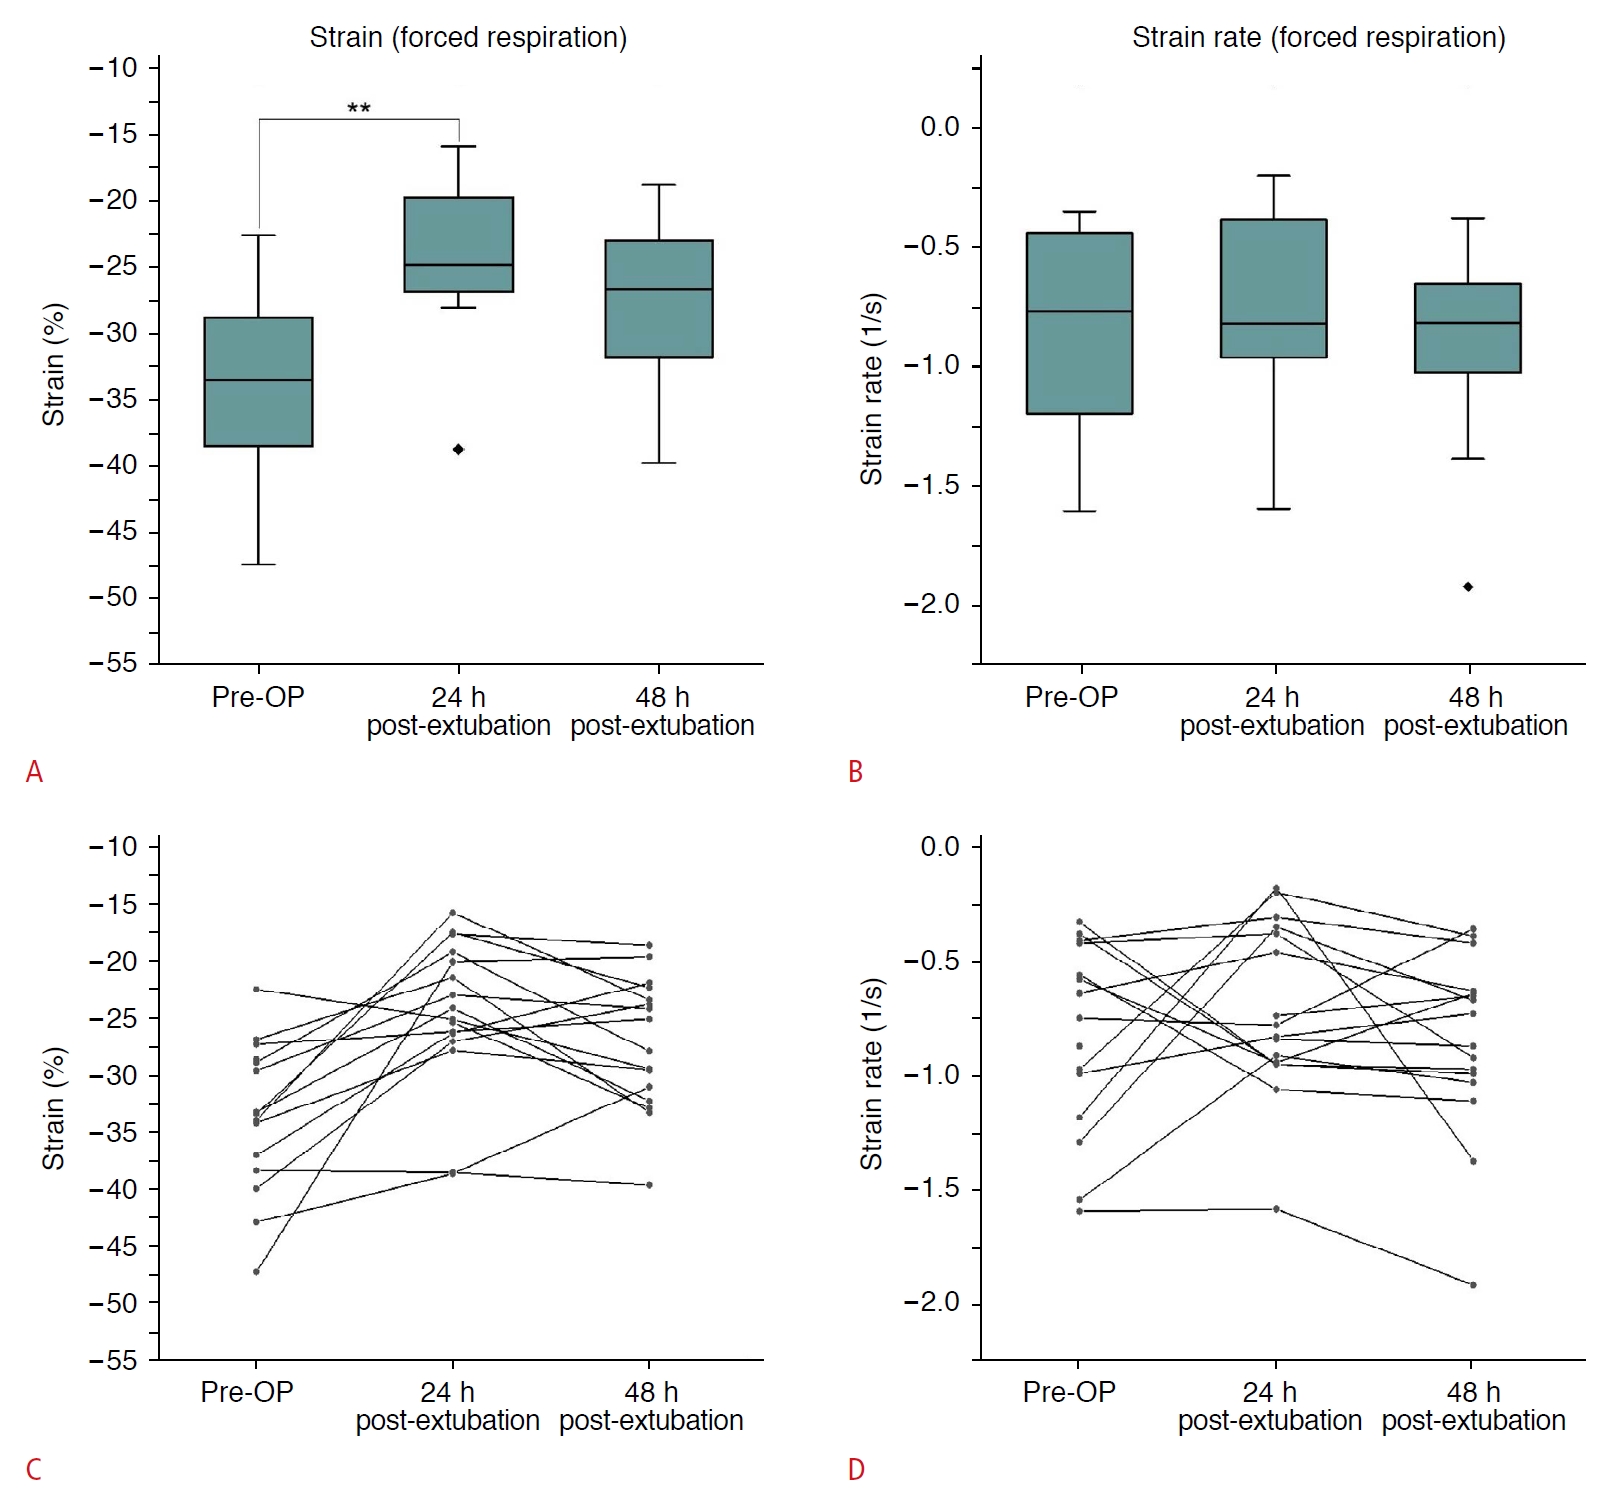
Strain under forced inspiration
Due to poor picture quality under the forced inspiration manoeuvre, only 14 patients could be analysed; the values of these patients changed non-homogeneously (Fig. 5A, C). Nonetheless, a majority of patients showed a strain pattern with early postoperative decrease and a subsequent recovery, comparable to basal respiration. However, not all patients recovered; those patients instead continued to have decreased strain 48 hours after extubation instead.
Strain rate under forced inspiration
Measurements of strain rate under forced respiration also generated non-homogeneous results (Fig. 5B, D). However, half of the examined patients had a decreased strain rate within 24 hours after extubation, while the other half showed no changes or increased values. From the second to the third examination, the strain rate did not show relevant changes in the majority of patients. Patients with an increased strain rate postoperatively, in particular, still showed this deformation in velocity over time.
Fractional thickening
The median preoperative FT was 23.5% under basal respiration. Showing similar trends as the strain values, it decreased to 14.79% in the first postoperative examination and recovered, even exceeding the baseline, to a value of 24.92% in the second postoperative measurement (Fig. 6). There were statistically significant results for comparisons between the preoperative and the first postoperative measurements (P=0.022) and between the first and second postoperative evaluations (P=0.037). Due to postoperative anatomical changes of the diaphragm and lung and insufficient picture recording, only 12 patients breathing under maximal inspirational force could be analysed. The FT under forced breathing before the surgical procedure was 50%. Within the first 24 hours after extubation, the FT of forced respiration decreased to 23.63% and showed a slight recovery to 34.44% at the final examination. In contrast to our expectations, there were no clear correlations between strain, strain rate, and FT.
Correlations with Clinical Parameters
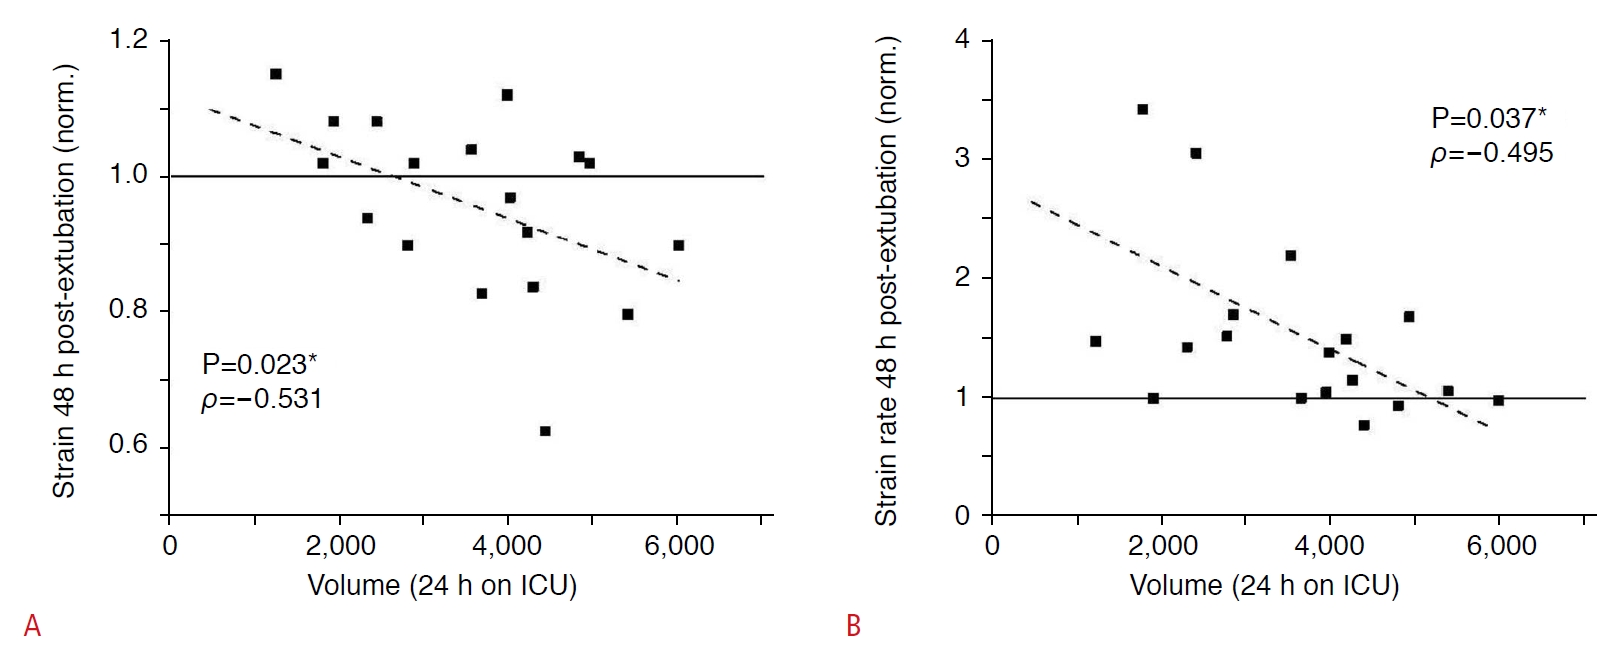
No correlation with the diaphragmatic function (represented by strain, strain rate, or FT) was found for age, body mass index, length of mechanical ventilation, preoperative or postoperative cardiac function, or pre-existing diseases. In addition, there was no statistical evidence for a link between the PaO2/FiO2 ratio, positive end-expiratory pressure, or the length of the cardiopulmonary bypass procedure and diaphragm function at any point. However, there was a negative correlation between the tissue deformation of the diaphragm (strain and strain rate) and the amount of fluid volume that patients had received within the first 24 hours in the ICU (Fig. 7); that is, a lower volume of administered fluids was associated with better diaphragmatic function. At 48 hours post-extubation, the Spearman rho for strain and volume was -0.531, while that for strain rate and volume was -0.495. This correlation was statistically significant (P=0.023 for strain and P=0.037 for strain rate). Twenty-four hours earlier, a vaguely similar effect was present, but without statistical significance. In contrast to these findings, there was no correlation between FT and volume balance.
Discussion
General Findings
To the best of our knowledge, this is the first study using speckle tracking ultrasonography to assess diaphragmatic function in ICU patients. The current gold standard for the examination of diaphragmatic function is the measurement of transdiaphragmatic pressure (Pdi) or electric activity (EAdi). Previous studies have validated speckle tracking ultrasonography for the assessment of diaphragmatic function against Pdi and EAdi in healthy volunteers [8,9], with these methods showing close correlations with each other. In the present study, we showed that the use of speckle tracking is also feasible in a clinical setting. The perceived results support the well-known clinical observation of decreased diaphragmatic function, especially after cardiac surgery, and its alterations during the course of clinical recovery [11-13,16].
Perioperative Changes in Diaphragmatic Strain and Strain Rate
The measured values of strain and strain rate were within the ranges described before [8,9,17]. We detected a significant decrease of the diaphragmatic strain (deformation) during the first 24 hours after surgery. This decrease was reversed subsequently at 48 hours for both basal and forced inspiration. Previous studies showed that stepwise loading tasks were accompanied by an increase of strain, which was closely correlated to Pdi and EAdi [9]. From these data, one can conclude that reduced postoperative strain reflects decreased diaphragmatic function.
However, the strain rate showed different behaviour. We expected the strain and strain rate to change in the same direction, as we had observed before. In contrast to our expectations, the strain rate increased over time, while strain values declined. Thus, deformation of the diaphragm was reduced for about 24 hours, but the contractile velocity remained stable or even increased. A different recruitment pattern of the diaphragmatic muscle fibres could yield a possible explanation. While under basal respiration and regular load, slow-acting type I fibres account for the major part of inspiratory load, while the recruitment of fast-acting type II fibres increases as the work of breathing increases to raise contractility [18]. The rising strain rate might reflect an increasing activation of type II fibres due to a higher respiratory workload. Remarkably, this higher workload did not result in noticeably higher diaphragmatic deformation represented by strain.
As shown by the strain measurements, patients’ respiratory patterns apparently recovered over time. However, some patients still seemed to require a higher muscular force to maintain sufficient ventilation, as represented by a persistently increased strain rate. If further examinations confirm these findings, an increase in the strain rate could represent an early sign of increased respiratory load and its early discovery could help to prevent diaphragmatic exhaustion. Despite these explanatory approaches, the present data are not yet fully clear and require further studies in this area.
Interaction between Fluid Status and Ultrasound Parameters
There is growing evidence that a restrictive fluid balance is associated with better outcomes in critically ill patients [19,20]. Our data suggest that impairment of the diaphragm may be a contributing factor to these findings. They indicate that a higher administered fluid volume within the first 24 hours in the ICU impairs diaphragmatic contraction, as represented by strain and strain rate reduction. To the best of our knowledge, there are no data about the influence of the fluid balance on diaphragmatic function.
Fractional Thickening
While several authors have described close correlations between FT and diaphragmatic function [21-24], others have found no meaningful relationships [9,25-28]. In our study, FT decreased after surgery, similar to the strain and strain rate. The mean values subsequently approached the preoperative value, but the value dispersion increased. Previous publications have reported a wide span for the default values of FT, ranging from near 0% up to 80% [22,24,29]. In our study, FT ranged from 4.5% up to 53.4% under basal respiration, despite a clearly defined examination protocol and careful placement of the transducer in the same anatomical region. Moury et al. [30], who examined patients after cardiac surgery, found a pattern for FT that was similar to our findings, with a decrease in FT from 36% preoperatively to 12% on the first postoperative day, which even exceeds the decrease in our study. Importantly, several patients in the latter study showed a higher FT postoperatively than preoperatively.
Other authors have used the FT to predict successful extubation, defining a cut-off value of 30% or 36% respectively [21,22]. In contrast, 84.2% (16/19) of our examined patients already had a preoperative FT value below 30%. Moreover, all patients except one had an FT below the described cut-off value in the first postoperative assessment, and no included patients required reintubation. Additionally, the work of Vivier et al. [28], who also defined an FT <30% as diaphragmatic dysfunction, was not able to predict successful weaning using FT and diaphragmatic excursion. In summary, these findings indicate a meaningful inconsistency in this parameter. In the authors’ opinion, it is doubtful whether a parameter with such diverging results in different studies can be useful for clinical evaluations [9].
Limitations of the Study
We did not perform any invasive measurements, such as Pdi or EAdi, because the relationship between these parameters and the speckle tracking parameters has been tested before [9]. However, a group of young healthy volunteers, as in the above-mentioned study, might not be fully comparable to CABG patients. Several patients in our study did not tolerate a repeated assessment of a forced inspiration manoeuvre. These circumstances impaired image acquisition, so image quality did not allow a sufficient analysis in all patients.
All measurements were carried out by the same examiner, who was well trained and supervised. Nevertheless, a hidden, recurrent methodical weakness in data acquisition cannot be excluded completely. Variance in the analysed diaphragm area cannot be ruled out as well, although minor variance in the investigated sector may be negligible as the contraction pattern of neighbouring diaphragm parts may be comparable.
An obstacle was the use of the speckle tracking algorithm, which was designed for the analysis of the myocardium. In some cases, the algorithm failed to track the tissue sufficiently due to differences in the texture. It was therefore necessary to adjust or redefine the ROIs a few times until correct tracking could be achieved. This issue was also observed in a previous study [8]. Thus, development and validation of custom-built software specialized for assessment of diaphragmatic muscular tissue are of the utmost importance. An online analysis tool as an additional function could also improve the usability of this method.

 Download Citation
 PDF Links
 PubReader
 ePub Link
 Full text via DOI
 Full text via PMC


