

 Print
Print facebook
 twitter
 Linkedin
 google+

Key points
High-contrast characterization of thermal ablation has been desired to evaluate the therapeutic outcomes. The feasibility of high-contrast photoacoustic characterization of tissue ablation in the visible spectrum was demonstrated. The ex vivo study presents promising spectral features that can characterize and confirm thermal ablation.
Introduction
Thermal therapeutic methods have long been effective options for cancer treatment over surgical treatment, with clear benefits of shorter hospitalization, lower cost, no need for general anesthesia, less bleeding and faster recovery, and a lower risk of postoperative complications [1]. There are several thermal therapeutic methods based on distinct modalities: radiofrequency ablation (RFA) using electric current, photothermal therapy (PTT) using light absorbance of biological tissue, and high-intensity focused ultrasound (HIFU) using mechanical interactions with the biological tissue. For these methods, an accurate therapeutic evaluation is crucial for safe ablation accurately spanning negative tumor margins to prevent undesired post-treatment tumor recurrence.
Medical technologies have made enormous advances in characterizing the properties of tissue that underwent thermal treatment; however, conventional methods face challenges. Magnetic resonance imaging (MRI) can provide high accuracy in evaluating thermal treatment [2]. However, it suffers from bulky, complex, and slow imaging sequences with limited device throughput, leading to high costs. Computed tomography can also visualize high-resolution morphology and real-time temperature changes in biological tissue [3]. However, it is still bulky, complex, and slow, mirroring the disadvantages of MRI as mentioned above, and more critically, its ionizing effect makes it an unfavorable option for repetitive sessions. Ultrasound (US) imaging can provide real-time guidance to accurately identify the position of the RFA tip or HIFU focus, but it does not provide a mechanism for exclusive contrast on tissue ablation.
Photoacoustic (PA) imaging is an emerging non-invasive modality that can combine rich optical contrast with acoustic submillimeter spatial resolution and centimeter-scale imaging depth [4]. An imaging session starts with light energy traveling through the biological tissue, which will be absorbed by the tissue, given its local absorption coefficient. Instantaneous excitation with pulsed light energy will result in non-radiative relaxation as a form of local heat, which will then trigger thermal volume expansion that creates mechanical pressure under stress and thermal confinement. The mechanical energy propagates through the biological tissue to reach an acoustic sensor array to reconstruct the initial pressure map through dynamic receive beamforming, corresponding to the distribution of light absorption in the field. Several scientific and clinical applications have been proposed using the PA imaging modality to visualize endogenous and exogenous contrast in biological tissue. Representative examples include, but are not limited to, the PA imaging of electrophysiology [5–8] and neurovascular physiology [9–11] for a comprehensive understanding of how the brain works, as well as PA imaging of early cancer indicators and aggressive-type tumors to enhance current clinical outcomes [12–15]. Several studies have also extracted distinct PA spectral features reflecting thermal therapeutic progress [16,17]. The prior state-of-the-art in biomedical PA tissue characterization after ablation was limited to imaging in the near-infrared range (NIR, 700–900 nm); the visible spectrum has remained unexplored.
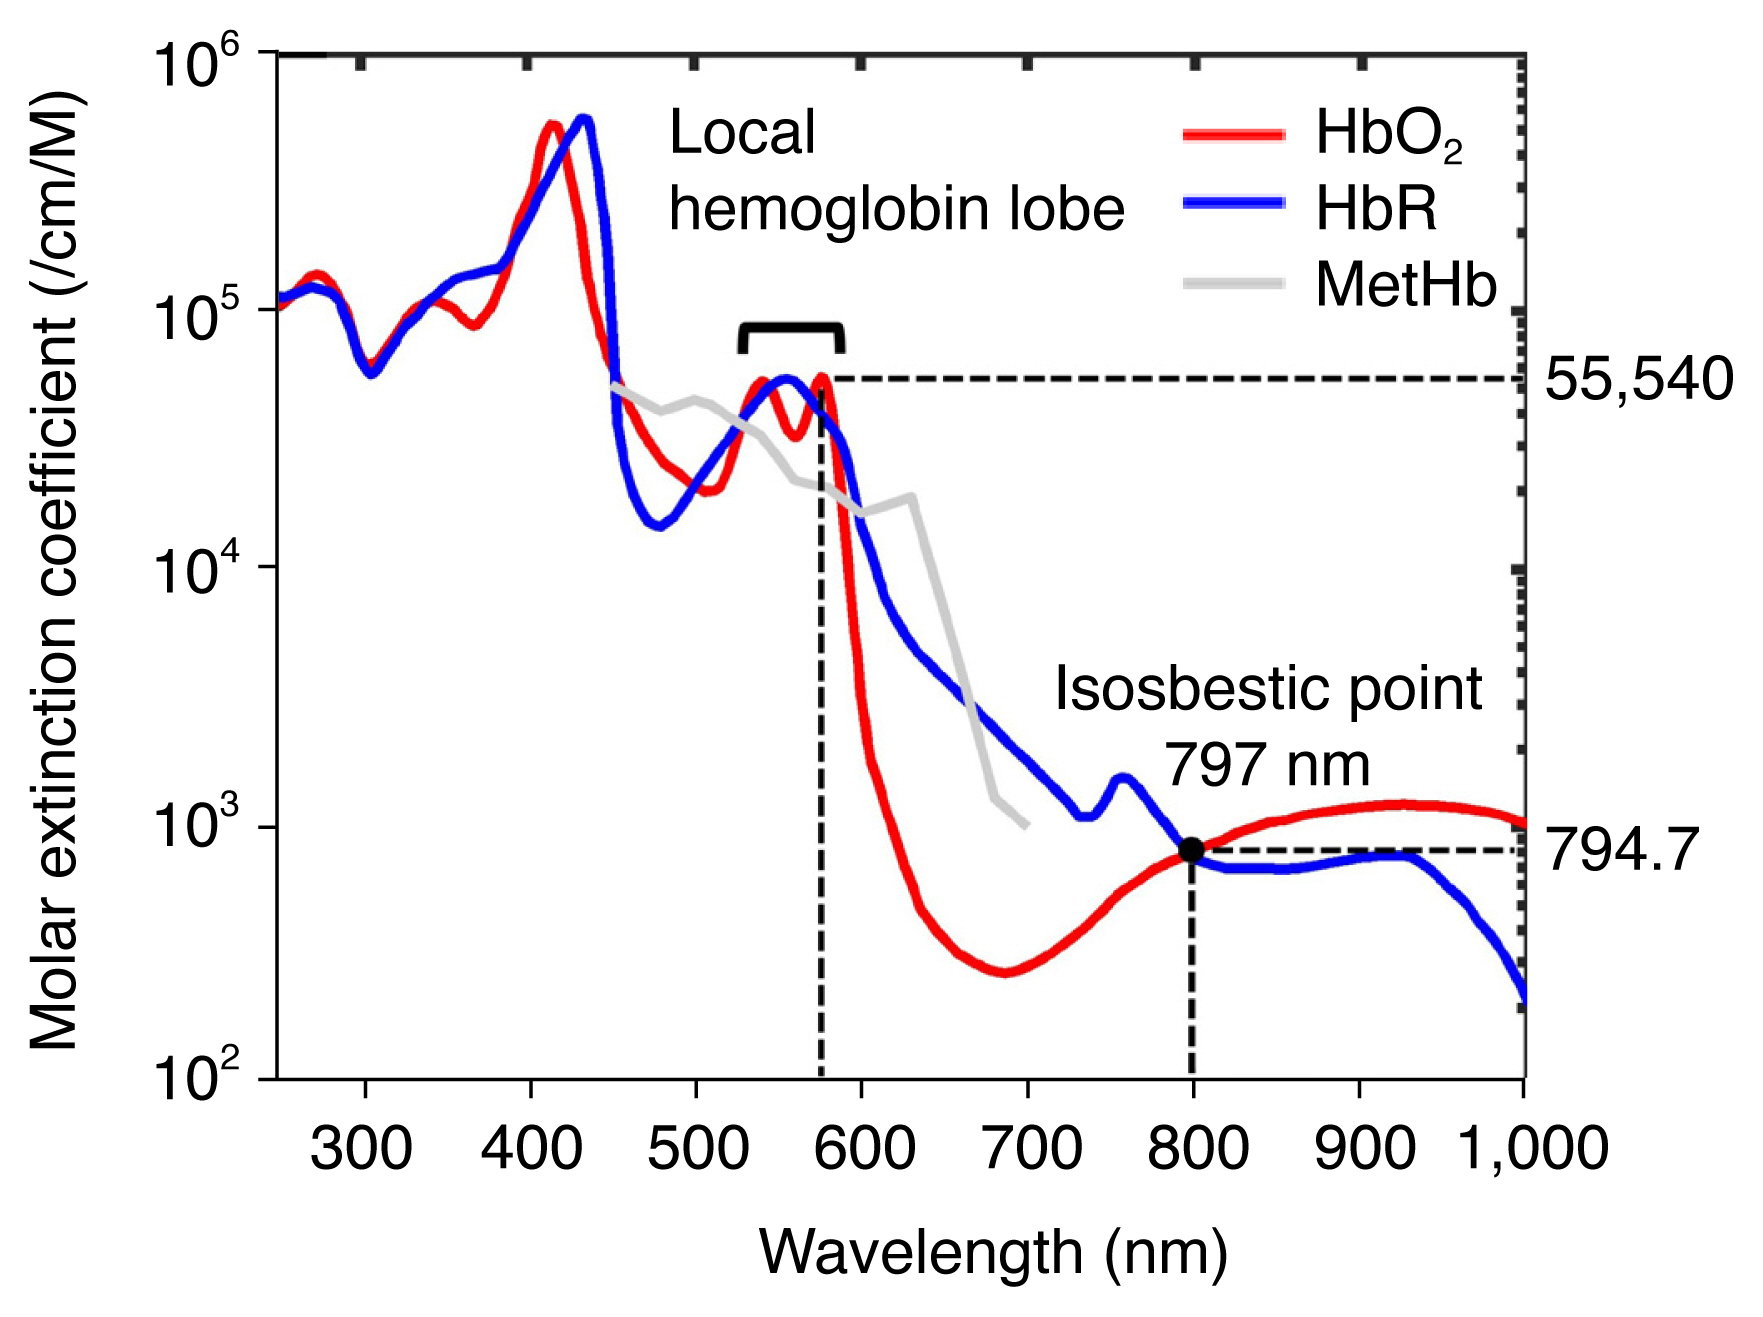
This study presents the PA spectral changes in biological tissue over the visible spectrum (490–700 nm) due to different stages of thermal tissue ablation. It was hypothesized that hemoglobin content would be a valuable contrast to reflect therapeutic outcomes as a highly absorptive protein in the body; in particular, it is known that blood chromophores under high temperature experience a transition into a modified species, methemoglobin (MetHb) [18]. This study also investigated whether PA characterization in the visible spectrum could bring benefits over the NIR range. For example, a higher PA sensitivity is expected in the visible range, given 69.9 times higher absorbance at a local hemoglobin peak at 576 nm than that of a NIR isosbestic point at 797 nm (Fig. 1) [19–21]. Any change in tissue and hemoglobin denaturalization and the transition to MetHb should appear over the high contrast resolution.
Materials and Methods
Thermal Therapeutic Device and Ex Vivo Characterization Setup
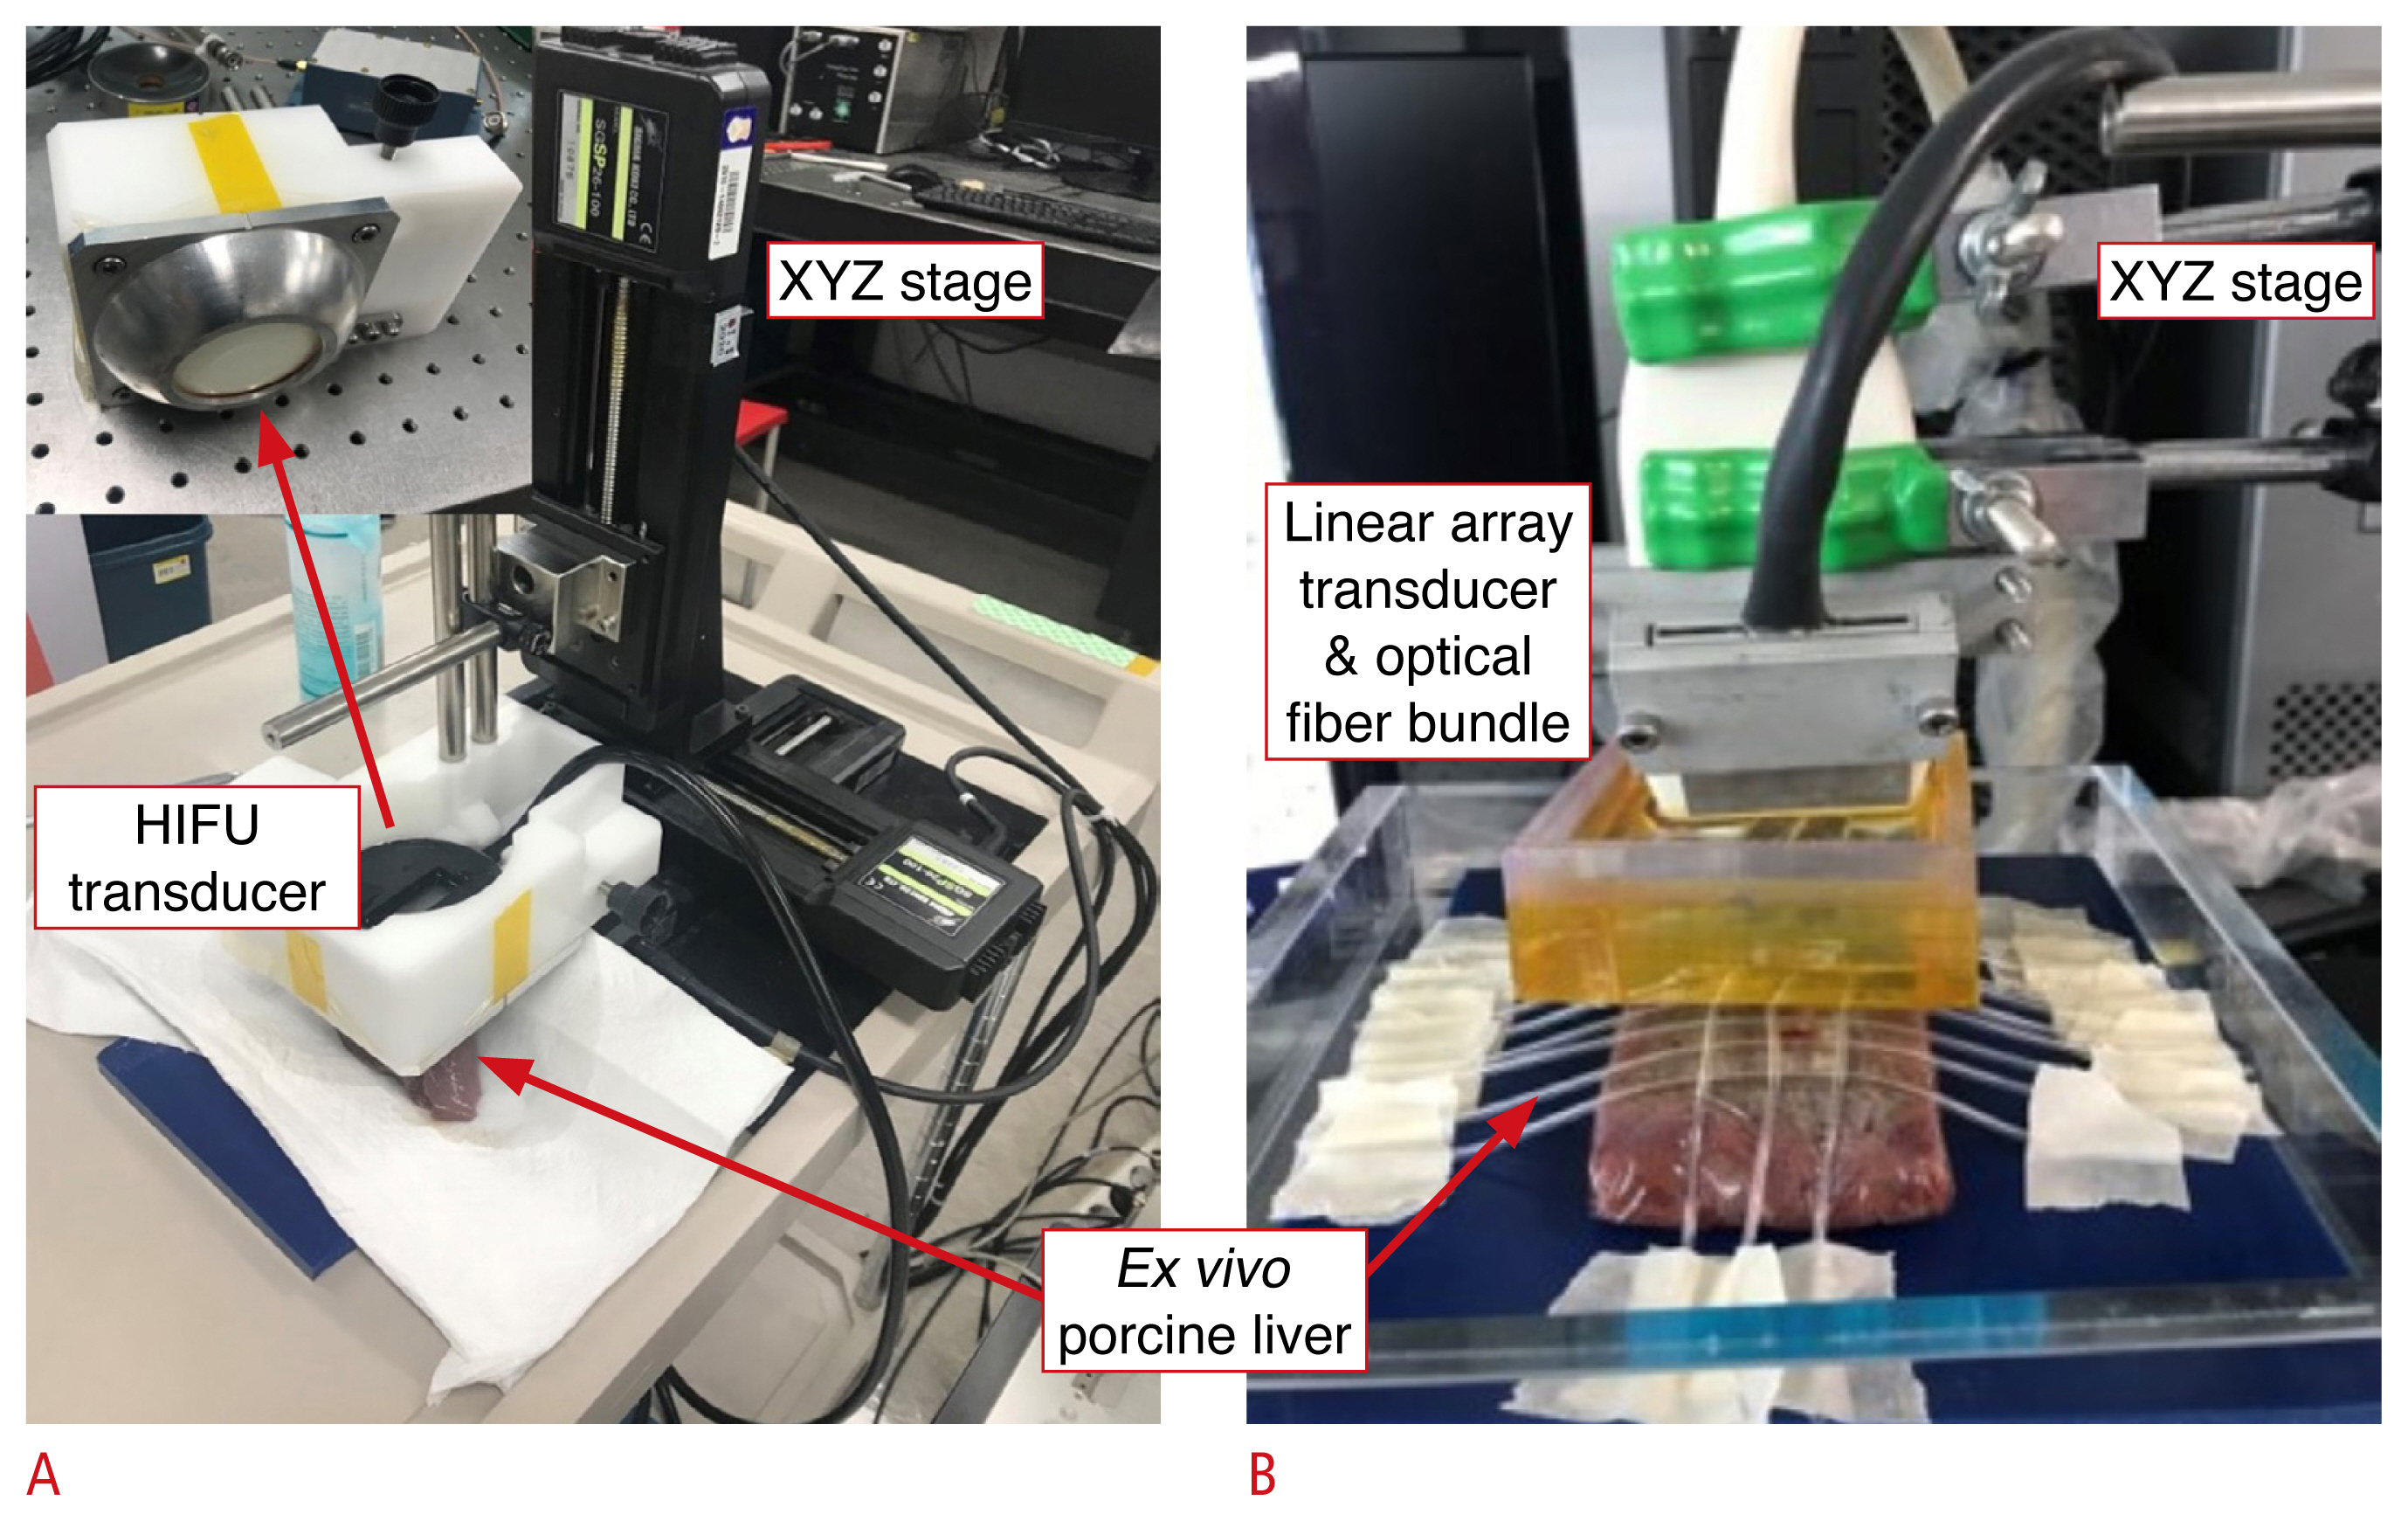
Fig. 2A shows the thermal therapeutic setup, using HIFU as a representative modality to produce a local temperature increase in a controlled spatiotemporal domain. Fresh ex vivo porcine liver tissue was obtained from a local butcher shop and used to represent a common organ for thermal therapy, which would also require deep therapeutic/monitoring depth. A commercial 0.55-MHz HIFU transducer (H230, Sonic Concepts Inc., Bothell, WA, USA) was installed on an XYZ stage (SGSP26-100 and SHOT-204MS, Sigma Koki, Co., Ltd., Tokyo, Japan) to produce multiple lesions on the liver tissue, and entire mechanical transitioning procedures were automated using LabVIEW software (National Instruments Corp., Austin, TX, USA). A continuous sine wave with 560-mVpp input voltage was generated using a function generator (AFG3102, Tektronix, Beaverton, OR, USA) and further amplified by 55 dB using a radiofrequency amplifier (1040L, Electronics & Innovation, Rochester, NY, USA).
Different stages in thermal therapeutic processes were induced by a range of HIFU durations: 0, 5, 10, 15, and 20 seconds. Considering the focal width of 1.3 mm in the HIFU system and its conduction, each segment had an approximately 10×10-mm2 area to minimize the overlap of thermal fields. The focal depth at 10.21 mm was posed at the surface of the liver tissue with a 3D-printed fixture filled with degassed water to allow separate quantification of the ground-truth temperature. Each segment was indicated by empty Tygon tubes in the PA/US imaging field of view (Fig. 2B).
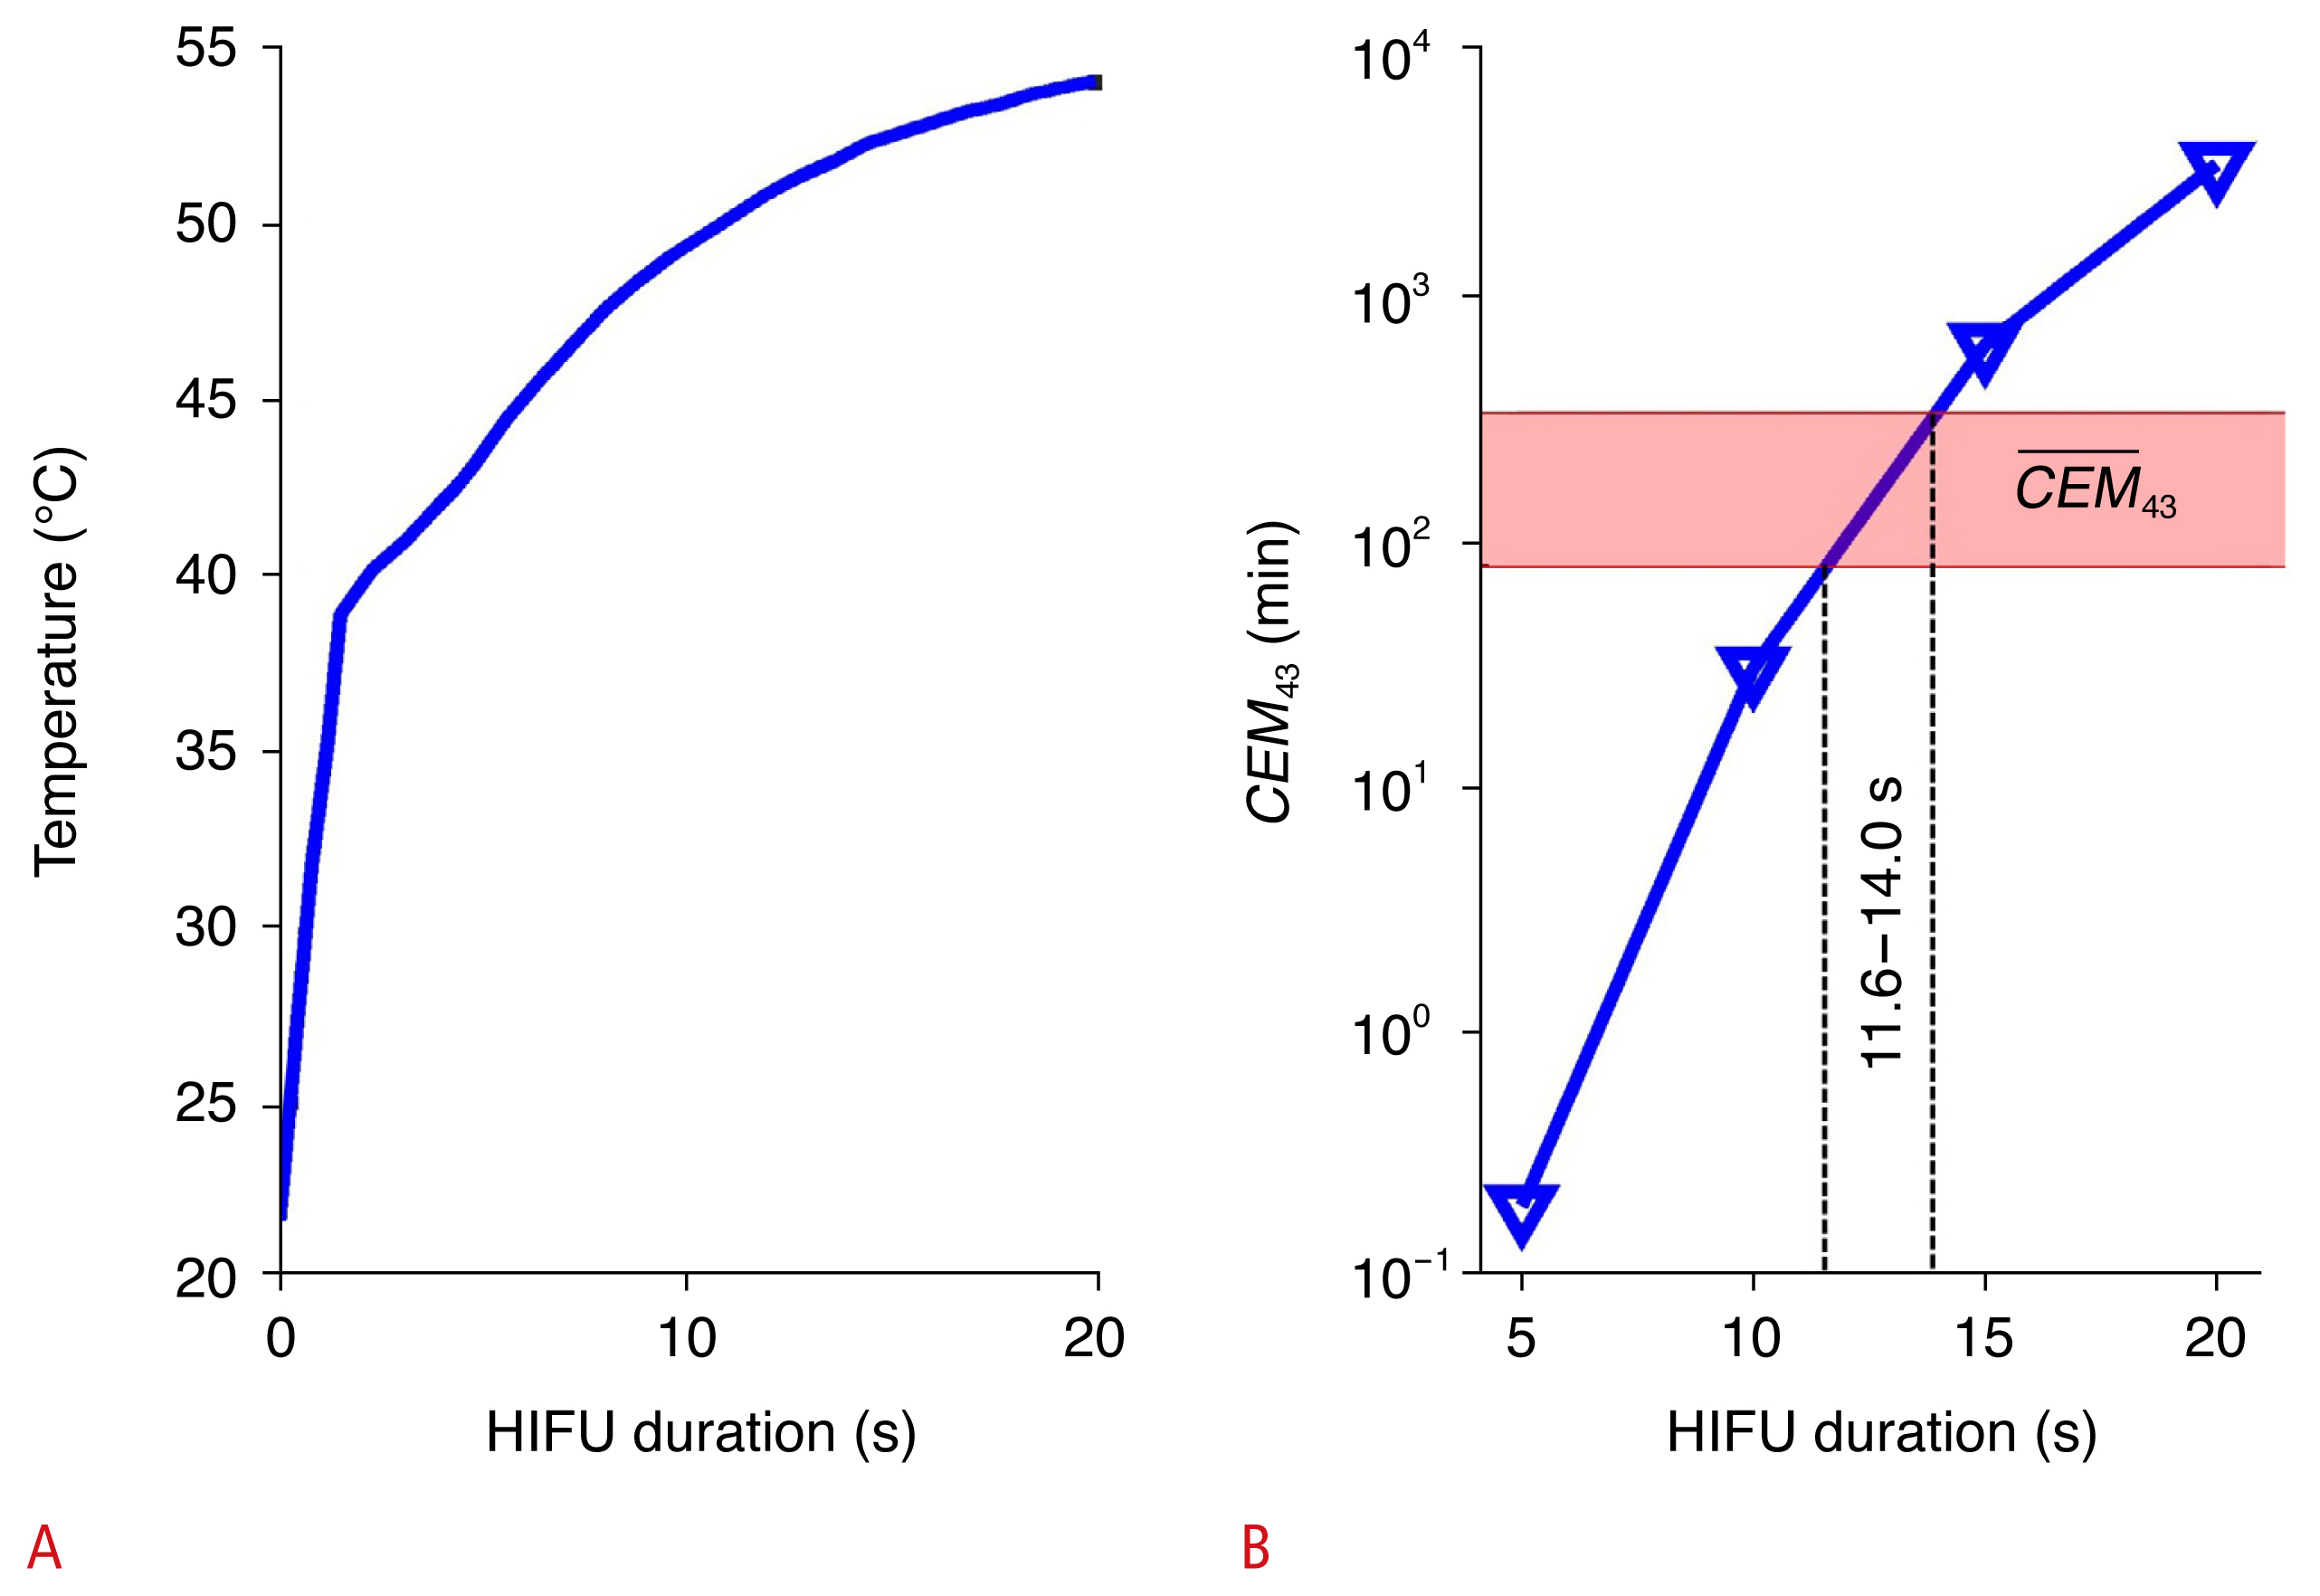
A data logger thermometer (DT-8891C, CEM, Shenzhen, China) and a K-type wire sensor were used to measure temperature changes upon HIFU application to the ex vivo porcine liver tissue. The sensor was located near the therapeutic focus on the ex vivo tissue. From the temperature trace, the thermal dose was estimated by the metric of cumulative equivalent minutes at 43°C (CEM43), which is given by
where N is the total number of data, Ti is a temperature value measured at the i-th sampling duration ti. RCEM is a calibration coefficient: 0.5 and 0.25 for Ti above and below 43°C, respectively. CEM43 has been used as a convenient method to convert a time-variant temperature trace into an equivalent thermal exposure in time duration at 43°C. Note that CEM43 is a metric that is solely determined by the tissue temperature, making the follow-up analysis adjustable to any thermal mechanisms. The therapeutic CEM43 threshold for enough exposure to induce tissue ablation (
C E M ¯ 43 C E M ¯ 43 C E M ¯ 43
Spectroscopic PA Characterization of Thermal Ablation
After thermal therapeutic sessions with a specific CEM43, the HIFU transducer was carefully removed, and a PA/US imaging probe was installed on the ex vivo tissue with a room-temperature acoustic coupling gel and water tank. The transition was performed and completed at a 40-minute post-HIFU time point. Therefore, the PA characterization could be performed when tissue temperature had stabilized at room temperature. Therefore, this study did not include any PA intensity variations due to ambient temperature. An Nd:YAG pump laser (Surelite III-10, Continuum Lasers Inc., Milpitas, CA, USA) equipped with an optical parametric oscillator (OPO, Surelite OPO Plus, Amplitude Laser, Pessac, France) was used to produce laser pulses at 10 Hz. The harmonic separator produced 355 nm as a pumping source, and OPO produced a wide range of visible-to-NIR wavelengths. The spectrum of interest was 490–700 nm at 10-nm intervals, and each energy was equalized using an energy sensor and meter (QE25LP-H-MB-D0 and Maestro, Gentec-EO Inc., Quebec, Canada). The laser pulses were delivered to a target subject by a customized, bifurcated optical fiber bundle (Fiberoptic Systems Inc., Simi Valley, CA, USA) designed for uniform light illumination in the lateral direction of the PA imaging probe. Acoustic data were obtained using a 5-MHz clinical linear array transducer (L7-4, Verasonics, Kirkland, WA, USA) between the bifurcated bar-type outlets of the optical fiber bundles, and the data were delivered to a US research package for recording (Vantage256, Verasonics). At each therapeutic segment, a tissue surface about 0.1-mm in thickness was identified based on the PA/US images, and a projected PA spectrum was derived. The design reflects the proposed scheme to deliver optical energy at a local therapeutic focus through intracorporeal light illumination for PA signal generation. At each CEM43, the PA spectra from three liver slices were collected.
Histopathology
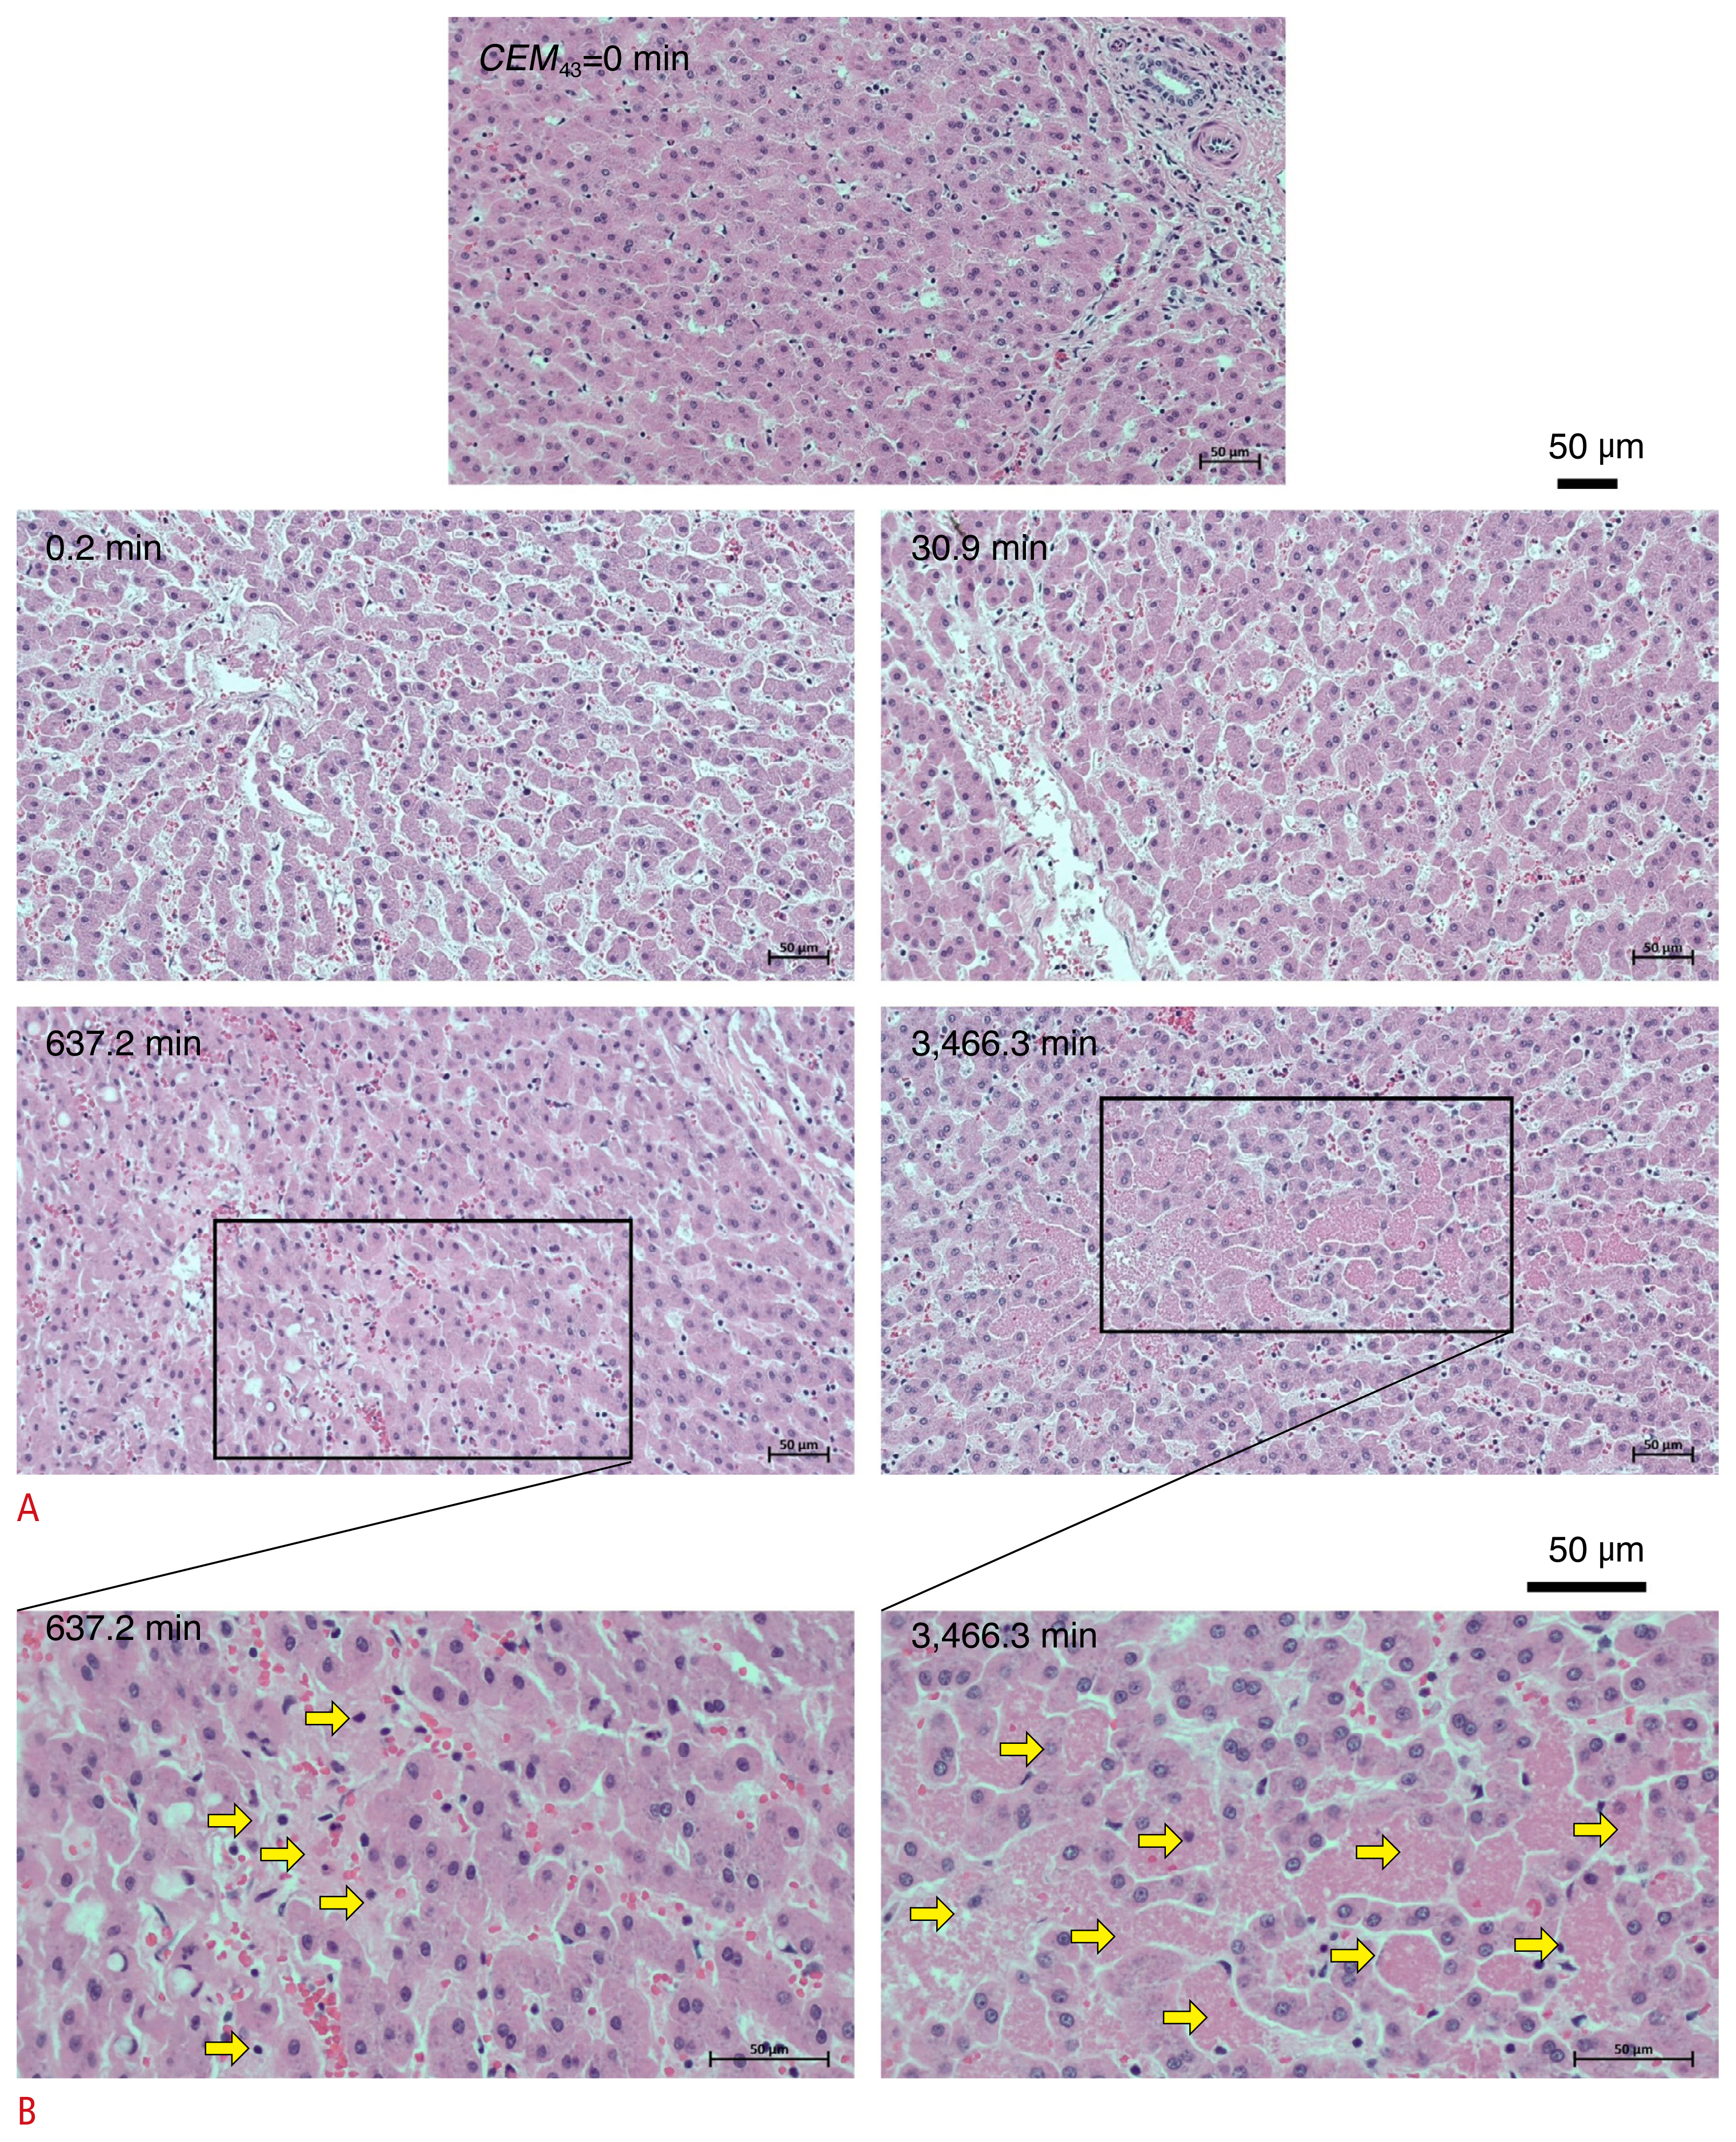
To validate the thermal ablation in a range of CEM43 values, the cross-section of the therapeutic lesion was cut, and the surface layer was obtained for a histopathological analysis. A single liver was used to minimize variability in tissue properties. The samples were processed with hematoxylin and eosin (H&E) staining, and ×200 and ×400 microscopic images were analyzed to identify cellular-level clues of thermal tissue damage.
Results
Thermal Dose Calculation and Therapeutic Threshold Estimation
Our thermal therapeutic process was first characterized by temperature tracing at the therapeutic focus on the fresh ex vivo liver tissue surface. The trace was converted into the CEM43 metric, following Eq. (1). Fig. 3A shows the temperature increase in ex vivo liver tissue with continuous HIFU for 20 seconds. We estimated the total heat exposure of the ex vivo liver for each HIFU duration as follows (Fig. 3B): CEM43 values of 0, 0.2, 30.9, 637.2, and 3,466.3 minutes for HIFU durations of 0, 5, 10, 15, and 20 seconds, respectively. Considering the
C E M ¯ 43
Spectral PA Intensity Changes Reflecting Different Thermal Therapeutic Stages
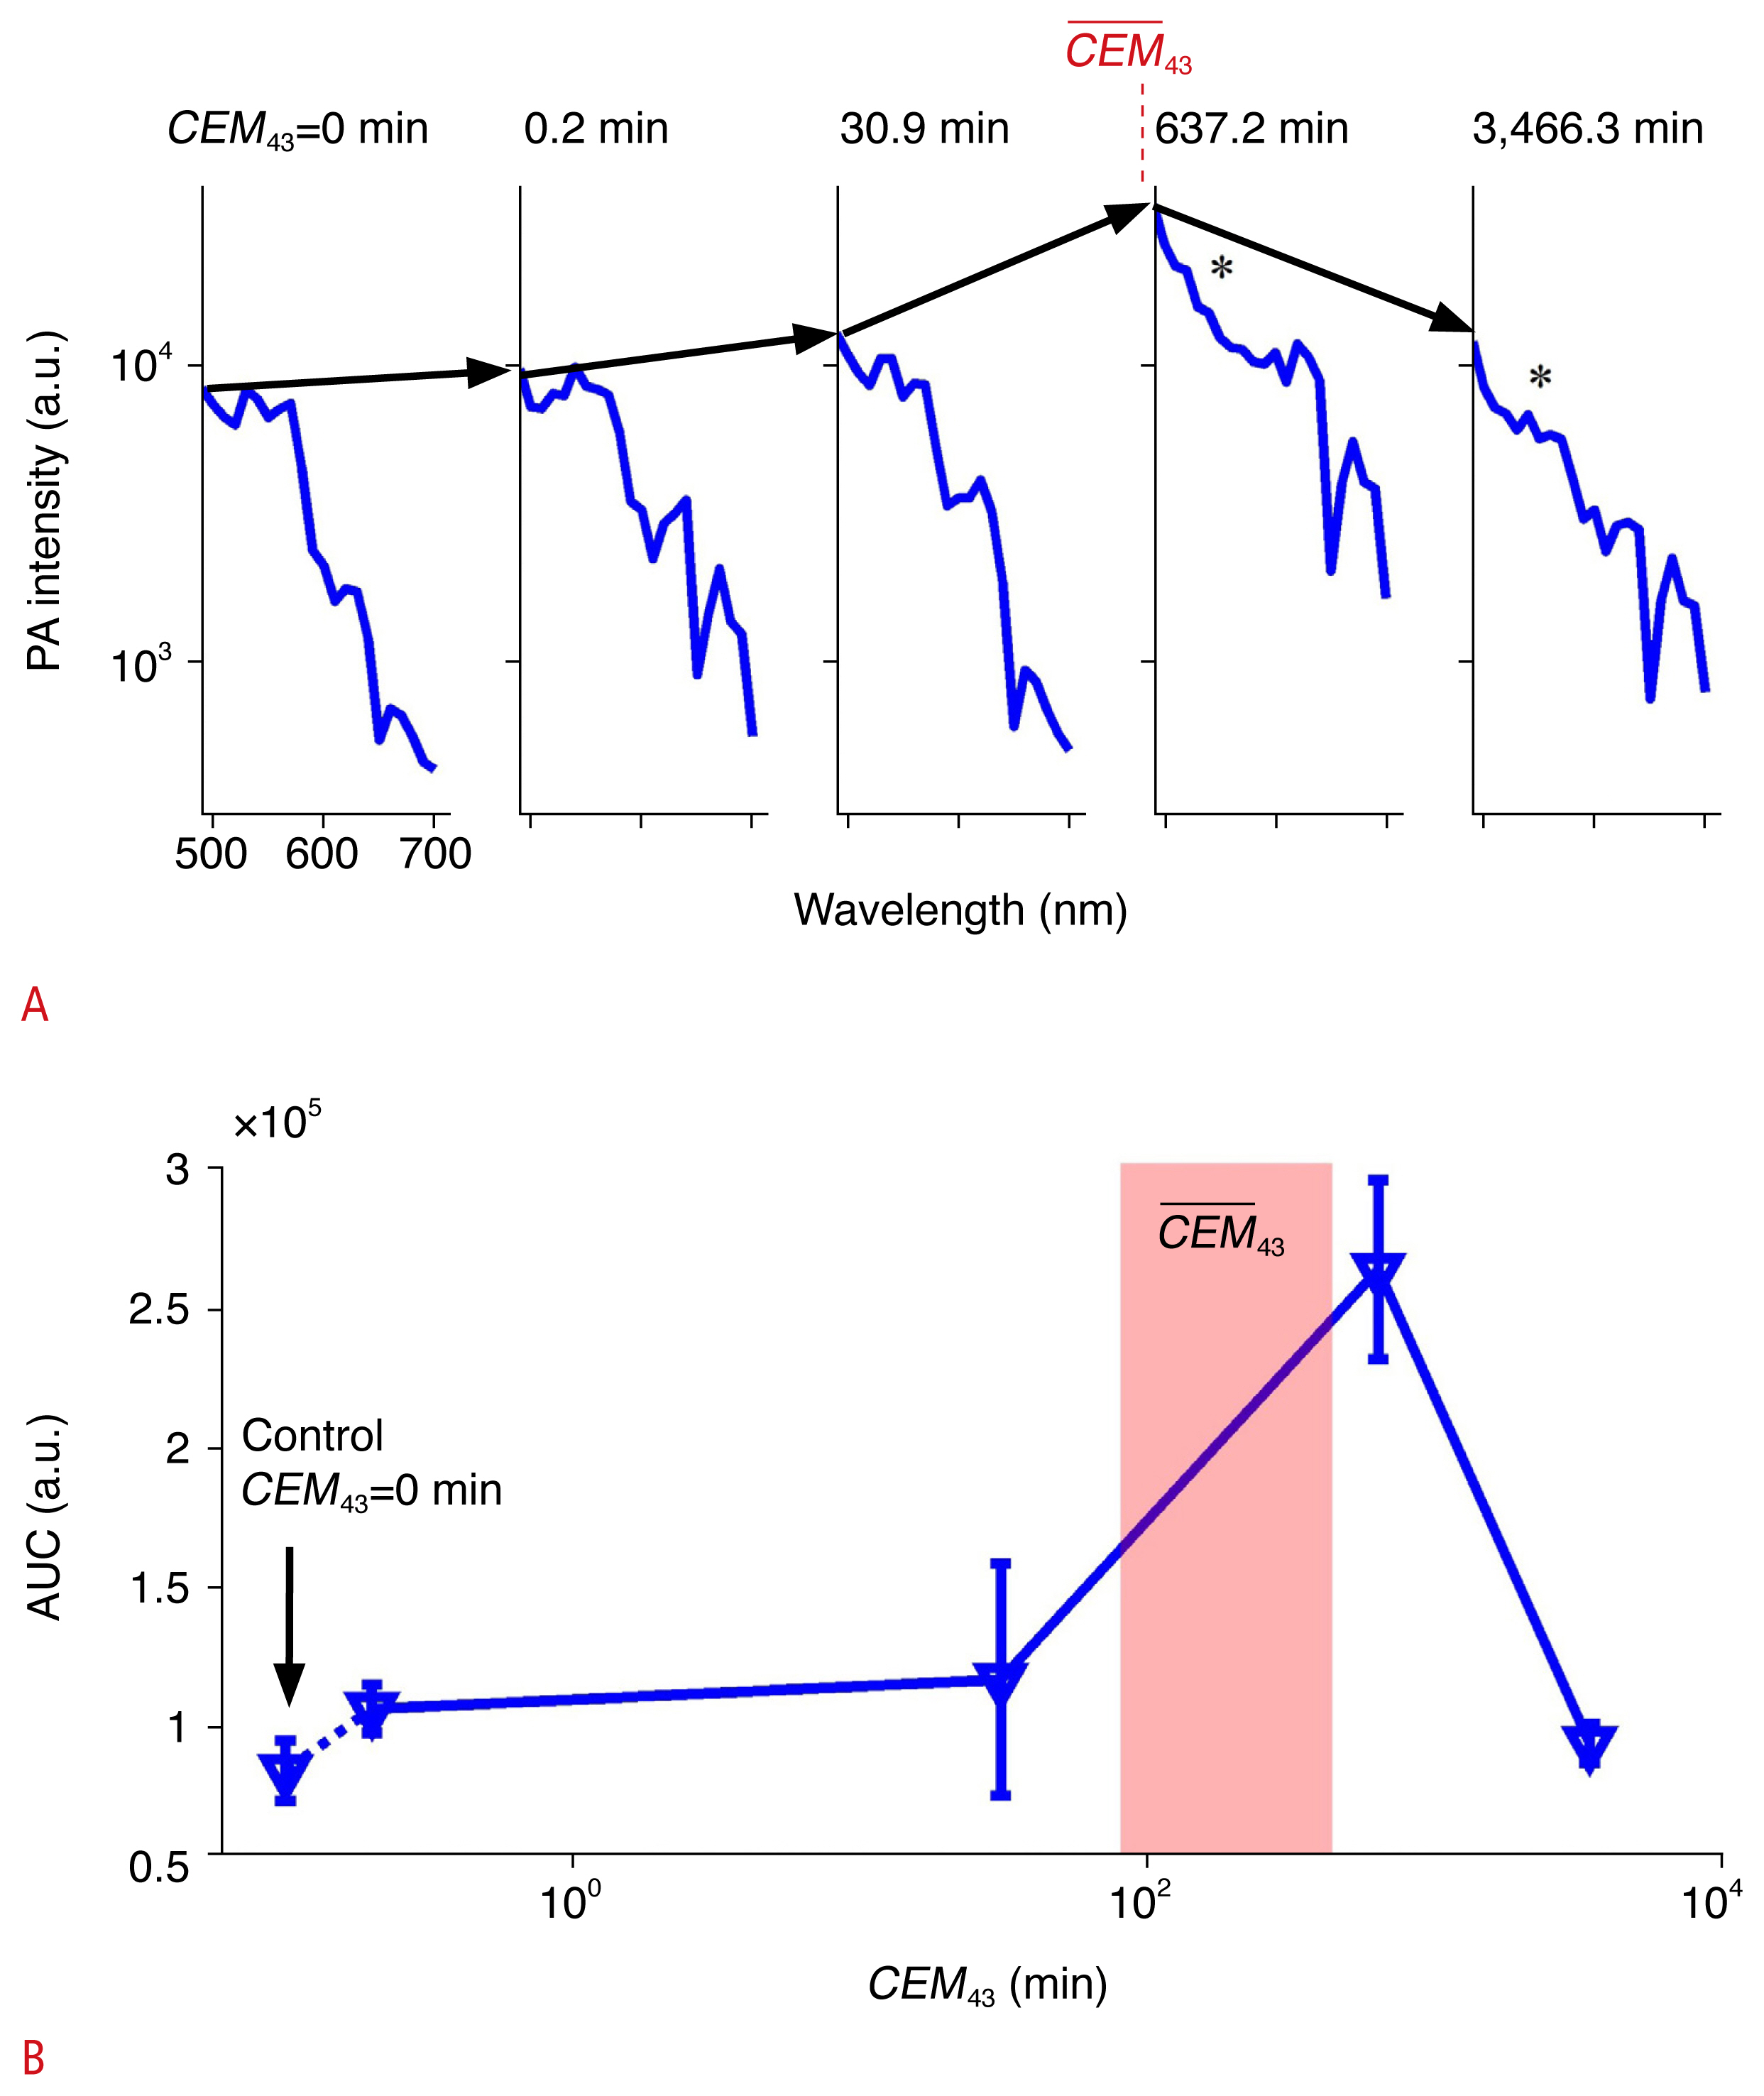
Fig. 4A shows the calibrated PA spectra in the thermal therapeutic processes over the 490–700 nm range. In the control data (i.e., CEM43=0 minute), a clear hemoglobin spectrum was observed, with the local hemoglobin lobe centered at 560 nm (Fig. 1), indicating that oxygenated hemoglobin (HbO2) and deoxygenated hemoglobin (HbR) were the predominant absorbers in the fresh ex vivo liver tissue. As the thermal dose increased, the local hemoglobin peaks gradually lowered and became almost indistinguishable when CEM43 was longer than the
C E M ¯ 43
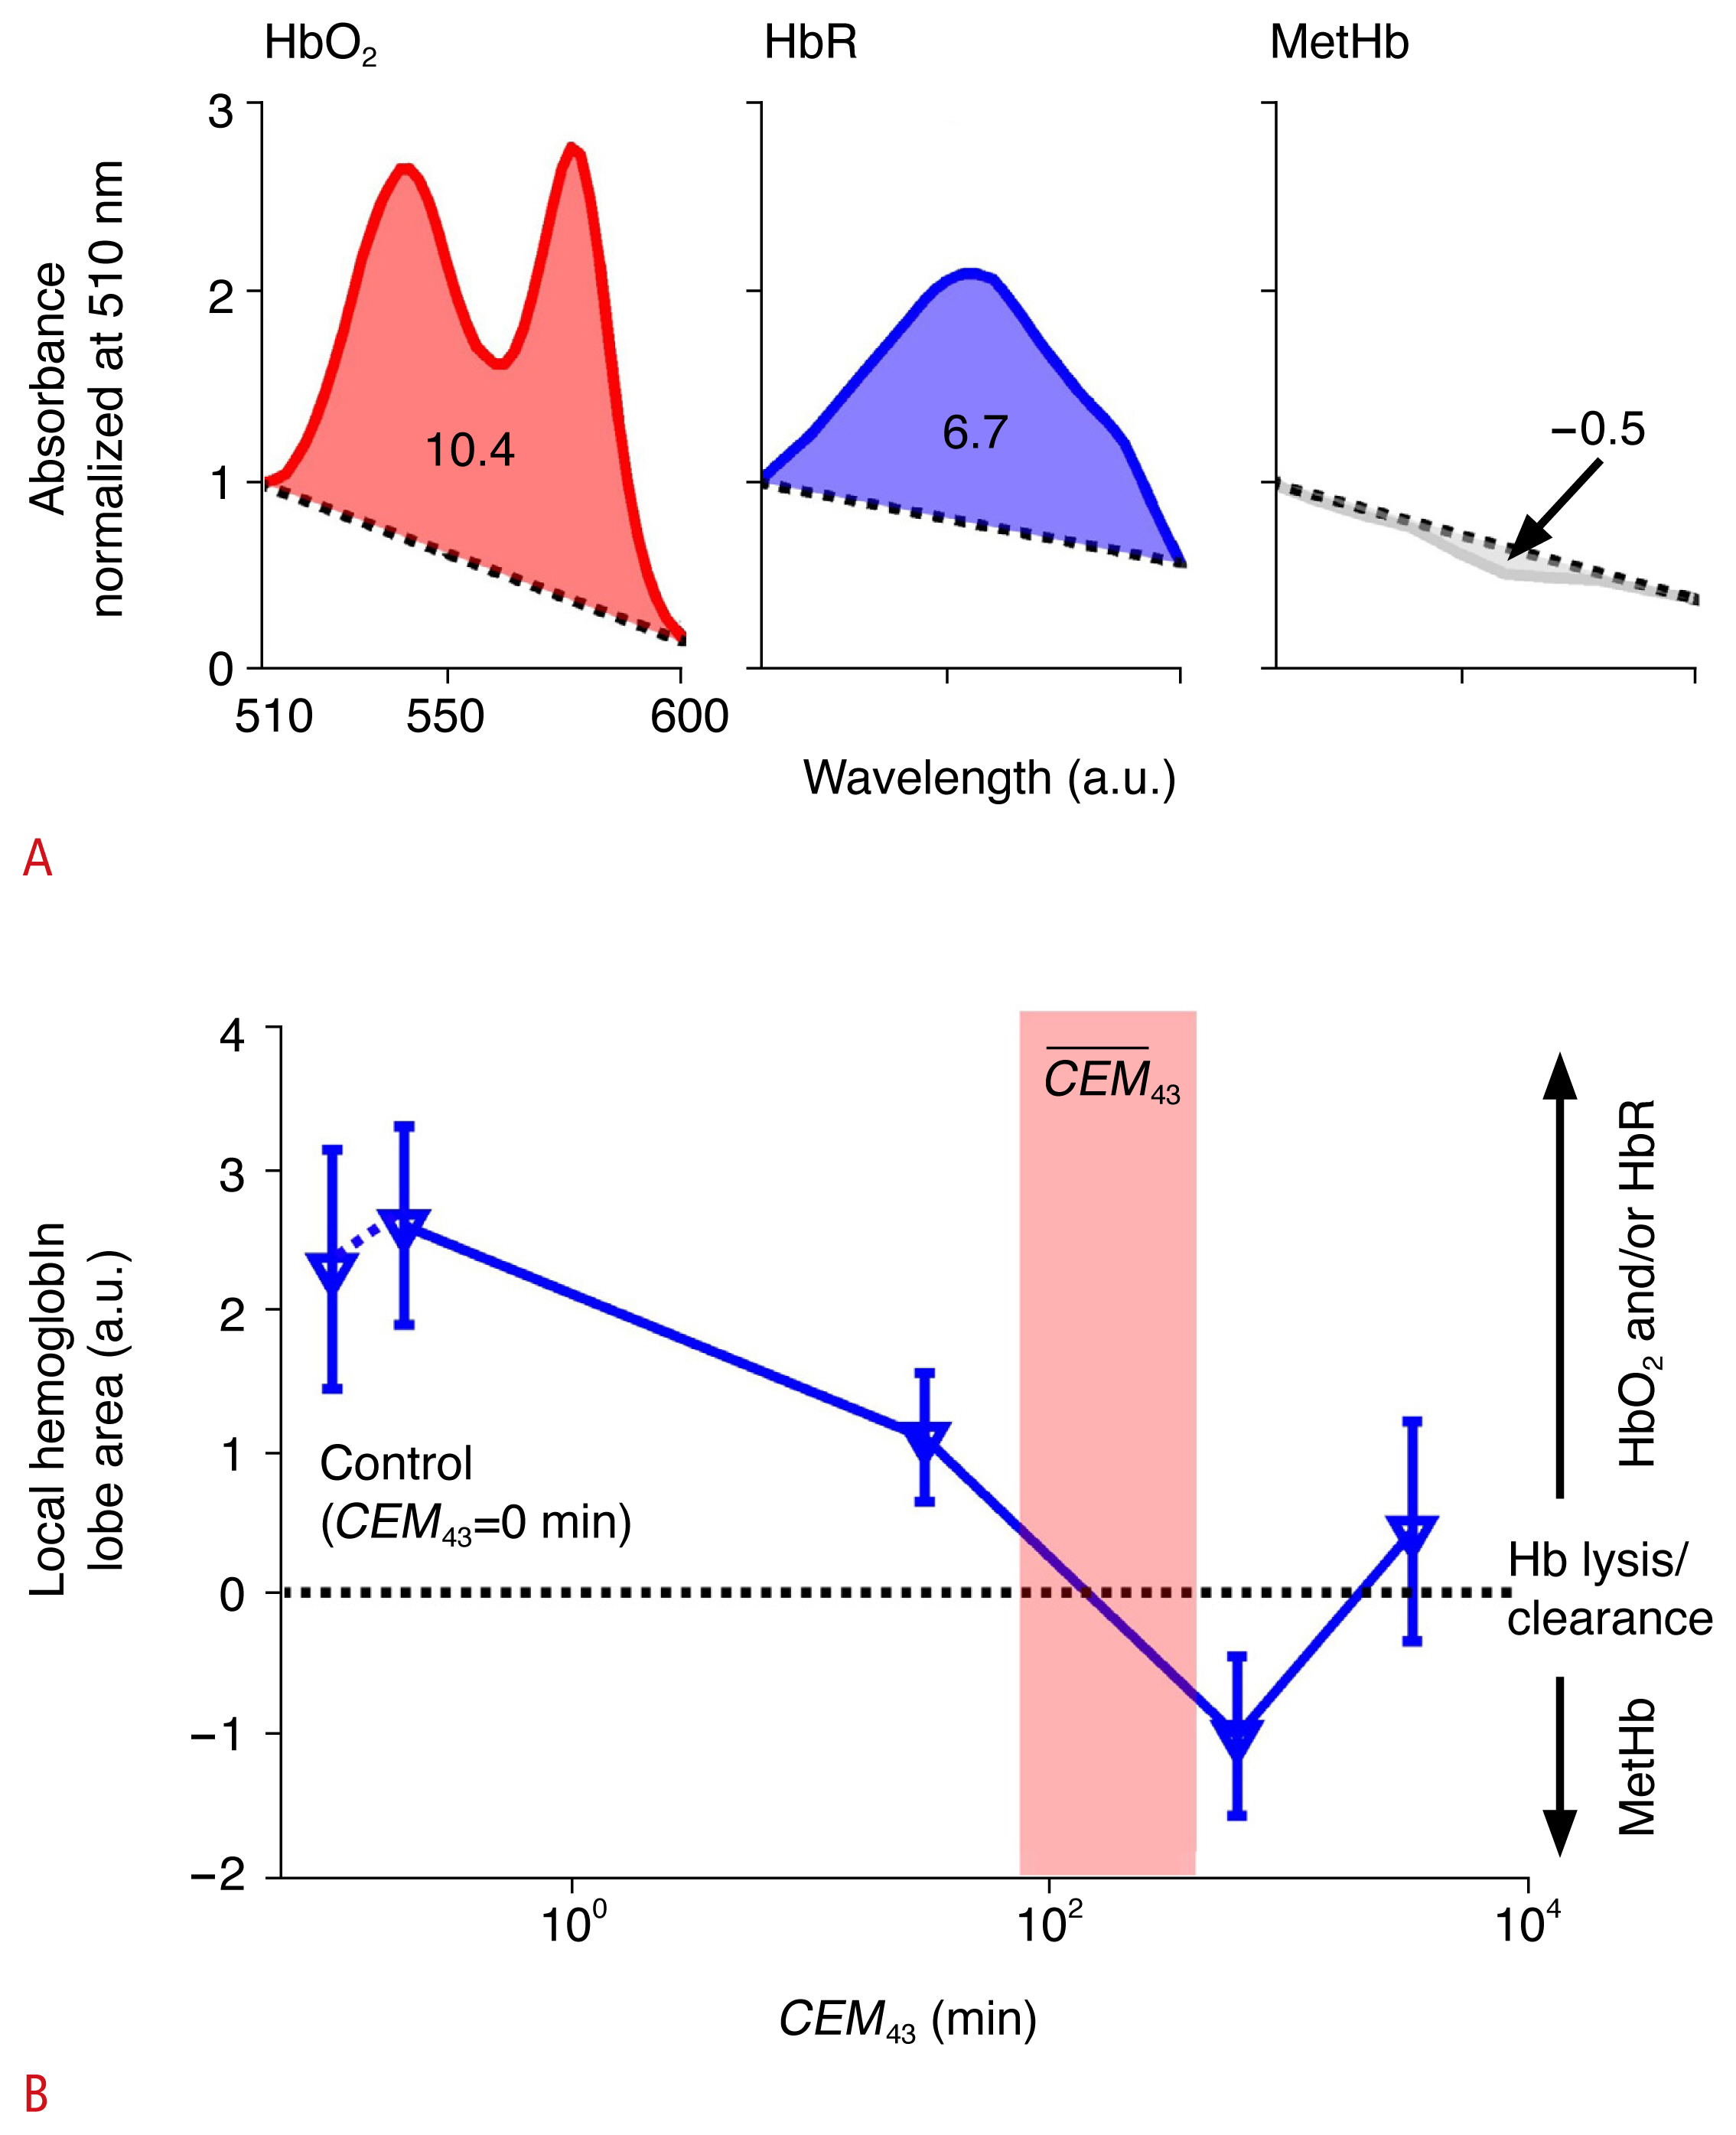
Based on previous studies [18,26], thermal ablation triggers a transition of blood chromophores into a modified species known as MetHb. The absorption spectrum of MetHb is known to present a higher absorbance in the visible range and complete loss of the hemoglobin peaks at 560 nm (Fig. 1) [20]. Due to these spectral features, it is suggested that the transition into MetHb could be quantitatively evaluated in terms of the “local hemoglobin lobe area,” which integrates the area of the PA spectrum between 510 nm and 600 nm (normalized at 510 nm) subtracted by the baseline area estimated by a straight line between the PA intensities at the wavelength range, as expressed by:
where SPA is the target PA spectrum of HbO2, HbR, or MetHb, B is the baseline under the straight line between the PA intensities between a target spectral range from λ1 to λN, which was from 510 nm to 600 nm in this study. Therefore, SPA (λ1) and SPA (λN) are equal to B (λ1) and B (λN). N is the number of wavelengths and is 10 with 10-nm intervals between 510 nm and 600 nm.
This range includes a local hemoglobin lobe centered at 560 nm; therefore, a positive area value is expected when HbO2 and/or HbR is dominant before the thermal treatment. However, MetHb does not have a lobe in the spectral range, so its predominance will remove the lobe within the spectral range. As a reference, the HbO2 and HbR spectra obtained from [19] and the MetHb spectrum obtained from Zijlstra et al. [27] produce local hemoglobin lobe areas at 10.4, 6.7, and −0.5, respectively (Fig. 5A). Only MetHb produces a negative area value close to zero in the spectral range, which can serve as a distinct feature in identifying the therapeutic progress. Fig. 5B shows the local hemoglobin lobe area value at each CEM43. In general, the local hemoglobin lobe area progressively decreased and formed an intercept into a negative value within the
C E M ¯ 43
Interestingly, there was a sudden global drop in the PA spectrum at the extreme CEM43 of 3,466.3 minutes (Fig. 4B). Moreover, the local hemoglobin lobe area value converged near zero, as shown in Fig. 5B, which means that there was no substantial presence of hemoglobin contents in the therapeutic focus. Based on these two observations, it is hypothesized that complete lysis or clearance of the hemoglobin contents at the therapeutic focus induced the sudden and dramatic change. Therefore, these results indicate a loss of the local hemoglobin lobe and intensity drop as potential metrics to evaluate the progressive thermal therapeutic process from mild to complete thermal ablation.
In a closer view, an optimal wavelength was determined to secure the maximal contrast resolution. The PA intensity at 490 nm was significantly higher than that at the NIR wavelength of 700 nm. The intensity ratio between 490 nm and 700 nm indicated 18.6, 16.4, 34.1, 21.3, and 13.9 times higher amplifications when CEM43 values were 0, 0.2, 30.9, 637.2, and 3,466.3 minutes, respectively. The PA signal at a wavelength longer than 490 nm did not improve contrast. Therefore, selecting a wavelength as short as possible in the visible spectral range (490–700 nm) would be a practical approach for securing a higher signal-to-noise ratio. The data also made it possible to evaluate the optimal wavelength range to identify the contrast change of the visible PA spectrum when CEM43 transitioned from below to above
C E M ¯ 43
Histopathological Validation of Thermal Ablation
Fig. 6A shows the H&E histopathologic images of the ablated liver tissue for different thermal exposure times. No thermal ablation was found with the CEM43 values under the
C E M ¯ 43
Discussion
This paper presents the feasibility of the high-contrast PA tissue characterization of thermal ablation in the visible spectrum. An ex vivo evaluation using fresh porcine liver tissues showed a noticeable change in the visible PA spectrum when the CEM43 exceeded the
C E M ¯ 43 C E M 43 > C E M ¯ 43
The efficacy of this technology is not limited to certain thermal therapeutic modalities (e.g., RFA, HIFU, PTT), but a careful design would be needed to maximize its clinical efficacy. For example, RFA already introduces a minimally invasive needle into the tumor and extends the electrodes for thermal generation throughout the volume, and US imaging guidance is involved in placing them in the proper position. In this case, implementing optical fibers to deliver the visible spectrum as one or few of the RFA electrodes could produce continuous monitoring of the volumetric RFA process without substantial changes in the clinical protocol, which has never been provided. Encouragingly, several predicate PA sensing devices have integrated either acoustic or optical sources in a needle or catheter. However, using an acoustic part near the heat source would be ineffective since it would be vulnerable to ambient heat deposition [28]. Conventional piezoelectric transducers only tolerate up to approximately 50°C [29], indicating that they are incapable of enduring high temperatures during thermal therapy. Special customizations for thermal isolation would be only achieved with substantial costs of large tool size, higher fabrication costs, and deterioration of acoustic properties [30]. In contrast, optical modality fibers can have higher heat tolerance, up to a few thousand degrees Celsius, based on readily available materials and coating techniques [31]. Other studies have tested configurations to isolate the light and acoustic components, but their clinical applications focused on tool tracking rather than providing a molecular tissue characterization feature to monitor dynamic interventional and/or therapeutic processes [32,33].
Many aspects still must be addressed to secure the translational practicality of this technique. The scope of this study did not yet cover real-time monitoring of thermal ablation during treatment—instead, ex vivo targets were controlled to sorely evaluate the visible PA spectral changes without the thermal effect, which would produce a significant intensity bias during the treatment process. The authors’ upcoming work will focus on advancing this technology toward a tool for real-time monitoring of the thermal ablation process. The authors plan to make a more comprehensive model that merges the PA thermometric and spectrometric capabilities to interpret the visible PA spectral changes as a function of local temperature. In the course of development, statistical rigor will be ensured by testing a vast number of ex vivo tissue samples for PA tissue characterization and H&E histopathology at a finer CEM43 resolution for tissue ablation. Immunohistochemistry will also be performed to validate the transition of hemoglobin into MetHb or further into complete lysis. For example, an excessive thermal dose is known to eventually denature MetHb [34], which might be the reason behind the rebound of the local hemoglobin lobe area with an excessive thermal dose (Fig. 5B).
There are differences between ex vivo and in vivo circumstances. In living tissue, blood flow may act like a coolant, which counteracts the thermal mechanism, leading to slower temperature increases during heating and faster cooling in the post-treatment period [21]. However, the efficacy of PA monitoring will be preserved because the contrast primarily depends on the tissue ablation status; nonetheless, a more thorough in vivo study using a preclinical model should be performed for complete validation. It is also planned to test for any potential interference due to other physiological changes resulting from thermal treatment, including immune and circulatory system responses [35,36].
Spectroscopic PA sensing could also be used for better localization of thermal therapy using an exogenous contrast agent targeting aggressive tumors. For instance, prostate-specific membrane antigen is a type-II integral cell-surface membrane protein that is overexpressed more in aggressive prostate cancer epithelium cells and the neovasculature of non-prostatic cancers (lung, kidney, colon, stomach, breast, and brain). Several promising studies have presented successful development and deployment of targeted contrast [37–39]. Integration of our PA treatment monitoring workflow with the contrast agent technology will lead to a novel framework that allows pre-treatment tissue characterization in the spatiospectral domain, leading to better thermal localization of target lesions.
 Download Citation
 PDF Links
 PubReader
 ePub Link
 Full text via DOI


