

 Print
Print facebook
 twitter
 Linkedin
 google+

Key points
Liver stiffness measured using two-dimensional shear wave elastography can be a quantitative parameter for diagnosing hepatic veno-occlusive disease. Liver stiffness measured using two-dimensional shear wave elastography increases in pediatric patients who develop hepatic veno-occlusive disease after hematopoietic stem cell transplantation.
Introduction
Hepatic veno-occlusive disease (VOD), also termed sinusoidal obstructive syndrome, is a hematopoietic stem cell transplantation (HSCT) complication in pediatric patients with hematologic-oncologic malignancies [1]. VOD can be attributed to high-dose alkylating chemotherapy regimens, which initiate injury to the hepatic sinusoidal endothelium and eventually lead to portal hypertension [1–3]. VOD is characterized by weight gain, ascites, jaundice, hepatomegaly, and hepatic dysfunction-related laboratory parameter abnormalities [1]. An early diagnosis and non-invasive quantitative monitoring methods are necessary to improve patients’ overall survival [4–6].
Conventional ultrasound methods for diagnosing VOD are based on gray-scale and color Doppler sonography findings according to Lassau’s criteria or the HokUS-10 scoring system [7–10]. These findings include hepatomegaly, splenomegaly, gallbladder wall thickening, ascites, and an abnormal portal flow direction. However, poor sensitivity and specificity remain an obstacle limiting the use of ultrasonography as an effective tool for early VOD diagnosis and predicting clinical progression [8,9].
Recent studies have reported the advantages of two-dimensional shear wave elastography (2D-SWE) in the quantitative assessment of liver stiffness in pediatric patients with various hepatic pathologies [11–13]. The benefits of 2D-SWE have been demonstrated in children with chronic liver diseases such as non-alcoholic fatty liver disease [12]. Liver stiffness determined by 2D-SWE can reflect severe inflammation, tissue swelling, obstructive cholestasis, or portal hypertension [12]. However, there are still few reports on the clinical effectiveness of liver stiffness measurements in VOD. Therefore, this study aimed to assess the usefulness of 2D-SWE for diagnosing VOD and differentiating patients based on the severity of VOD. Subsequently, we explored its potential as a quantitative parameter for VOD through a longitudinal assessment.
Materials and Methods
Compliance with Ethical Standards
The institutional review board of Seoul National University Hospital (IRB No. 2104-210-1215) approved this retrospective study and waived the requirement for informed patient consent. All methods were performed in accordance with the relevant guidelines and regulations.
Patient Selection
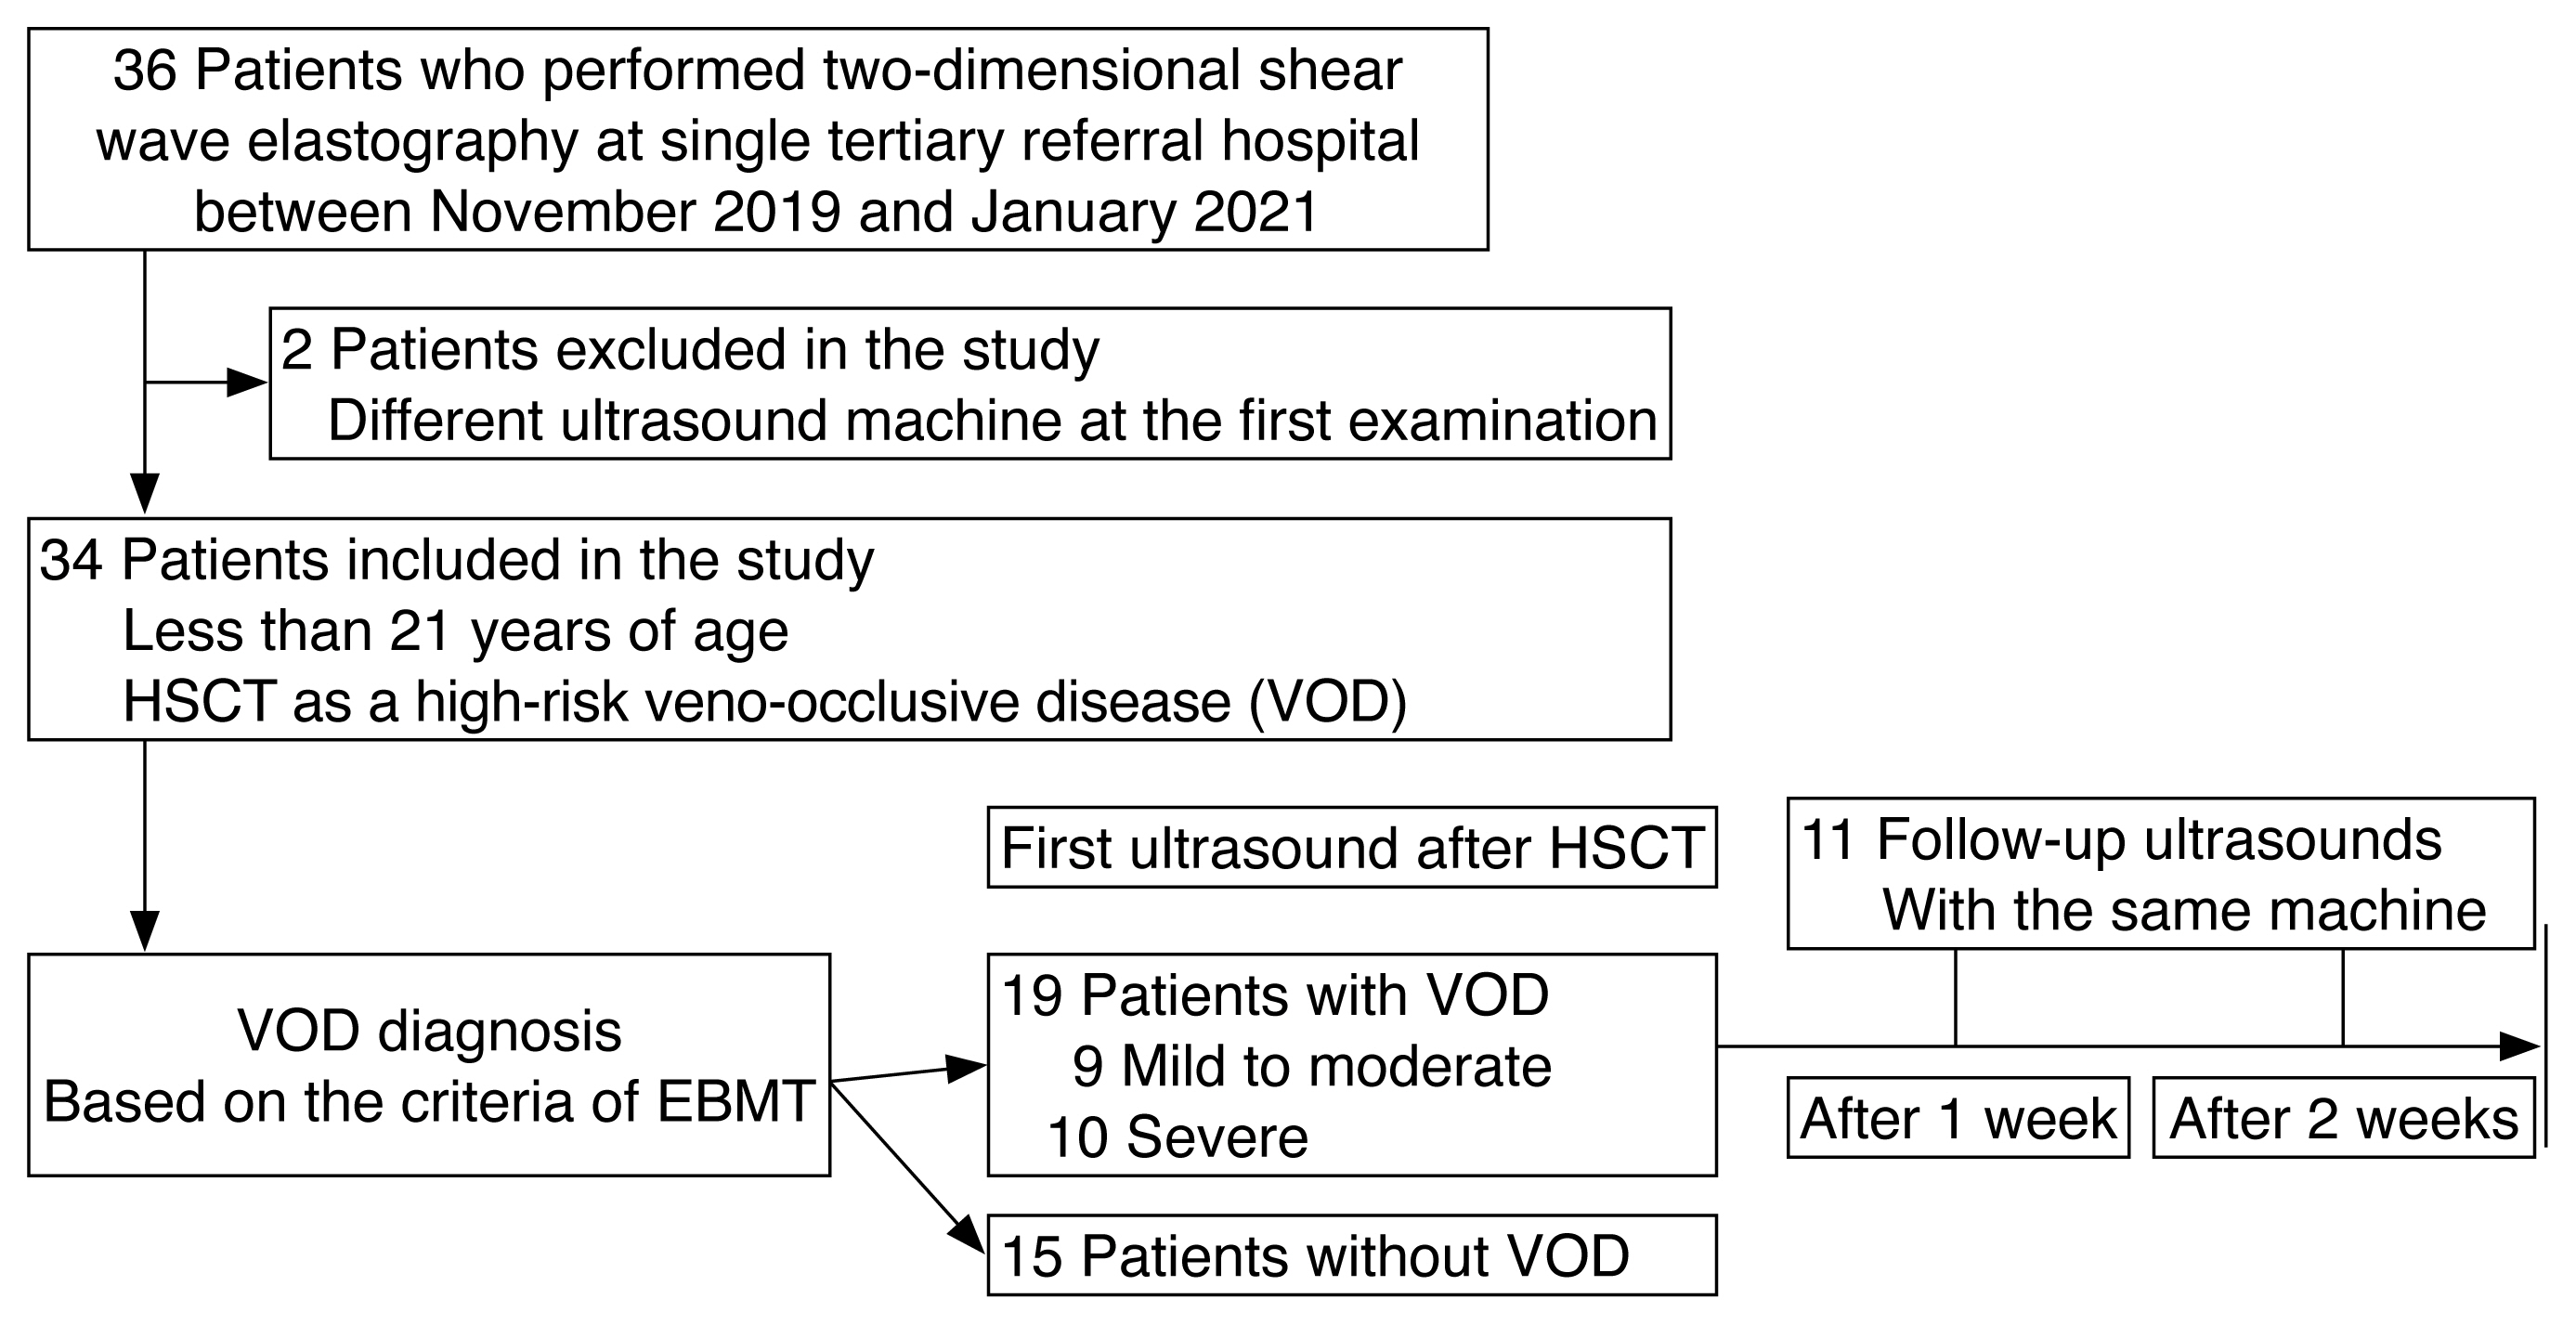
This study retrospectively included pediatric patients who underwent HSCT at a single tertiary referral hospital between November 2019 and January 2021. The inclusion criteria were as follows: (1) less than 21 years of age, and (2) patients at high-risk for VOD. At the authors’ affiliated institution, the high-risk VOD group was characterized by the following conditions: two or more HSCTs, haploidentical HSCT using a myeloablative conditioning regimen, more than eight chemotherapy cycles for solid tumors, or high-dose alkylating chemotherapy conditioning regimens, such as double alkylating agents [14–16]. Of the 36 high-risk patients, two patients were excluded due to the use of different ultrasound machines. The same machine for ultrasound examinations was used in all other patients to ensure consistency in this study (Fig. 1). The age of the enrolled patients was 8.7±5.0 years (range, 2 to 21 years), and both sexes were equally represented (17 girls, 17 boys). There were 27 cases of allogeneic HSCT and seven cases of autologous HSCT. Treatment was as follows: 10 patients received busulfan, four received cyclophosphamide, and 17 received both busulfan and cyclophosphamide. In addition, three patients (8.8%) had a history of VOD development during the first HSCT.
Clinical Assessment
All clinical and laboratory data were retrospectively obtained from the electronic medical records on the patient’s ultrasound examination date. The diagnosis and severity grading of VOD were based on the European Society for Blood and Marrow Transplantation (EBMT) criteria [6]. VOD was diagnosed as having two or more of the following conditions: transfusion-refractory thrombocytopenia, weight gain >5% or unexplained weight gain over 3 consecutive days, hepatomegaly, ascites, and hyperbilirubinemia on 3 consecutive days or hyperbilirubinemia ≥2 mg/dL [6]. VOD severity was assessed based on the presence of liver aspartate aminotransferase (AST) or alanine aminotransferase (ALT) abnormalities, a high serum concentration of bilirubin, and ascites [6]. The degree of severity was categorized into two groups, mild to moderate and severe, to investigate the risk factors for disease progression as it has been reported that the mortality rate is significantly higher in patients with severe VOD [17,18]. Patients diagnosed with VOD received additional treatment with antithrombin III or defibrotide until the VOD resolved.
Ultrasound Examination
All 34 patients were evaluated for VOD diagnosis and severity grading. Our institutional ultrasound protocol for monitoring VOD includes gray-scale and color Doppler examinations before and after HSCT. Although all patients underwent ultrasound examinations before HSCT, only 13 sessions with 2D-SWE were performed on the 34 patients and were the baseline ultrasound examination before HSCT. If patients were diagnosed with VOD, follow-up ultrasound examinations were repeatedly performed. If patients were not diagnosed with VOD, only one to two follow-up ultrasound examinations were performed when patients were discharged from the sterile room. After HSCT, we assessed the first ultrasound findings and evaluated the weekly follow-up examinations using the same machine in the VOD subgroup (Fig. 1).
All ultrasound examinations were performed by two experienced pediatric radiologists who were randomly assigned (S.L. and Y.H.C. with 7 and 14 years of pediatric ultrasound examination experience, respectively) using the same machine (LOGIQ E9, GE Healthcare, Milwaukee, WI, USA) with a 1–6 MHz convex transducer. Gallbladder wall thickening (>6 mm) and the presence of ascites were assessed. Hepatomegaly and splenomegaly were defined as an increase of more than 1 cm relative to baseline measurements. A peak velocity of <10 cm/s or reversed flow in the portal vein was considered abnormal. Hepatic vein flow was considered abnormal if there was a monophasic flow pattern or no detectable flow. An increased resistive index of the hepatic artery was defined as >0.75 [19].
The liver stiffness on 2D-SWE was determined according to previously reported guidelines, using the median value of stiffness recorded from 10 measurements on the right lobe of the liver [13, 20]. Patients maintained a fasting state for a minimum of 2 hours before the examination but were free-breathing in a supine position during the 2D-SWE test [21,22]. The transducer placed a color-coded box in the right liver lobe 1 cm from the Glisson capsule, using a convex transducer (C1–6). A 10 mm circular region of interest was placed inside the box over a uniform portion of the color-coded map, avoiding the portal vein and bile duct, and repeatedly obtained liver stiffness values. Measurements were considered unreliable if the ratio between the interquartile range and the median of valid stiffness measurements exceeded 30%.
Statistical Analyses
To compare the VOD and non-VOD groups at the initial diagnosis, descriptive data were expressed as mean±standard deviation for continuous variables and frequency with percentage for categorical variables. Comparisons were made using the Student t-test and a chi-square test. The ultrasound parameters and laboratory findings of the VOD and non-VOD groups at initial diagnosis were compared. Using a clustered receiver operating characteristics curve, the areas under the curves (AUCs) were compared between 2D-SWE liver stiffness values and other laboratory parameters, considering repeated measurements in each patient [23]. The optimal cutoff values were calculated and the sensitivity and specificity values were identified.
As the data were not normally distributed, the ultrasonographic features according to VOD severity at initial diagnosis were assessed using the Fisher exact test for categorical variables and the Mann-Whitney U-test for continuous variables.
Longitudinal changes in VOD patients were assessed using descriptive statistics while monitoring VOD improvement after the initial diagnosis. Repeated measures analysis of variances was performed with a single factor to determine changes over time in VOD patients. Post hoc Bonferroni-corrected pairwise comparisons were then conducted and trend analyses were applied (linear, quadratic, or cubic).
MedCalc Statistical Software version 20 (MedCalc Software, Ostend, Belgium) was used for all data analyses.
Results
The clinical characteristics of the VOD and non-VOD groups are summarized in Table 1. In total, 19 patients were diagnosed with VOD based on the EBMT criteria with 10 patients presenting with severe VOD. Of these, three patients ultimately developed multiorgan failure and died. All other patients completely recovered from their clinical symptoms.
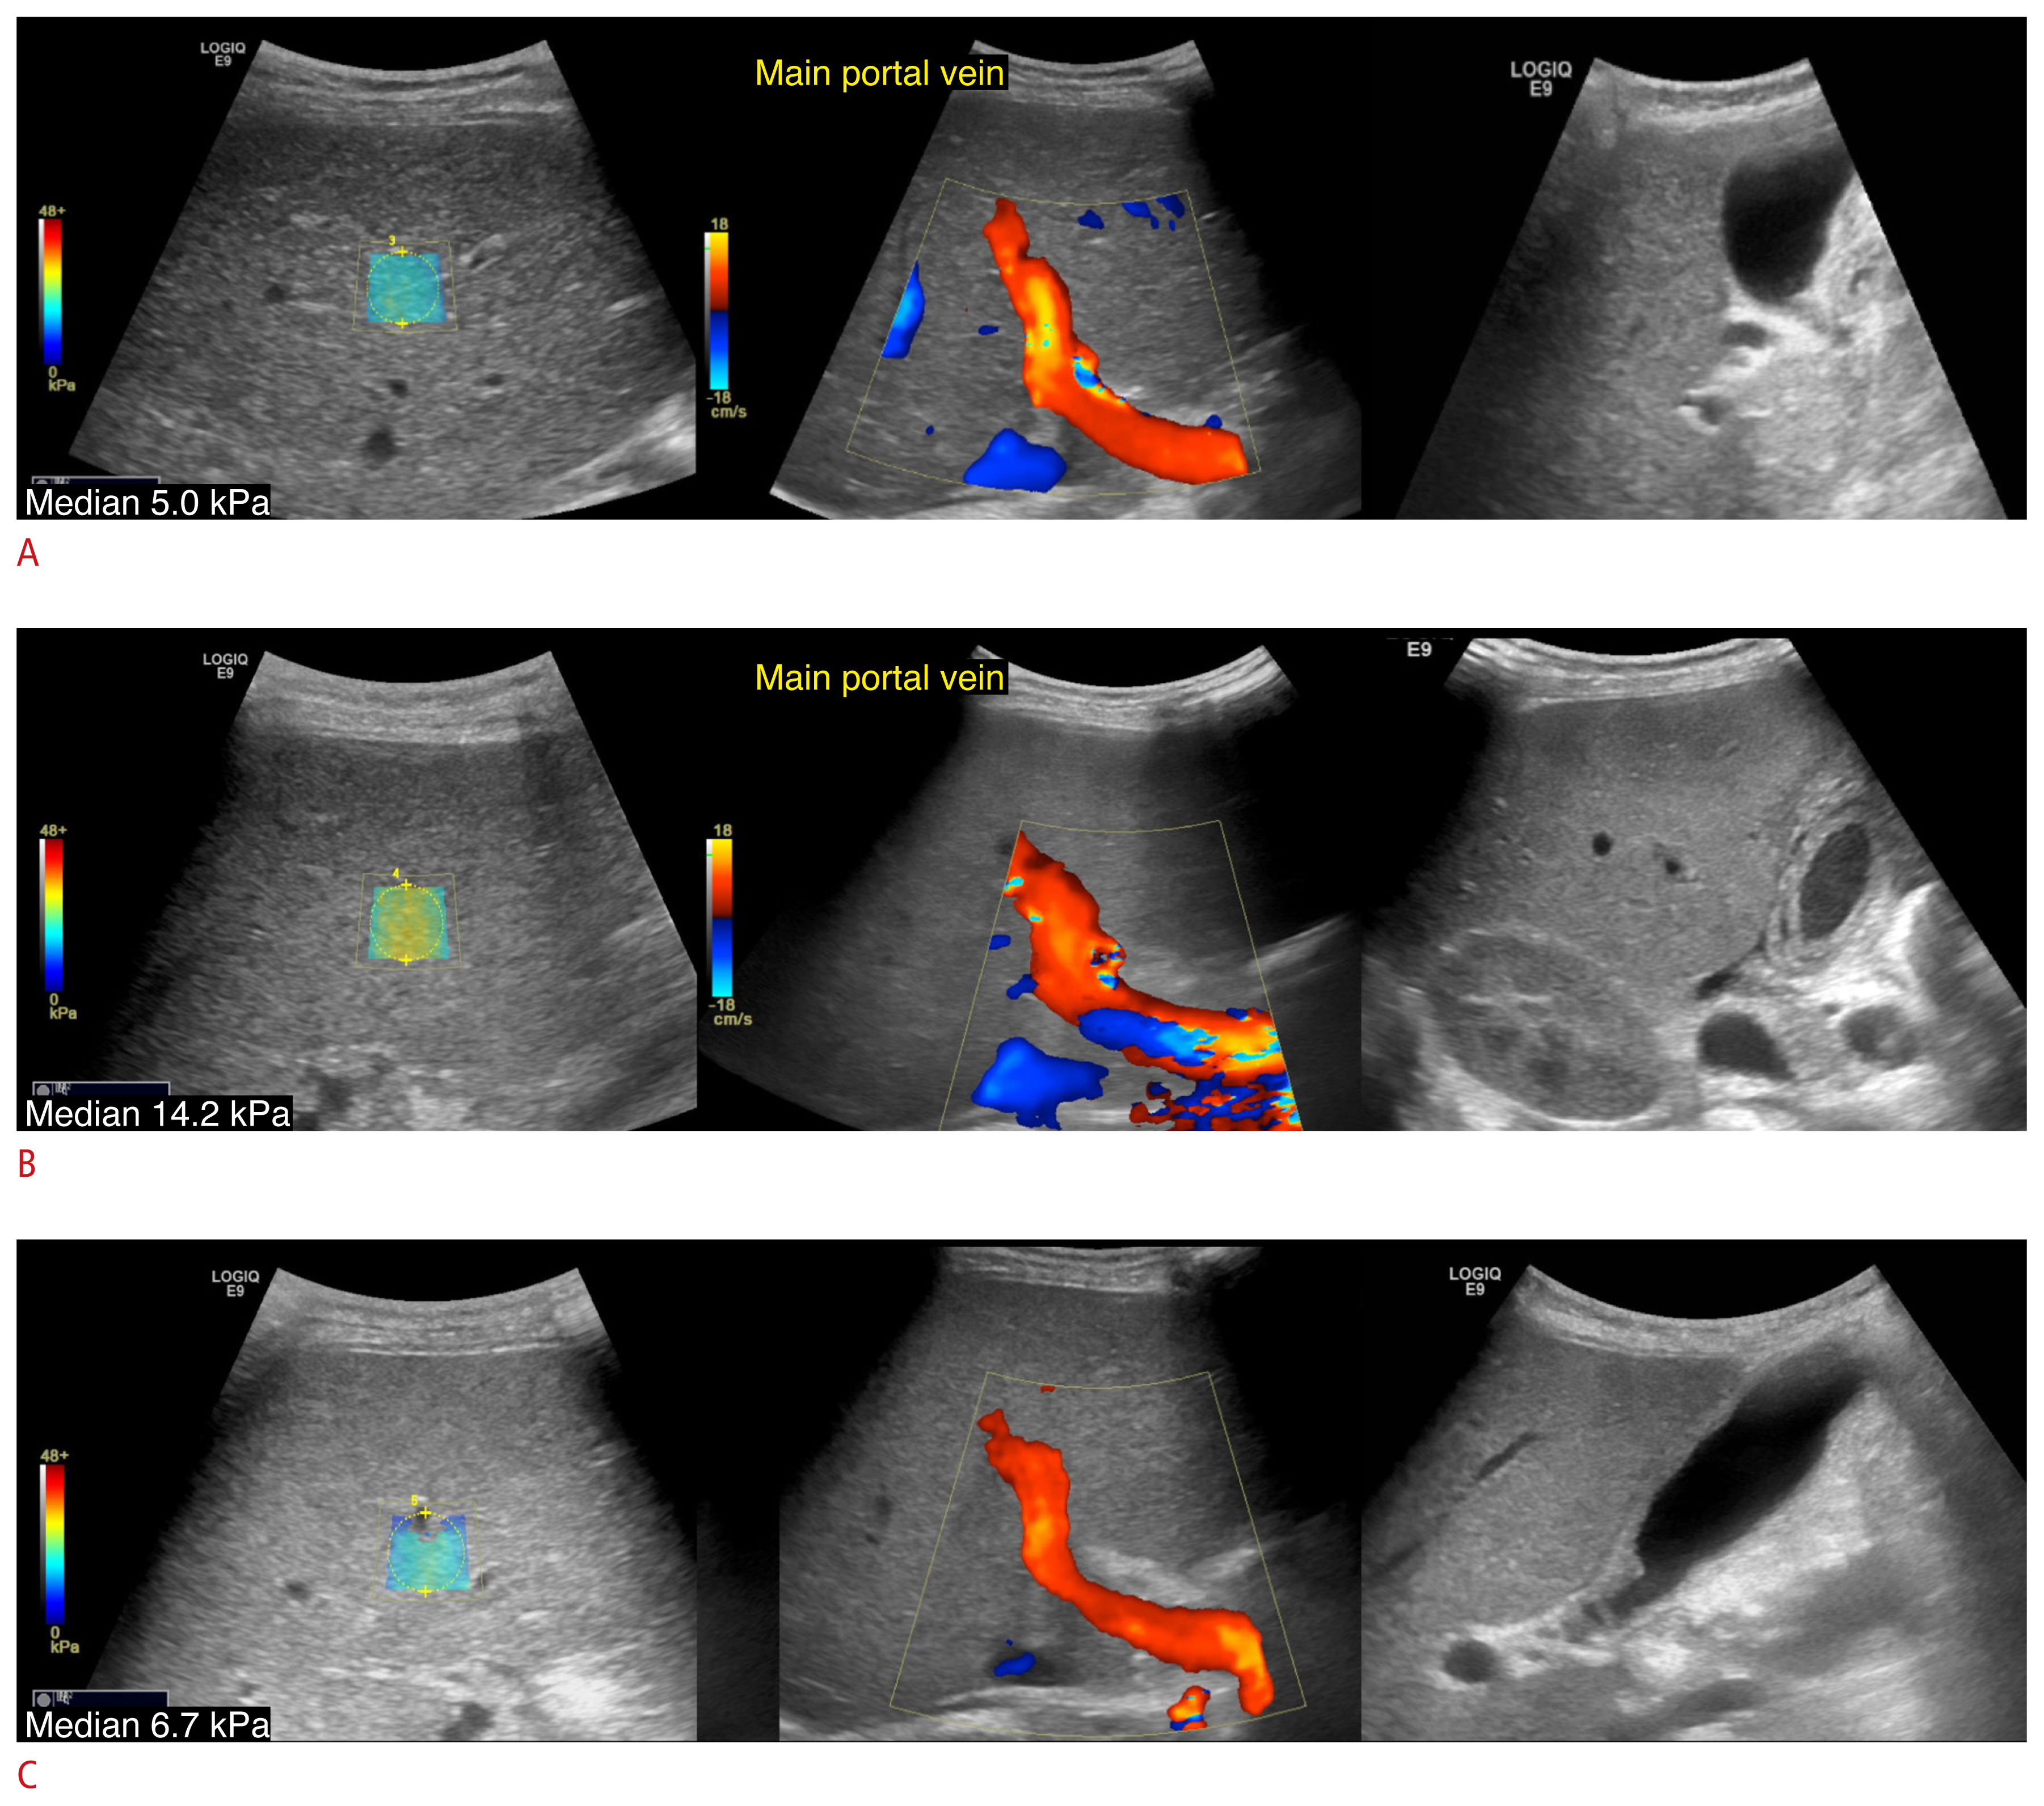
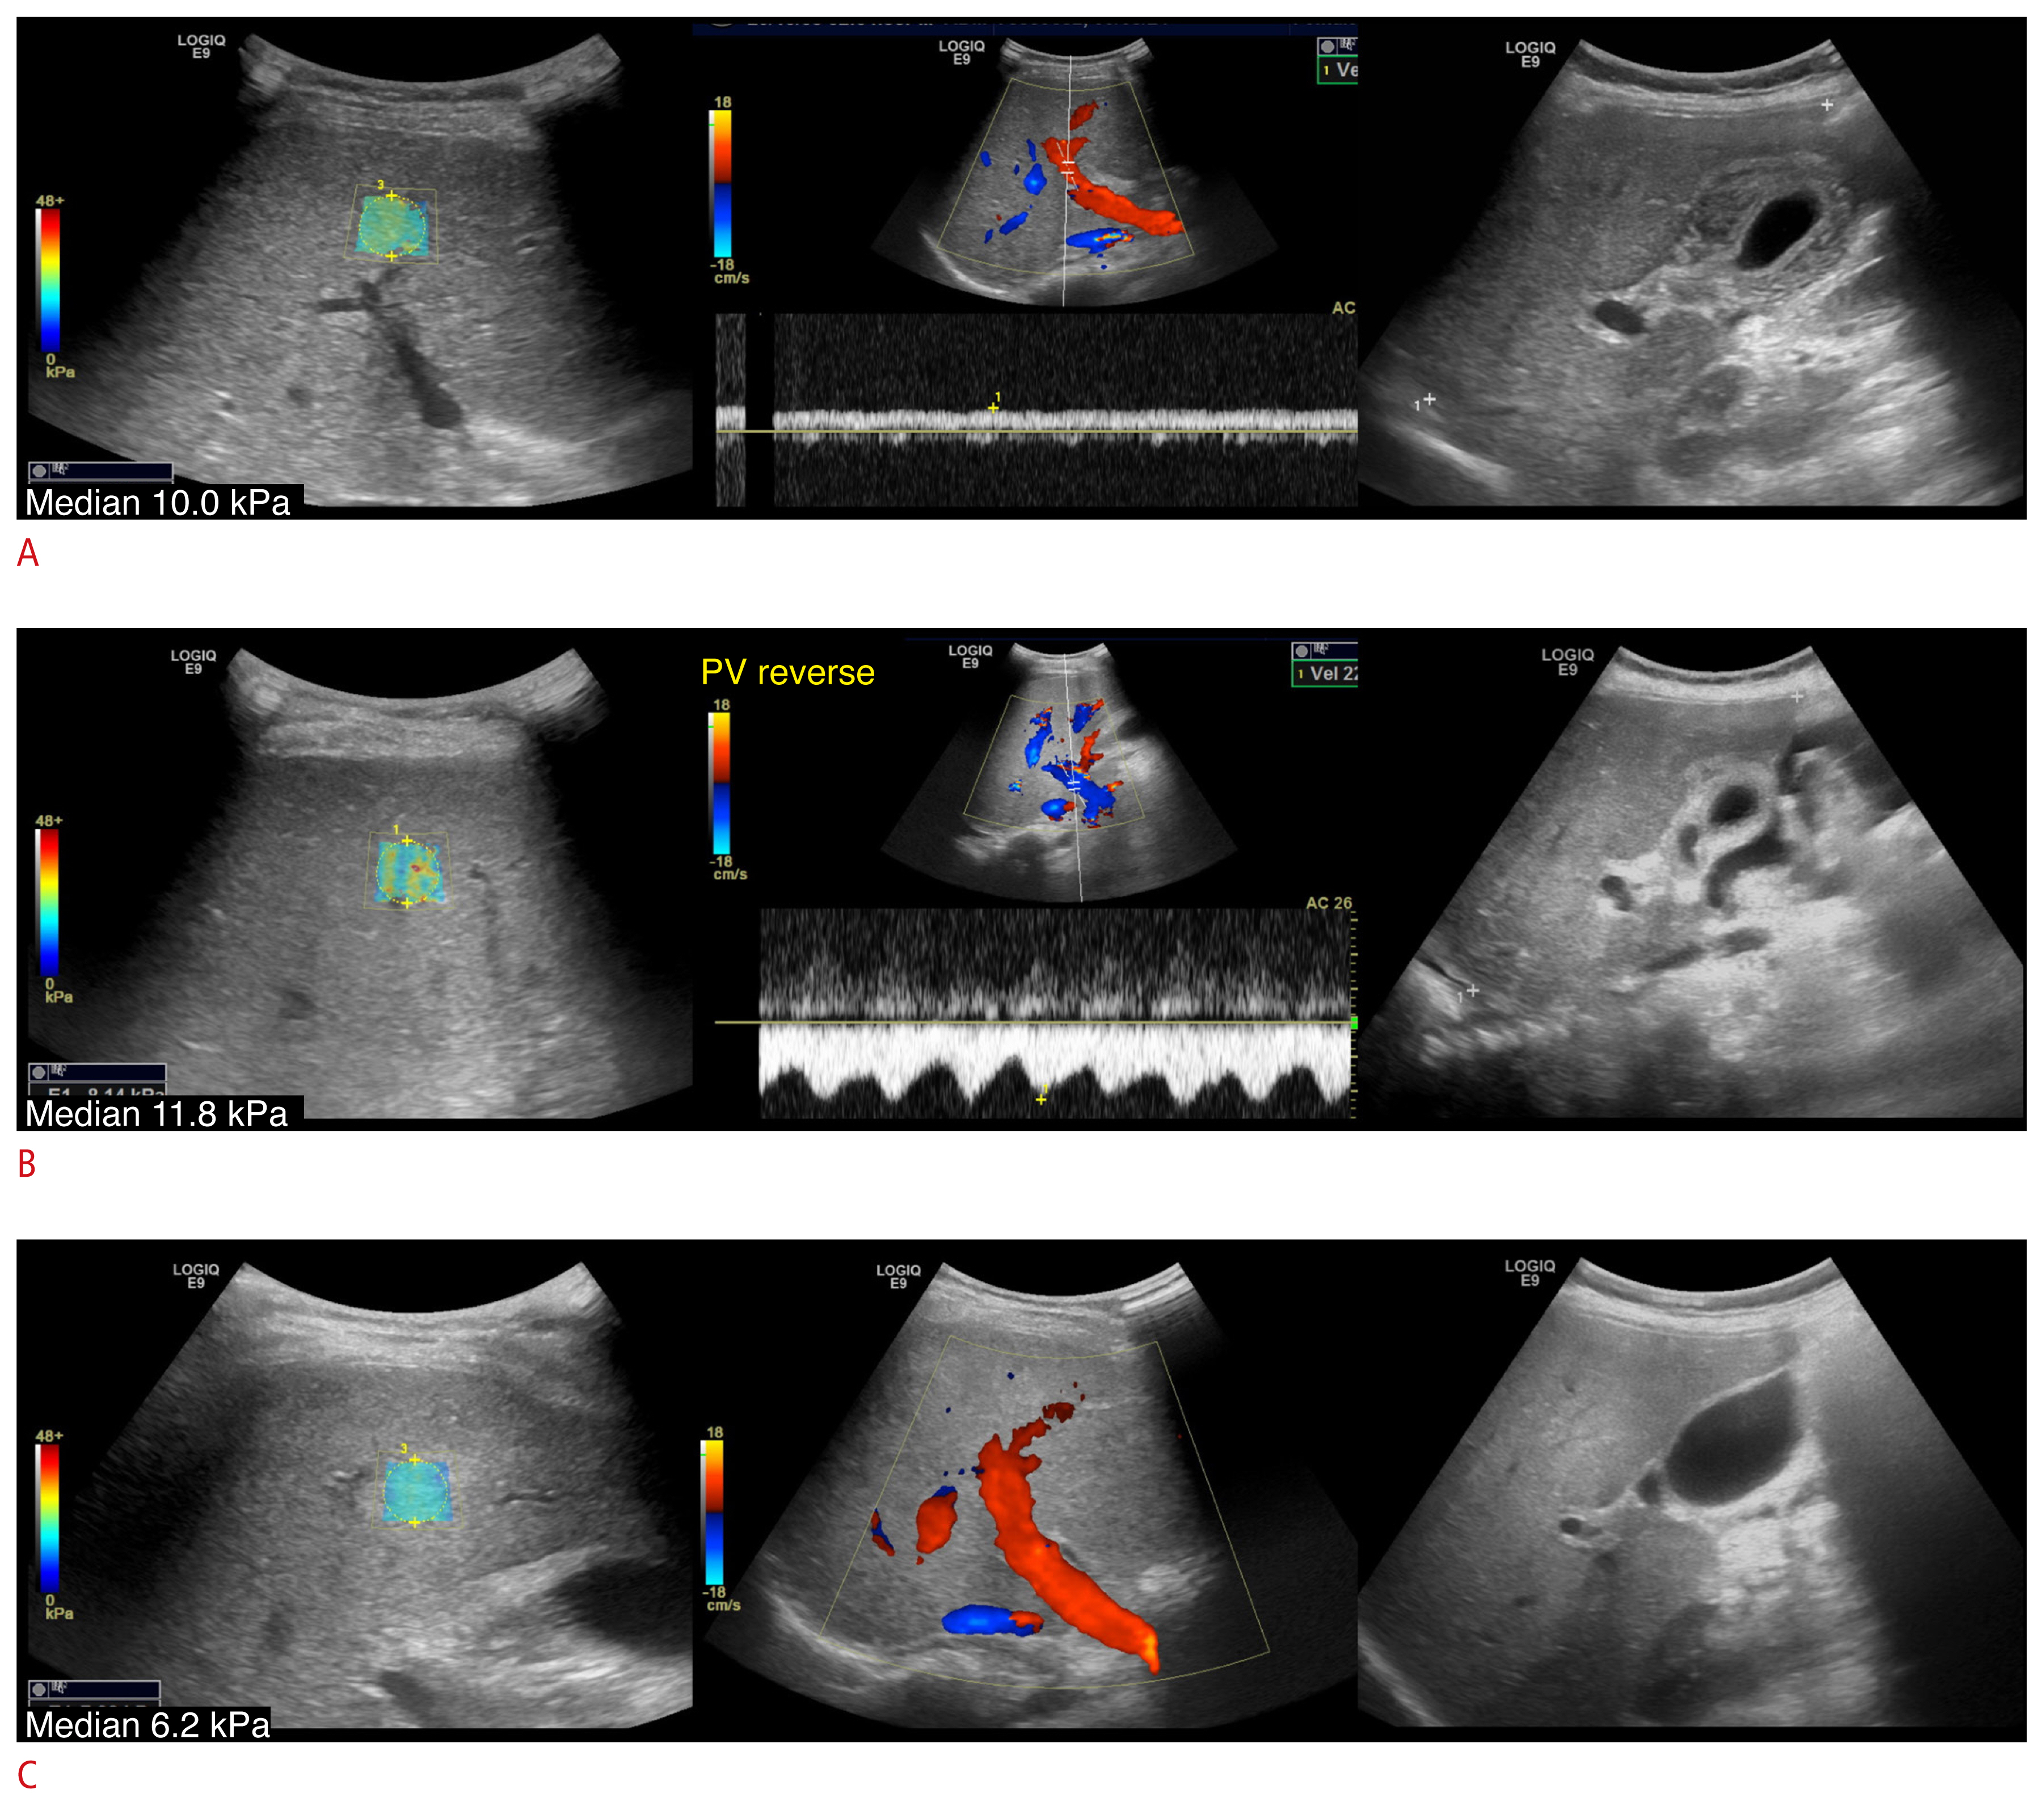
A comparison of the ultrasound and laboratory parameters between the VOD and non-VOD groups at the initial diagnosis is shown in Table 2. Ultrasound evaluations confirmed that all VOD patients had hepatomegaly, ascites, and gallbladder wall thickening. No statistically significant differences in the color Doppler parameters between the two groups were found. However, the reverse flow direction of the portal vein was detected only in the VOD group (4/19, 21.1%). Before HSCT, the baseline liver stiffness was 5.5±1.1 kPa and 4.4±0.8 kPa in the VOD (n=8) and non-VOD (n=5) groups (P=0.470). On the first follow-up exam, the VOD group showed higher liver stiffness values than the non-VOD group (12.4±1.1 vs. 6.3±0.8 kPa, P<0.001). Furthermore, 2D-SWE liver stiffness values above 7.2 kPa showed 84.2% sensitivity and 93.3% specificity in distinguishing VOD from non-VOD (AUC, 0.925; 95% confidence interval [CI], 0.780 to 0.987; P<0.001). The AUC for liver stiffness was higher than that of all other laboratory parameters (AST: AUC, 0.651; 95% CI, 0.469 to 0.806; ALT: AUC, 0.651; 95% CI, 0.469 to 0.806, and total bilirubin: AUC, 0.912; 95% CI, 0.764 to 0.982). Interestingly, elevated liver stiffness was noted before the clinical diagnosis of VOD in three patients (7.9 kPa, 9.1 kPa, and 10.0 kPa at 7, 12, and 17 days after HSCT).
At the initial diagnosis of VOD, both the AST and ALT concentrations were higher in the VOD group, but the difference was not statistically significant (AST: 196.1±72.3 vs. 53.5±8.7 IU/L, P=0.092 and ALT: 145.4±59.2 vs. 64.5±18.0 IU/L, P=0.248). However, the total bilirubin concentration in the VOD group was significantly higher than that in the non-VOD group (2.0±0.4 vs. 0.7±0.1 mg/dL, P=0.007).
The features of VOD severity at the diagnosis are summarized in Table 3. Only AST and bilirubin showed significant differences, while no differences were found in the color Doppler parameters and 2D-SWE liver stiffness values.
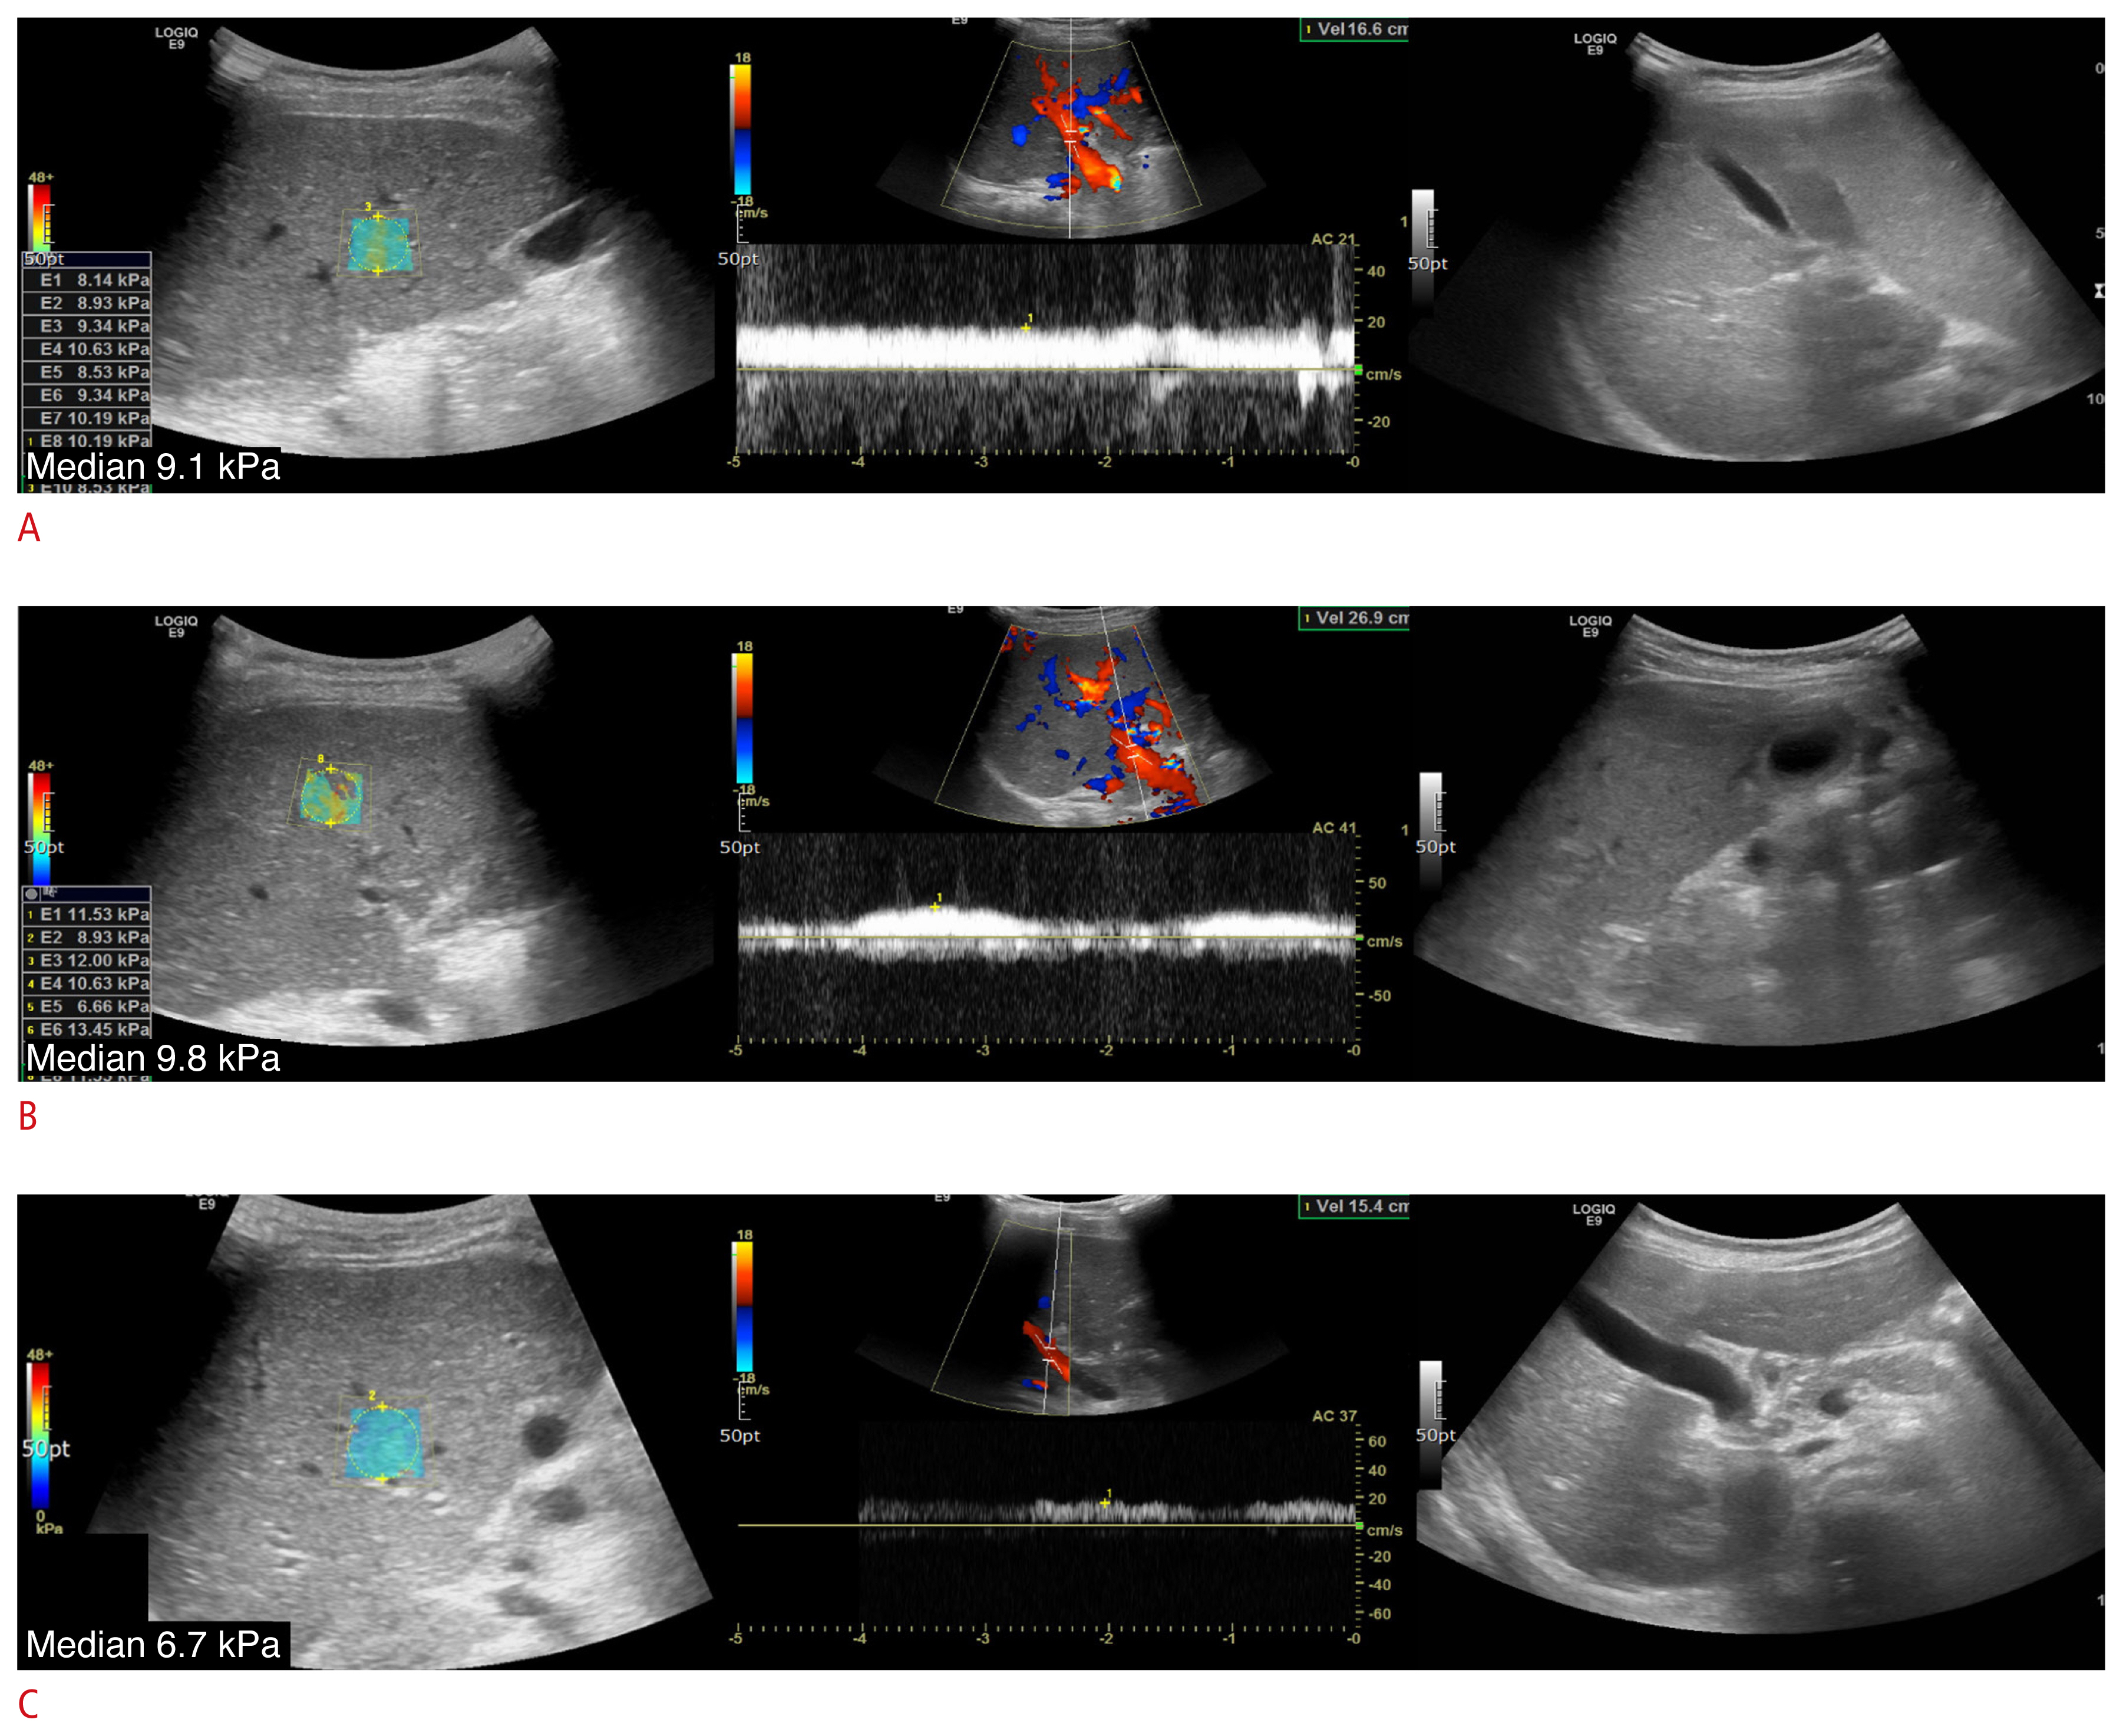
To assess longitudinal changes in VOD patients, we performed a subgroup analysis in 11 of the 19 patients (Table 4). Among the 19 patients, data from six patients at the first and second follow-ups, and two additional patients at the third follow-up, were excluded due to the use of other ultrasound machines. The number of patients with hepatomegaly, splenomegaly, ascites, and gallbladder wall thickening decreased between the first follow-up (16.5±2.5 days) and the third follow-up (32.0±2.6 days) after VOD diagnosis. The number of portal vein abnormalities increased at the second follow-up (24.5±2.6 days) and then decreased. Liver stiffness values, as measured with 2D-SWE, steadily decreased during the follow-up period (13.5±1.7, 11.3±1.4, and 9.5±0.8 kPa, respectively) (Fig. 2). A linear trend in liver stiffness value after VOD diagnosis was noted, but pairwise analysis did not reveal any statistically significant differences between the first, second, and third follow-ups. Laboratory parameters, such as AST and ALT, showed a decreasing tendency, but this was not statistically significant.
Liver stiffness measurements using 2D-SWE in VOD patients can be used as a quantitative parameter for diagnosing VOD at the first follow-up and monitoring treatment response during the subsequent follow-up (Fig. 3). Increased liver stiffness before the clinical diagnosis of VOD and decreased liver stiffness during subsequent treatment are shown in Figs. 4 and 5.
Discussion
VOD is a complication of pediatric HSCT. When measured using 2D-SWE, liver stiffness can provide evidence for diagnosis and be used for quantitatively monitoring disease progression. In the present study, liver stiffness was higher in the VOD group than in the non-VOD group. Additionally, VOD-induced liver stiffness elevation gradually decreased in patients who recovered from VOD.
Several clinical diagnostic criteria, such as the Baltimore, Seattle, and EBMT systems, are currently used to diagnose VOD [6]. However, waiting for patients to meet the diagnostic criteria may prevent an early intervention or result in missed diagnoses due to vague symptoms or not meeting strict laboratory criteria [6,24]. Therefore, there is a need for early predictive and quantitative parameters to monitor patients for VOD after HSCT.
Ultrasound is the most valuable modality for assessing VOD in pediatric patients as it is non-invasive, radiation-free, and readily accessible. It also provides good image resolution. Several previous studies have investigated the role of conventional ultrasound in the diagnosis of VOD [6,25,26]. While it is crucial to assess the presence of hepatomegaly, ascites, and gallbladder wall thickening using conventional ultrasound to predict VOD development, those findings are qualitative indicators and have limited value for monitoring treatment response. The reversal of portal vein flow direction is specific, as it reflects severe portal hypertension; however, it rarely manifests as a sign during the early stages of VOD and tends to occur only after disease progression [19,25,26]. Similarly, the present study showed that the reversal of portal vein flow was not only observed in patients with severe VOD and therefore could not reflect VOD severity.
2D-SWE is a tool for measuring liver stiffness that is used to evaluate the degree of hepatic fibrosis in patients. In particular, it has been shown to have potential in pediatric patients [12,13]. Although previous 2D-SWE studies have focused on the diagnosis of fibrosis, other factors such as congestion, inflammation, central venous pressure, and cholestasis may also affect liver stiffness [27]. Previous studies have reported that VOD could occur due to inflammation, sinusoid narrowing, and increased clot formation in the early disease stages, leading to sinusoidal obstruction and congestion [9,10]. Therefore, elevated liver stiffness may result from an early inflammatory response and subsequent congestion, rather than late-stage fibrosis.
The normal liver stiffness measured using the LOGIQ E9 system, the ultrasound machine used in this study, was previously reported to be 4.3±0.6 kPa in children [28]. The findings of the present study suggest that VOD should be strongly suspected if post-HSCT liver stiffness values exceed 7.2 kPa. Although baseline liver stiffness was not measured in all patients before HSCT, the value of 7.2 kPa was clearly higher than baseline values. According to Colecchia et al. [29], when there is a sudden increase in liver stiffness before the appearance of VOD, early VOD treatment should be considered before the appearance of symptoms. Reddivalla et al. [11] also reported that an increase in liver stiffness on 2D-SWE before the clinical diagnosis of VOD was associated with the presence of VOD. However, these two studies did not provide a cutoff value for liver stiffness due to the small number of pediatric VOD patients. Conversely, this study included a large number of VOD patients, enabling the proposal of an optimal cutoff value of liver stiffness. Additionally, improvement during treatment can be monitored quantitatively by analyzing follow-up data after diagnosis.
Therefore, the advantage of providing a cutoff value may help in the decision to begin early treatment in VOD patients. However, the non-VOD group also showed a slight increase in liver stiffness values compared to a previous report on the normal range of liver stiffness [28]. Therefore, the value must be measured with the same machine both before and after HSCT to confirm the significance of any increases observed. The lack of baseline stiffness measurement before HSCT is the biggest drawback in this study due to its retrospective study design.
Previous reports found that when appropriate VOD treatment was administered, the stiffness values gradually decreased within 2 weeks [9,10]. The data in this study also showed a trend for decreasing liver stiffness values following VOD treatment, but no statistically significant changes were observed between the first, second, and third follow-ups (13.5±1.7, 11.3±1.4, and 9.5±0.8 kPa, respectively). Given the risks of VOD treatment drugs, a prospective study is needed to validate this finding and to determine an appropriate treatment endpoint.
There are some limitations to this study. First, because of the retrospective design, only patients who underwent 2D-SWE examination were included. Not all HSCT patients could be included in the study, and the number of regular follow-ups per patient was not consistent. VOD was found to be unexpectedly prevalent in high-risk patients, with an incidence rate of more than 56%. Therefore, selection bias may be an essential issue and it might be difficult to draw adequate conclusions with adequate external validity. However, this study included a large number of high-risk VOD patients and serial assessment data, compared with previous studies. Second, this study did not include baseline liver stiffness data before HSCT, and only 13 patients had baseline values available. Before HSCT, the first baseline ultrasound examination was performed on an outpatient basis, while follow-up ultrasound examinations were performed after HSCT in a hospitalized state. Therefore, it was impossible to consistently perform 2D-SWE with the same ultrasound machine due to the limited availability of the equipment, especially at the hospital’s outpatient clinic. However, this study aimed to identify early disease predictors to prevent patients from progressing to severe VOD after discharge from the sterile unit. For all VOD patients who showed elevated liver stiffness, the 2D-SWE values gradually decreased as the patients recovered from their clinical symptoms. Therefore, 2D-SWE can be used as a quantitative monitoring tool through repetitive examinations. Finally, the reference standard data for comparing quantitative liver stiffness were not based on histological data or absolute quantitative data, such as hepatic venous pressure gradients, but only on the clinical EBMT criteria. However, only clinical indicators are currently used in the evaluation of VOD severity and non-invasive procedures.
In conclusion, liver stiffness measured by 2D-SWE increases in pediatric patients who develop VOD after HSCT. This measurement can be used as a quantitative parameter for diagnosing VOD at the first follow-up ultrasound examination and monitoring treatment response during subsequent follow-ups. Therefore, liver stiffness can be utilized as a predictive and quantitative parameter for diagnosing VOD.

 Download Citation
 PDF Links
 PubReader
 ePub Link
 Full text via DOI


