Reliable measurements of physiologic ankle syndesmosis widening using dynamic 3D ultrasonography: a preliminary study
Article information

Abstract
Purpose
The purpose of this study was to present a technique for measuring physiologic distal tibiofibular syndesmosis widening using 3-dimensional ultrasonography (3D-US) with an evaluation of its reliability, and to determine whether there were differences in the measurements between different dynamic stress tests.
Methods
We retrospectively evaluated 3D-US of 20 subjects with normal ankle syndesmosis. 3D-US was performed in neutral (N), dorsiflexion with external rotation (DFER), and weight-bearing standing (WB) positions at the anterior inferior tibiofibular ligament level in both ankles for comparison. Using 3D-US volume data, axial images were reconstructed at the level of the lateral prominence of the anterior tibial tubercle to ensure consistent measurements of the tibiofibular clear space (TFCS) by two radiologists.
Results
There was a wide range of TFCS values among the subjects (N, 1.2 to 4.2 mm; DFER, 2.3 to 4.8 mm; WB, 1.7 to 4.6 mm). When both ankles of each subject were evaluated, the side-to-side differences were less than 1 mm in all positions, with high intraclass correlation coefficient (ICC) values between both ankles (ICC, 0.85 to 0.93). The inter-rater agreement for all TFCS measurements between the two radiologists was excellent (ICC, 0.81 to 0.96). In comparisons between the two dynamic stress tests, the TFCS was significantly wider in the DFER position than in the WB position (DFER vs. WB, 3.3 mm vs. 2.9 mm; P<0.001).
Conclusion
Using 3D-US, we were able to consistently evaluate the TFCS with good reliability. In a comparison of the two dynamic tests, there was more significant widening of the TFCS in the DFER position than in the WB position.
Introduction
The ankle syndesmotic ligament complex plays an important role in the stability of the ankle joint. Thus, rupture of the ankle syndesmosis, resulting in instability of the ankle mortise, appears as widening of the tibiofibular clear space (TFCS) (Fig. 1) [1-3]. Because the anterior inferior tibiofibular ligament (AITFL) is the first ligament to be injured in the ankle syndesmosis, if there is damage to the AITFL, the instability of the ankle syndesmosis should be investigated, as should any additional interosseous membrane injury, because it may lead to delayed healing, pain, and post-traumatic arthritis [1,3,4]. However, evaluation of the instability of the ankle syndesmosis is difficult. Various imaging modalities have been used to diagnose syndesmotic instability, but few have been shown to yield consistent results. This lack of consensus is because previous studies have used different definitions and landmarks, leading to difficulties in establishing consistent radiologic measures and to large inter-subject variation, partially because of the variable normal anatomy and morphology of the distal tibiofibular syndesmosis [3,5-7].
Anatomy of the anterior ankle syndesmosis and tibiofibular clear space (TFCS) in a 34-year-old man with a normal ankle syndesmosis.
A. Three-dimensional computed tomography volume-rendering image with an illustration of the ligaments shows the (1) anterior inferior tibiofibular ligament (AITFL); (2) interosseous membrane; (3) anterior talofibular ligament; (4) calcaneofibular ligament; and (5) lateral prominence of the anterior tibial tubercle (open arrow) and TFCS (blue line). B. Reformatted oblique coronal 3-dimensional ultrasonography shows the AITFL, demonstrating several low-echogenic bands within AITFL because of anisotropy (arrows), the lateral prominence of the anterior tibial tubercle (open arrow), and the TFCS (blue line).
Ultrasonography (US) has the advantages of relatively high resolution, easy accessibility, and no exposure to radiation. Most of all, dynamic tests with US may allow the functional stability of the ankle joint to be evaluated, but conventional US is limited by operator-dependency. Previous studies using US [2,8,9] reported that the TFCS of injured AITFL was widened more by forcing the foot with ankle dorsiflexion and external rotation stress. However, only that dynamic test was used in the abovementioned studies. Standing weight-bearing stress has been used more often as a dynamic test for other imaging modalities, such as computed tomography (CT) and radiography [10-12]. Moreover, large inter-subject variation and discrepancies in various measured values and parameters across studies have been reported, but intra-subject variation between ankles was small in evaluations of ankle syndesmosis instability [3,10,13]. A recent study has recommended side-to-side comparisons [3,10]. However, for side-to-side comparisons to be consistent, measurement levels need to be precise and at the same level [14]. It is difficult to keep these measurements constant using conventional 2-dimensional ultrasonography (2D-US) because of operator-dependency and limited references about the placement of the probe. Recently, high-resolution 3-dimensional ultrasonography (3D-US) has been developed. Using this technique, regional volume data on superficial structures with high resolution can be obtained, enabling the reconstruction of cross-sectional images in any direction and giving the possibility of accuracy as high as can be achieved in 3D-CT measurements [15,16].
In this study, we present techniques for measuring the normal distal tibiofibular syndesmosis based on 3D-US. Furthermore, we evaluated the reliability of these measurement techniques in side-to-side comparisons and determined whether there were differences in the measurements between different dynamic stress tests.
Materials and Methods
This retrospective study was approved by the Institutional Review Board of SMG-SNU Boramae Medical Center. Informed consent was waived because of the retrospective nature of this study.
Inclusion and Exclusion Criteria
Between January and September 2018, a total of 97 ankle US were performed at our institution for the evaluation of ankle sprain or pain. The medical records of these patients were analyzed, and 22 consecutive subjects met the following inclusion criteria for our study: being an adult over the age of 18; having been referred for ankle US to evaluate the integrity of the ankle ligament and the cause of ankle pain, regardless of the duration of symptoms; undergoing 3D-US with two dynamic tests at the AITFL level at both ankles for comparison; and not having any tenderness or evidence of injury at the AITFL on US. Two subjects were excluded because they could not stand on both legs due to pain and could not perform the weight-bearing test properly. Finally, 20 subjects (7 males, 13 females; mean age, 44 years; age range, 21 to 76 years) were included in our study. All subjects underwent standardized US for both ankles for comparative purposes.
Ultrasonography
All US were performed using a Toshiba (Aplio 500, now manufactured by Canon Medical Systems, Otawara, Japan) platform equipped with a linear transducer (7-14 MHz, PLT-1204BT, Canon Medical Systems) for routine 2D-US, and a volume transducer (7-14 MHz, PLT-1204MV, Canon Medical Systems) for 3D-US by one experienced radiologist, with 9 years of experience in musculoskeletal radiology. The radiologist initially scanned the ankle with B-mode US with a linear transducer using the standard protocol at our institution to evaluate the ligament, tendon, and other soft-tissue structures. In order to evaluate the integrity of the AITFL, the anterior aspect of the transducer was rotated cranially and obliquely until the distal fibula and AITFL were visible. Then, 3D-US was performed with a volume transducer in the neutral (N) position and in two dynamic stress positions, dorsiflexion with external rotation (DFER) and the weight-bearing standing (WB) position, at the AITFL level in both ankles. To evaluate the TFCS in the N position, the subjects were examined in the sitting position on the examination table with the knee in 90º flexion and the plantar aspect of the foot in full contact with the table (Fig. 2A). For the DFER position, the subject was asked to gently press his or her heel toward the bed to stabilize the ankle for the examination, while performing the stress maneuver by forcing the foot to achieve ankle external rotation with dorsiflexion (Fig. 2B). For the weight-bearing position, the subject was asked to stand on a set of stairs to place his or her weight on both feet (Fig. 2C).
Ankle positioning and posture in a 32-year-old man who was a normal volunteer.
Three-dimensional ultrasonography was performed in three positions: neutral position (A); dorsiflexion with external rotation (DFER) (B); and weight-bearing standing position (WB) (C).
3D-US Protocol
The 3D-US settings were standardized using the following parameters: frequency, 14 MHz; gain, 76% to 84%; dynamic range, 40 to 50 dB; depth, approximately 30 mm; 3D scanning angle, 30°; and sweeping length, 5 cm. Before we began this study, the reproducibility of the technique was examined by two musculoskeletal radiologists in consensus. The volume transducer was placed transversely over the lateral aspect of the foot, approximately 1 cm proximal to the ankle joint. The longitudinal scanning was oriented along the longitudinal axis of the tibia and fibula, and the center of the probe was adjusted at the position of the lateral prominence of the anterior tibial tubercle (Figs. 1, 3). While keeping the transducer stationary, we pressed the 3D button to obtain 3D volume data; this scan was completed within approximately 4 seconds. The whole time taken for 3D examination was less than 15 seconds at each position.
Volume data processing and tibiofibular clear space (TFCS) measurement in a 34-year-old man with a normal ankle syndesmosis.
A. Three-plane 2-dimensional multiplanar reformatted images (axial, sagittal, and coronal planes), and a volumerendering image (bottom right) that was automatically generated from 3-dimensional ultrasonography volume data are shown. Green cross labels indicate the location of other multi-planar images. B. Adjustment of the Z-axis of the axial image is performed, according to the longitudinal axis of the tibia and fibula on the reformatted images of the coronal and sagittal planes. The corrected axial image is scrolled up and down to identify the position of the lateral prominence of the anterior tibial tubercle (open arrows). C. The TFCS measurement is performed by drawing a line (blue line) from the lateral prominence of the anterior tibial tubercle (open arrows) to the most proximal part of the fibula.
Volume data processing and measurement
The volume data processing and measurement of the TFCS were independently performed later by two radiologists (with 9 and 8 years of experience, respectively). In the US device, the 3D volume data was further processed to produce 3-plane 2D multiplanar reformatted images (axial, sagittal, and coronal planes) and a volume-rendering image (Fig. 3A). To make measurements consistently at the same location, we adjusted the Z-axis of the axial image to match the longitudinal axis of the tibia and fibula on the reformatted images of the coronal and sagittal planes. This axial image was then scrolled up and down along the corrected Z-axis to identify the position of the lateral prominence of the anterior tibial tubercle (Fig. 3B) to enable consistent measurements of the TFCS. The TFCS was measured in the resulting axial image (Fig. 3C) using the same method that was previously reported for CT [10,14,17]. The first reference point was chosen on the lateral prominence of the anterior tibial tubercle. A line was then drawn to the most proximal part of the fibula from the anterior tibial tubercle (Fig. 3C). The TFCS was measured in the N, DFER, and WB positions in both ankles for comparison. Each measurement was repeated and averaged if a difference was documented. Clear space widening was calculated by subtracting the value of the neutral position from the values of the two dynamic stress positions. If the US beam was not able to penetrate because of calcifications or spurs, shadowing may have limited the measurement. In that case, we estimated the invisible part through other image planes. These data were used to assess inter-rater agreement, and the measurements made by one of the two radiologists (with 9 years of experience in musculoskeletal radiology) were used for other data analysis.
Statistical Analysis
The TFCS in the N and dynamic stress positions and the clear space widening were compared using the Wilcoxon signed-rank test, which was also used to evaluate the difference in TFCS between the ankles in side-to-side comparisons.
The interclass correlation coefficient (ICC) was calculated in order to assess the extent of agreement between the 2 radiologists to measure inter-rater agreement. The ICCs were also used to assess the inter-subject variation of the TFCS in both ankles. ICC values were interpreted as follows: 0, poor agreement; 0.01-0.20, slight agreement; 0.21-0.40, fair agreement; 0.41-0.60, moderate agreement; 0.61-0.80, good agreement; and 0.81-1.00, excellent agreement.
All statistical tests used 2-sided P-values, and the selected level of significance for all variables was alpha=0.05. All statistical analyses were performed using SPSS version 20 (IBM Corp., Armonk, NY, USA).
Results
TFCS Measurements at Each Position
All TFCS measurements are shown in Table 1 and Fig. 4. Because there was a wide range of TFCS values for the different subjects, large inter-subject variation was seen in all measurements. Sex and age showed no associations with any of the measurements (P>0.05, data not shown).
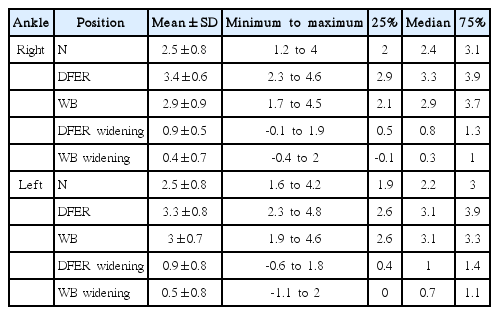
Tibiofibular clear space measurements
Measured values of the tibiofibular clear space (TFCS) in each position.
There were significant differences in the TFCS in each position. The TFCS in the dorsiflexion-external rotation (DFER) position was significantly larger than the TFCS in the weight-bearing (WB) position. The significance of the difference between positions was tested using the Wilcoxon signed-rank test, *P<0.05. R, right; L, left.
Side-to-Side Comparison
When both ankles of a subject were evaluated, the side-to-side differences were less than 1 mm in all positions and were not significantly different in the N, DFER, and WB positions (Fig. 5). The TFCS of both ankles was quite similar in each subject, and the ICC values were quite high (N, 0.85 [0.62-0.94]; DFER, 0.93 [0.81-0.97]; WB, 0.86 [0.65-0.95]), which means that there was small intra-subject variation in the TFCS.
Side-to-side variation (between right and left).
When both ankles of a subject were evaluated, the side-to-side differences were less than 1 mm in all positions and were not significantly different in the neutral (N), dorsiflexion-external rotation (DFER), and weight-bearing (WB) positions. TFCS, tibiofibular clear space; R-L, right-left.
Inter-rater Agreement
The ICC values for the TFCS at the neutral, DFER, and WB positions are summarized in Table 2. The inter-rater agreement of all TFCS measurements between the two radiologists were excellent.

Inter-rater agreement between two radiologists
Comparison of Two Dynamic Stress Tests
In the comparison between the two stress tests, there was more significant widening of TFCS in the DFER position than in the WB position (P<0.001). Furthermore, the ICC values were greater in the DFER position than in the WB position (DFER vs. WB, 0.93 vs. 0.86) (Fig. 6).

Scatter plots of the tibiofibular clear space (TFCS) for the evaluation of inter-subject variation.
The TFCS was quite similar in both ankles in each subject, and the interclass correlation coefficient (ICC) values were quite high (dorsiflexion-external rotation [DFER], 0.93 [0.81 to 0.97]; weight-bearing [WB], 0.86 [0.65 to 0.95]), which means that the intra-subject variation of the TFCS was small. The ICC values were greater in the DFER position than in the WB position. R, right; L, left.
Discussion
To our knowledge, this article is the first 3D-US study on the evaluation of the TFCS using a bony landmark of the lateral prominence of the anterior tibial tubercle. With this method, TFCS measurements showed high inter-rater agreement and high reliability in the side-to-side comparison. This is also the first study to use the WB for dynamic US to evaluate ankle syndesmotic instability, although this position is commonly used as a dynamic stress test for CT and radiography. However, the WB dynamic stress test was not superior to the previously used DFER stress test.
Several previous studies have sought to report measurements of a normal syndesmosis to assess syndesmotic instability [18-21]. However, these studies showed large inter-subject variations in the TFCS measurements due to very wide variation in the normal anatomy of the distal tibiofibular syndesmosis. Recent studies have shown that the intra-subject variation between the two ankles in normal subjects (side-to-side comparison) was less than 1 mm [10,13]. Based on these results, recent studies have recommended a side-to-side comparison rather than using "normal" values based on a mean obtained from a cohort [3,10,20]. Our study also showed the same results, in that the differences in the TFCS between subjects were large, but the side-to-side differences within subjects were less than 1 mm. When using the contralateral ankle for comparison of the TFCS, it is important to evaluate the TFCS at the same plane on both ankles. In previous CT or US studies, the common measuring plane of the TFCS was defined as being 1 cm proximal to the tibial plafond [2,8-10]. However, because of the existence of inter-subject variability, this uniform measurement plane lacked a scientific basis. Chen et al. [14] measured the TFCS using 3D-CT with the lateral prominence of the anterior tibial tubercle as a landmark, and showed good intra- and inter-rater agreement for measurements. They also reported that the locations of these measuring points differed by sex, with values of 12.1 mm proximal to the tibial plafond in males and 7.8 mm in females. Although they did not evaluate this method in a side-to-side comparison, we assumed that this method could help to locate the measuring plane accurately in a side-to-side comparison. Using the landmark of the lateral prominence of the anterior tibial tubercle (Fig. 1), we were able to compare each TFCS on both ankles consistently using multiplane reconstructed images from 3D-US volume data with high inter-rater agreement.
Not only were the planes of TFCS measurement different in previous studies, but even on the same plane, different measurement methods and terms were used across studies or depending on the imaging modality. These issues were well documented in the recent systematic review by Anand Prakash [3]. For example, the TFCS measured by US was differently expressed as anterior width [10] or anterior TFCS [14] in other articles investigating CT imaging, and the methods of measurement were slightly different.
Mei-Dan et al. [8] first reported dynamic US for the diagnosis of ankle syndesmotic injuries in a study of nine professional athletes with an AITFL injury, using dorsiflexion and external rotation as a stress. They found greater widening of the TFCS in the injured AITFL, and they suggested a 0.9 mm cutoff value for side-to-side differences in the TFCS and a 0.4 mm cutoff value for clear space widening. Later, the same author [2] reported normal TFCS values of 3.78 mm for the syndesmosis clear space on US. Van Niekerk and Van Dyk [9] also reported that dynamic US could detect AITFL injuries with clarity equal to that of magnetic resonance imaging (MRI). All those studies stated that the TFCS was measured at the deeper portion of the ligament in the anterior region approximately 1 cm above the ankle joint, using conventional 2D-US. In our study, we initially tried to measure the TFCS with a linear probe, as in previous studies. However, since it was too difficult to measure the distance of the moving position of the probe while performing US, it was challenging to set the linear probe 1 cm vertically above the ankle joint. Even when the marker under the probe was used during probe placement, because the 2D linear probe was moved along the skin surface, the position of the measurement was different for each position of the ankle and for each subject. Moreover, the TFCS was differently measured depending on the angle of the linear probe, since there was no accurate reference for the angle of the linear probe in 2D-US. Therefore, even if a similar location was found, the measured value was not consistent, and showed large differences depending on the degree of tilting of the probe. In addition, both previous authors [2,9] stated that the TFCS was measured in the deep portion of the ligament, but visualization of the deep portion of the ligament was not easy because of the anisotropy of the AITFL, and this landmark would be difficult to use in subjects with ligament tears. Moreover, in several figures in their articles, the TFCS was measured at the superficial level of the AITFL. They also did not describe the details of how the angle of the probe was located (in other words, how the angle of the plane to measure was chosen). However, as shown in the figures of their paper, Mei-Dan et al. [2] made measurements at an angle perpendicular to the long axis of the lower leg, and Van Niekerk and Van Dyk [9] made measurements at an oblique plane along the AITFL travel direction. Because the TFCS distance in the plane along the ligament is longer, the TFCS in Van Niekerk and Van Dyk [9] was considered to be higher. To overcome these problems of conventional 2D-US measurements, we measured the TFCS at the position of the lateral prominence of the anterior tibial tubercle on corrected axial images using 3D-US. As this shows, 3D-US has many advantages. Multiplanar images can be reconstructed at any time with volume data, as in 3D-CT. In addition, there were no concerns about radiation and no need for a separate 3D reconstruction program, in contrast to CT [14].
We assumed that the WB stress position, which was not used in previous US studies [2,8,9], would be more physiological stress and that the stress would be greater and more constant, leading to further TFCS widening and less differences in the measurements. However, we observed that the TFCS in the WB position was smaller than that in the DFER position. Based on a previous study reporting that the distal tibiofibular joint was more widened during dorsiflexion because the anterior portion of the talar dome was 3 to 4 mm wider than the posterior portion [12], dorsiflexion rather than standing itself is thought to have been a more important factor in widening the TFCS. In addition, there is a disadvantage in that it is not easy for subjects with ankle pain to perform the WB position, and it is limited to patients who can stand. Therefore, the DFER test could be more convenient and suitable for evaluating ankle syndesmotic instability.
Our study has several limitations. First, it was a preliminary study that only included a few subjects who underwent US. However, 20 subjects were not too small a number to draw statistical conclusions comparable to those of previous studies. Based on these data and results, we are planning a prospective study in which enough subjects will be recruited to overcome this limitation. Second, it is necessary to determine whether using 3D-US can reduce inter- or intra-rater variation more than is possible using conventional 2D image measurements. This is a limitation of our retrospective study design. We also plan to evaluate this issue in future prospective studies. Third, the integrity of the AITFL was not confirmed using other imaging modalities, such as MRI or surgical observation. However, our subjects did not have a history of pain or trauma at the ankle syndesmosis. Moreover, we evaluated the integrity of the AITFL with high-resolution US, and the accuracy of US was reported to be very high in previous studies in comparison to surgical findings [9]. Fourth, reconstruction with 3D-US volume data to measure the TFCS required more time than did conventional 2D-US measurements, but this technique makes it possible to reconstruct the image in any plane desired at any time.
Conventional 2D-US measurement of the TFCS has limitations, because it is difficult to maintain a consistent measurement point for comparisons. In contrast, 3D-US can compensate for this disadvantage. In conclusion, using 3D-US, we were able to consistently evaluate the TFCS with good reliability. In a comparison of 2 dynamic tests, more significant widening of the TFCS was observed in the DFER position than in the WB position.
Notes
Authors’ contributions
Conceptualization: Cha SW, Kim DH, Chai JW, Bae KJ, Park J. Data acquisition: Cha SW, Kim DH, Bae KJ. Data analysis or interpretation: Cha SW, Kim DH, Park J. Drafting of the manuscript: Kim DH, Cha SW, Choi YH. Critical revision of the manuscript: Kim DH, Chai JW, Choi YH. Approval of the final version of the manuscript: all authors.
Conflict of interest
No potential conflict of interest relevant to this article was reported.
Acknowledgements
The authors wish to acknowledge Sohee Oh, PhD, Department of Biostatistics, SMG-Boramae Medical Center, for her statistical support.
This study was supported by a grant from the SMG-SNU Boramae Medical Center Research Fund (03-2018-22).