Correlations between ultrasonographic and subsequent radiographic findings of developmental dysplasia of the hips
Article information

Abstract
Purpose
The study aimed to investigate the utility of ultrasonographic (US) findings in predicting the subsequent radiographic parameters of developmental dysplasia of the hips.
Methods
In this 12-year retrospective cohort study, all new-born infants with a positive clinical examination or risk factors were included. They were scheduled for hip ultrasonography in the first 3 months, and subsequent radiographs at 1 year of life. The US images were evaluated using the Graf classification, Harcke’s dynamic screening method, and Terjesen’s femoral head coverage method. The radiographic images were evaluated using the acetabular index and femoral head position. The overall US or radiographic findings were considered abnormal if they were classified as abnormal for any of their respective parameters. The overall US and radiographic parameters were correlated.
Results
A total of 160 patients were included. The overall US and radiographic parameters showed no statistically significant difference (P=0.050). The sensitivity, specificity, and accuracy of the overall US parameters were 57.1%, 84.9%, and 81.3%, respectively. All three individual US parameters showed no statistically significant differences, with the overall radiographic findings and acetabular index (P>0.05). However, they showed a statistically significant difference, with the position of the femoral head (P<0.001), with the US parameters having an excellent negative predictive value of 100% for identifying an abnormal femoral head position.
Conclusion
The current study suggests that US findings evaluated in the first 3 months of life showed no statistically significant difference with radiographic findings evaluated at 1 year of life. The US parameters showed an excellent negative predictive value for abnormal femoral head position on radiographs.
Introduction
Developmental dysplasia of the hip (DDH) is a common paediatric orthopaedic condition. However, despite recent advances in the understanding of DDH, the precise definition of DDH itself is controversial [1]. It represents a broad spectrum of conditions affecting the proximal femur and acetabulum, in which the femoral head and the acetabulum are not aligned and do not grow proportionately [2-6].
Historically, this condition was more commonly referred to as congenital dislocation of the hip, till clinical screening for neonatal hip abnormalities revealed that the disorder was not always congenital, but developmental in nature, with pathologies that could develop as the child grows [5,7,8]. The term "dysplasia" was also found to be more appropriate than "dislocation," as it covers a spectrum of disorders ranging from fixed congenital dislocation of the hip to occult late acetabular dysplasia [4,5,9].
Owing to the developmental and wide-ranging nature of this condition, multiple imaging modalities have been utilised to screen for and to diagnose DDH across the various phases of a child’s life. However, there exist varying opinions in the current literature regarding the correlation between ultrasonographic (US) and subsequent radiographic findings for patients with DDH, with some studies concluding that there was no significant positive correlation between the two [10-18].
The current study therefore aimed to compare the initial US findings and the subsequent radiographic findings, and to investigate whether any of the US parameters were useful in predicting the subsequent radiographic features of DDH.
Materials and Methods
This study was performed in accordance with the ethical standards established by the institution’s research committee. A waiver of consent was obtained.
In this 12-year retrospective cohort study, all new-born infants born at a single institution from January 1, 1999 to December 31, 2011 with either a positive clinical examination or the presence of risk factors were included. A positive clinical examination was defined as either a positive Barlow’s test, a positive Ortolani’s test, or the presence of clicking hips [19]. The risk factors included female sex, post-term birth, high birth weight, high birth length, macrocephaly, breech presentation, twins, firstborn, oligohydramnios, torticollis, congenital talipes equinovarus, or a positive family history [19]. The risk factors were assessed by a neonatologist and confirmed by a paediatric orthopaedic surgeon. The patients were then scheduled for bilateral hip ultrasonography in the first 3 months of life, and subsequent radiographs at 1 year of life as per the standard institutional protocol for evaluating neonates with suspected DDH.
Patients with other concomitant hip abnormalities were excluded. These included patients who had co-morbidities that might predispose them to developing neurogenic hip dysplasia, such as cerebral palsy, as well as patients who had co-morbidities that might predispose them to developing syndromic hip dysplasia, such as Down syndrome. Patients who received treatment prior to the radiographs performed at 1 year of life were also excluded to minimise the confounding factor of treatment effect.
A fellowship-trained paediatric musculoskeletal radiologist blinded to the study’s purpose reviewed the US and radiographic images. The radiologist was also blinded to the US findings when evaluating the radiographic images.
The US images were evaluated according to the Graf classification, Harcke’s method of dynamic ultrasound screening, and Terjesen’s method of evaluation for femoral head coverage [20]. The overall US findings were considered abnormal if they were classified as abnormal for any of the three parameters. Regarding the Graf classification, the alpha and beta angles, which were quantitative indicators of the bony and cartilaginous acetabular roofs, were evaluated [21]. Hips with an alpha angle more than 60° and a beta angle less than 55° were considered to be Graf type 1 hips, and were therefore considered to be normal [21]. In contrast, hips with an alpha angle less than 50° or a beta angle more than 77° were classified as Graf type 2C and beyond, and were therefore considered to be abnormal (Fig. 1) [21]. Patients with Graf type 2A hips, which have alpha angles between 50° and 60° and beta angles between 55° and 77°, were considered to have immature hips, and the eventual classification of whether the hips were considered normal or abnormal with DDH were dependent on the two other parameters reviewed [21]. In Harcke’s method of dynamic ultrasound screening, coronal and transverse images were obtained both at rest and in stress [22]. The hips were then classified as normal, subluxated, or dislocated according to the views [22]. Hips that were classified as subluxated or dislocated were considered abnormal (Fig. 2) [22]. In Terjesen’s method of evaluation for femoral head coverage, the femoral head coverage was calculated as the percentage of the cartilaginous femoral head covered by the acetabular bony roof [23]. A femoral head coverage of 50% or more was considered normal, while a femoral head coverage of less than 50% was considered abnormal (Fig. 3) [23].
Measurement of the alpha and beta angles as quantitative indicators of the bony and cartilaginous acetabular roofs on ultrasonography.
A. A normal hip was defined as having an alpha angle more than 60° and a beta angle less than 55°. B. An abnormal hip was defined as having an alpha angle less than 50° or a beta angle more than 77°.
Harcke’s dynamic ultrasound screening obtained both at rest and in stress.
A, B. Compared with a normal hip (A), the hip joint subluxation is well illustrated (B).
Terjesen’s method of evaluation for femoral head coverage, in which femoral head coverage is calculated as the percentage of the cartilaginous femoral head covered by the acetabular bony roof.
A, B. Compared with ultrasonography of a normal hip, which is defined as having femoral coverage of 50% or more (A), an abnormal hip is defined as having femoral coverage of 50% or less (B).
The radiographic images were evaluated according to the acetabular index and the position of the femoral head. The overall radiographic findings were considered abnormal if they were classified as abnormal for any of the parameters. The acetabular index was measured as the angle formed by the horizontal line connecting the bilateral triradiate cartilages and the line along the acetabular roof. An acetabular index of more than 28° at 1 year of life was considered dysplastic according to the study conducted by Tonnis [24]. Acetabular indices of less than or equal to 28° were therefore considered normal, while acetabular indices of more than 28° were considered abnormal (Fig. 4) [24]. To characterize the position of the femoral head, the Hilgenreiner, Perkin, and Shenton lines were used. The Hilgenreiner line is a horizontal line connecting the bilateral triradiate cartilages. The Perkin line runs perpendicular to the Hilgenreiner line intersecting the lateral-most aspect of the acetabular roof. The Shenton line is drawn along the inferior border of the superior pubic ramus and along the inferomedial border of the neck of the femur. The position of the femoral head was considered normal if it was inferomedial to the Hilgenreiner and Perkin lines and the Shenton line was in continuity. In contrast, the position of the femoral head was considered abnormal if it was not inferomedial to the Hilgenreiner and Perkin lines or the Shenton line was not in continuity (Fig. 5).
Measurement of the acetabular index on radiographs as the angle formed by the horizontal line connecting the bilateral triradiate cartilages and the line along the acetabular roof.
A. A normal hip is defined as having an acetabular index of less than or equal to 28° at 1 year of life. B. An abnormal hip is defined as an acetabular index of more than 28° at 1 year of life.

Radiographic evaluation of the femoral head position according to the Hilgenreiner, Perkin, and Shenton lines.
The Hilgenreiner line is a horizontal line connecting the bilateral triradiate cartilages. A. A normal hip is defined as the femoral head being inferomedial to the Hilgenreiner and Perkin lines (horizontal and perpendicular lines, respectively), with a continuous Shenton line (arc). B. An abnormal hip is defined as the femoral head not being inferomedial to the Hilgenreiner and Perkin lines, with a Shenton line that is not continuous.
SPSS version 22.0 (IBM Corp., Armonk, NY, USA) was used for statistical analysis. Each of the US parameters was then correlated with each of the radiographic parameters. The overall US and radiographic findings were also correlated with each of the parameters. The McNemar exact test was performed to analyse the correlations between the various variables. A P-value of <0.05 was considered to indicate statistical significance. The sensitivity, specificity, positive predictive value (PPV), negative predictive value (NPV), and accuracy of the US parameters were also calculated and reported together with their 95% confidence intervals (CIs).
Results
A total of 160 patients were included in the study. In totality, 211 new-borns were enrolled in the institutional screening protocol for evaluating neonates with suspected DDH. However, 30 patients were excluded due to the presence of co-morbidities that might predispose them to neurogenic or syndromic hip dysplasia. Another 21 patients were excluded from the study to minimise the confounding factor of treatment effect, as treatment was provided prior to the radiographs performed at 1 year of life.
Amongst the patients included, 33 (20.6%) had abnormalities in one or more of the US parameters evaluated within the first 3 months of life, while 21 (13.1%) had abnormalities in one or more of the radiographic parameters evaluated at 1 year of life. The number of patients who had normal or abnormal results for each of the US or radiographic parameters is presented in Tables 1-3.

Correlations, sensitivity, specificity, PPV, NPV, and accuracy of ultrasonographic findings when compared to the overall radiographic findings at 1 year of life
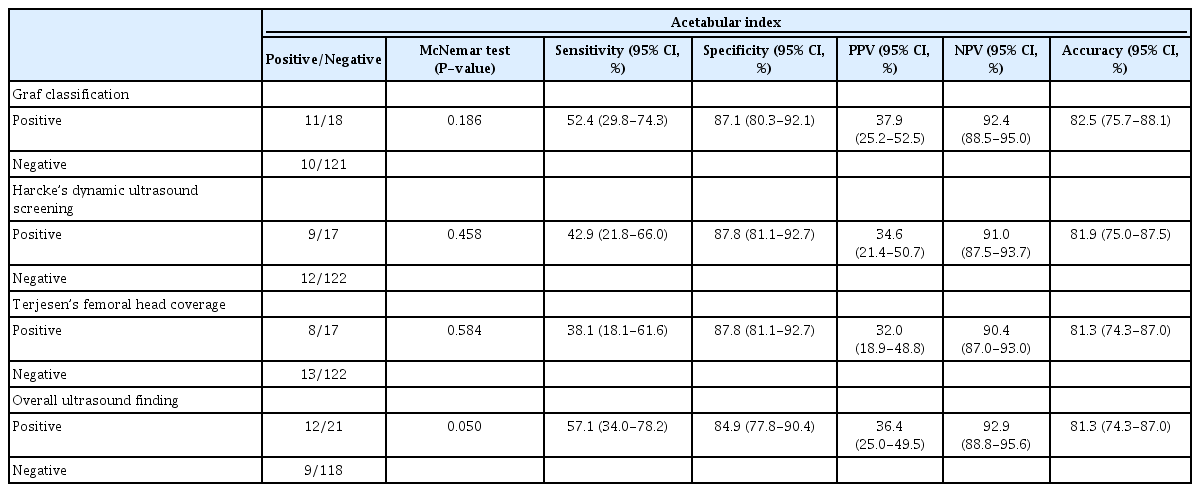
Correlations, sensitivity, specificity, PPV, NPV, and accuracy of ultrasonographic findings when compared to the acetabular index at 1 year of life
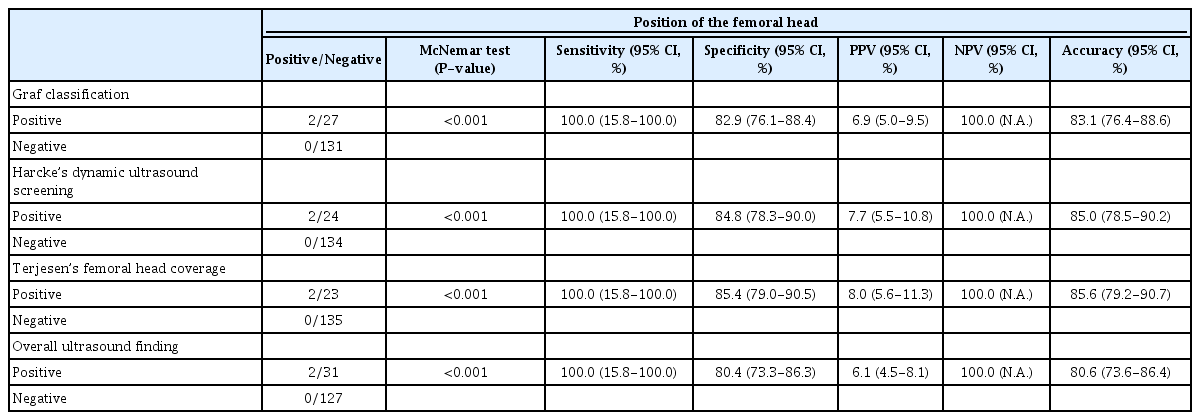
Correlations, sensitivity, specificity, PPV, NPV, and accuracy of ultrasonographic findings when compared to the position of the femoral head at 1 year of life
The overall US parameters measured within the first 3 months of life showed no statistically significant difference compared to the overall radiographic parameters performed at 1 year of life (P=0.050) (Table 1). The presence of one or more abnormalities on ultrasound examinations in the first 3 months of life had a sensitivity of 57.1% (95% CI, 34.0% to 78.2%), specificity of 84.9% (95% CI, 77.8% to 90.4%), PPV of 36.4% (95% CI, 25.0% to 50.0%), NPV of 92.9% (95% CI, 88.8% to 95.6%), and accuracy of 81.3% (95% CI, 74.3% to 87.0%) for identifying one or more abnormalities on the radiographic examination at 1 year of life (Table 1).
All the US parameters evaluated within the first 3 months of life showed no statistically significant differences, with the overall radiographic findings at 1 year of life (Table 1). These included the Graf classification (P=0.186), Harcke’s dynamic ultrasound screening (P=0.458) and Terjesen’s femoral head coverage (P=0.584) (Table 1). The specific sensitivity, specificity, PPV, NPV, and accuracy of each of the US parameters are detailed in Table 1.
Similarly, the individual US parameters also showed close correlations, with no statistically significant differences, when compared to the acetabular index at 1 year of life (Table 2). These included the Graf classification (P=0.186), Harcke’s dynamic ultrasound screening (P=0.458), Terjesen’s femoral head coverage (P=0.584), and the overall US findings (P=0.050) (Table 2).
However, these US parameters showed statistically significant differences, with the position of the femoral head on radiographs performed at 1 year of life (P<0.001) (Table 3). Nonetheless, the US parameters all had an excellent NPV for an abnormal femoral head position (100.0%), as none of the patients with a normal Graf classification, Harcke’s dynamic ultrasound screening, Terjesen’s femoral head coverage, or overall US findings had an abnormal femoral head position at 1 year of life (Table 3).
Discussion
The current study highlighted a number of principal findings regarding the correlations between US parameters evaluated in the first 3 months of life and radiographic parameters evaluated at 1 year of life for DDH. Firstly, a close correlation was found between the overall US findings evaluated in the first 3 months of life and radiographic findings evaluated at 1 year of life. Secondly, the absence of any abnormal findings on ultrasonography within the first 3 months of life had an excellent NPV for dislocated hips, as represented by an abnormal femoral head position on a radiograph at 1 year of life. In fact, none of the patients who had normal US findings in the first 3 months of life had a dislocated hip at 1 year of life. Thirdly, the US findings in the first 3 months of life had a close correlation with the presence of dysplasia as evaluated by the acetabular index at 1 year of life. Fourthly, despite this correlation, there still existed cases of hip dysplasia noted on radiographs at 1 year of life that were not detected in earlier US evaluations.
Indeed, the cornerstone of successful management of DDH lies in early recognition and treatment [8,9]. Therefore, since its availability, ultrasonography has been widely employed in various countries as part of the screening strategy for infants determined to be at risk for DDH [25-27]. However, the use of ultrasonography in the diagnosis of DDH has its pitfalls. Studies have suggested high rates of false positives, and that a significant proportion of cases of "ultrasound-positive DDH" may spontaneously resolve without treatment [25,27,28]. Additionally, missed or late presentations of DDH were still prevalent despite US screening [10,17]. The current literature, therefore, contains varying opinions on the correlation between US and subsequent radiographic findings for patients with DDH, with some studies concluding that there was no significant positive correlation between the two [10-18]. The current study therefore aimed to evaluate and compare US findings evaluated in the first 3 months of life with radiographic findings evaluated at 1 year of life, and to examine whether there were any significant correlations between the various parameters used.
Through this study, a close correlation was identified between the overall US findings evaluated in the first 3 months of life and the radiographic findings evaluated at 1 year of life. All the individual US parameters evaluated in the first 3 months of life also showed close correlations with the overall radiographic parameters evaluated at 1 year of life. This finding is similar to those of many other studies, which also identified a close correlation between US and radiographic findings [10-14,17].
Indeed, it is noteworthy that none of the patients who had entirely normal US findings in the first 3 months of life (as defined by the Graf classification, Harcke’s dynamic ultrasound screening, and Terjesen’s femoral head coverage) had a dislocated hip on radiographs at 1 year of life. In fact, all the above parameters were also individually predictive of the absence of a dislocated hip on radiographs at 1 year of life.
However, despite the close correlation, some cases of hip dysplasia noted on radiographs at 1 year of life were not detected in the earlier US evaluation. Indeed, while the US parameters had a 100.0% NPV in predicting the presence of a dislocated hip as evaluated by the position of the femoral head, the NPV in predicting the presence of acetabular dysplasia as evaluated by the acetabular index was only 90.4%-92.9% (Table 2). This finding then supports those of other studies arguing that patients with suspected DDH should be followed-up until at least 1 year of life, even in the presence of normal ultrasound findings, due to the possibility of missed residual acetabular dysplasia [15,18].
This study therefore bridges a gap in the current literature by presenting a possible explanation for why some publications reported significant correlations between US findings and radiographic findings, while others reported no significant correlations. A possible reason for this controversy is the method of analysis. Some papers evaluated the NPV of US findings, and therefore determined that some cases of dysplasia were not detected by ultrasound examinations, while others evaluated the statistical correlations between the parameters [10-15,17,18]. Through the current study, it can therefore be concluded that there is indeed a close correlation between the US findings and the radiographic findings, but the NPV is not perfect.
The second possible reason for this discrepancy could be related to the eventual outcome measure. Indeed, while the US findings correlated well with the presence or absence of dysplasia at 1 year of life, they correlated poorly with the presence or absence of hip dislocation at 1 year of life. In contrast, while the US parameters had an excellent NPV for hip dislocation at 1 year of life, the NPV for acetabular dysplasia at 1 year of life was not perfect. Therefore, differences in the outcome measures, and whether studies compared the US parameters to the presence or absence of acetabular dysplasia versus hip dislocation could also possibly explain the different findings in the existing literature [10-18].
The third possible reason that could possibly explain the controversy in the existing literature is related to the choice of US parameters used in the initial evaluation. Some studies in the existing literature have concluded that the Graf classification is not as reliable as Harcke’s dynamic ultrasound screening or Terjesen’s femoral head coverage for predicting the subsequent radiographic findings [12,29]. However, in the current study, we have noted that all three US parameters were predictive of radiographic findings at 1 year of life. Nonetheless, an important caveat is that in our study, Graf 2A hips were classified as normal or abnormal based on the other two parameters. Initial analyses when the Graf 2A hips were all considered as normal immature hips, or all considered as abnormal hips, showed a similar lack of correlation with the subsequent radiographic findings. This therefore suggest that Harcke’s dynamic ultrasound screening and Terjesen’s femoral head coverage act as good adjuncts when evaluating US findings based on the Graf classification [12,29]. When used appropriately, with the above adjuncts, the Graf classification showed a similarly close correlation with subsequent radiographic findings at 1 year of life.
This study, however, faces several limitations. Firstly, as a cohort study, the population sample selected for the study was limited to patients who had positive clinical findings or risk factors for DDH within the institution. Nonetheless, the risk of selection bias in the current study is low, as the study population was also the population of interest for the purposes of the study. Secondly, the study only focused on the predictive values of risk factors for DDH, and not the predictive values of the various clinical examination manoeuvres. The predictive values of the various clinical examination manoeuvres could also be incorporated in future studies as factors that could predict the presence of hip dysplasia or dislocation at 1 year of life. Thirdly, the study excluded patients who received treatment prior to the radiographs performed at 1 year of life, minimising the confounding factor of treatment effect. However, this could pose a risk of potential selection bias. Nonetheless, the patients who received treatment were often those with severe hip dysplasia with obvious US abnormalities. The focus of the current study was to analyse whether US findings evaluated in the first 3 months of life could help confidently pick up abnormalities on radiographs at 1 year of age. These patients are therefore not the main focus of the study; they would usually receive early treatment and close follow-up, and therefore, would not fall through the gaps of the screening system. A larger population cohort study in the future would be also be beneficial to validate the findings of the current study.
In conclusion, the current study suggests that US findings evaluated in the first 3 months of life show close correlations with radiographic findings evaluated at 1 year of life. They can be confidently used to rule out hip dislocation at 1 year of life. However, even with normal US findings, there could still be a possibility of hip dysplasia at 1 year of life.
Notes
Author Contributions
Conceptualization: Tan SHS, Hui JH. Data acquisition: Tan SHS, Wu CH, Wong KL. Data analysis or interpretation: Tan SHS. Drafting of the manuscript: Tan SHS, Wu CH, Wong KL, Hui JH. Approval of the final version of the manuscript: all authors.
Notes
No potential conflict of interest relevant to this article was reported.