General principles and overview of vascular contrast-enhanced ultrasonography
Article information

Abstract
Ultrasonography (US) is the first-line modality for the evaluation of vascular pathology. Although well-established for many diseases, US has inherent limitations that can occasionally hinder an accurate diagnosis. The value of US was improved by the introduction of microbubbles as ultrasonographic contrast agents (UCAs) and the emergence of contrast-enhanced ultrasonography (CEUS), following the introduction of second-generation UCAs and the emergence of modern contrast-specific techniques. CEUS offers valuable information about vascular disease, both on a macrovascular and a microvascular level, with well-established applications for carotid disease, post-interventional follow-up of abdominal aortic aneurysms, and the assessment of portal vein thrombosis. The purpose of this review is to discuss the principles of CEUS and to present an overview of its vascular applications.
Introduction
Ultrasonography (US) is at the forefront of imaging of vascular disease, as it is a ubiquitous, cost-effective, well-tolerated and safe modality. An essential feature of US is its multifaceted nature, as it can provide anatomic information with B-mode and physiologic information with color Doppler, power Doppler and pulsed-wave Doppler techniques, making it indispensable for the assessment of vascular pathology. The multi-parametric nature of US was further advanced by the introduction of new technologies including elastography and contrast-enhanced ultrasound (CEUS), which are encompassed by the term multi-parametric ultrasound [1,2]. From the report of intravascular "bubble clouds" after the intra-aortic catheter injection of saline by Gramiak and Shah in 1968, impressive advances have been made in the field of CEUS, both in terms of microbubble structure and contrastspecific US techniques [3].
The added value of CEUS lies in compensating for the inherent limitations of Doppler techniques, including a lower signal-to-noise ratio, lower sensitivity for slow flow (particularly in deeper vessels) and technical artifacts such as Doppler angle dependence, aliasing and overwriting artifacts. As a result, CEUS not only significantly improves blood flow visualization and wall delineation, but also demonstrates microvascularity. Currently, an increase of more than 30 dB can be achieved in the echogenicity of blood after administration of an ultrasonographic contrast agent (UCA), and even single microbubbles can be visualized in circulation at the capillary level [4,5]. The introduction of second-generation UCAs in 2001 and the emergence and widespread availability of low-mechanical index (MI) contrast-specific techniques revolutionized CEUS and led to an expansion of its applications.
CEUS is already a well-established modality for a series of applications in adult patients, with official guidelines and recommendations available [5,6]. An explanation and guidance on how to perform CEUS was recently published by the European and World Federations for Ultrasound (European Federation of Societies for Ultrasound in Medicine and Biology [EFSUMB] and World Federation for Ultrasound in Medicine and Biology) [7]. In this paper, we will discuss the basic principles of CEUS and present an overview of its vascular applications.
Microbubbles: Structure and Principles of Interaction with Ultrasound
UCA microbubbles consist of two parts: (1) an internal gas encapsulated by (2) an outer shell consisting of phospholipids or albumin. The gases contained in first-generation UCAs, such as Levovist (Bayer Schering Pharma, Berlin, Germany) were small molecules that readily traversed the shell of the microbubble and diffused within the blood. Consequently, the duration of enhancement was brief, leading to the use of more inert, hydrophobic and slowly diffusing gases such as sulphur hexafluoride or perfluorobutane in second-generation UCAs, including SonoVue, which is also marketed as Lumason in the United States (Bracco), Definity (Lantheus Medical Imaging), Optison (GE Healthcare) and Sonazoid (GE Healthcare). Each of these agents has different properties, with some being used exclusively for cardiac applications (Optison) and others only for the characterization of focal liver lesions (Sonazoid). SonoVue is the most frequently used UCA for vascular applications, being the only one licensed for use in macrovascular applications including the cerebral arteries, extracranial carotid or peripheral arteries and the portal vein in adult patients, as well as microvascular applications in the liver and breast.
SonoVue consists of sulphur hexafluoride (SF6) and a phospholipid monolayer shell, which is amphiphilic, with a hydrophilic outer side and an inner hydrophobic side. With these properties, the shell can successfully contain the gas inside the microbubble. Importantly, this shell is flexible, allowing for changes in the shape and size of the microbubbles, which is a feature useful for generating a reflective signal on US [4]. The microbubbles contained in SonoVue have a mean size of 2.5 μm (ranging from 1 to 10 μm). This is a crucial fact for three reasons: (1) this size is large enough to prevent the microbubble from exiting into the extravascular space, (2) it is small enough to permit passage from the lung microcapillaries (with a mean diameter of 7 μm), and (3) it allows for optimal oscillation in a US field. The resonance frequency of a microbubble is associated with its size, ranging from 1 to 10 MHz, covering the frequencies used in diagnostic US. The mean diameter of SonoVue (2.5 μm) has a resonance frequency of approximately 4 MHz, a frequency used for abdominal applications, which explains the excellent signal produced by microbubbles even with a small dose of UCA [4]. UCAs dissolve some minutes after their intravenous administration, with the internal gas being exhaled by the lungs and the phospholipid shell metabolized by the liver. Since the kidneys are not involved in UCA metabolism, these agents are not nephrotoxic, offering a crucial advantage over computed tomography (CT) and magnetic resonance (MR) imaging contrast agents. Moreover, UCAs have no effect on the thyroid, contributing to their safety profile [6]. A property of UCAs that is crucial for vascular CEUS is their strictly intravascular nature, as they never leave the vascular bed (also termed blood-pool agents), in distinction to CT and MR imaging contrast agents, which typically gradually traverse the vascular wall into the extracellular space, reaching an equilibrium concentration between the intravascular and extravascular space. Microbubbles have the property of being strictly intravascular because their diameter is similar to that of red blood cells, making them unable to pass through the vascular endothelium. An exception to this rule is Sonazoid and Levovist, which are phagocytosed by Kupffer cells in the liver, a property which is not useful in vascular imaging [7,8].
The MI is an important parameter in CEUS, and is defined as the peak negative pressure divided by the square root of the US frequency. In essence, the MI is an indicator of insonation power (amplitude of the US wave pressure) applied to the microbubbles and tissues within the examination field and is typically displayed on the screen during a US examination. Typical MI values for conventional grayscale imaging are 1.6-2.0, and CEUS can be currently performed with much lower MI values [7-9].
Microbubbles tend to respond linearly at very low MI values, meaning that they reflect at the same frequency that is emitted by the transducer (fundamental). When exposed to higher acoustic pressure, but still at a low MI, the microbubbles oscillate, which is a nonlinear response, and generate harmonic frequencies. At high MI values, microbubbles oscillate very strongly and are eventually disrupted, emitting strong signals detectable by the transducer. With flexible shells, UCAs can oscillate at MIs well below the breaking point, allowing for optimal visualization [4,8,9]. The nonlinear oscillation, in which the microbubbles periodically change in size, expanding during the negative peak of US beam pressure wave and contracting during the positive peak, can be usefully imaged. The microbubble expansion observed is greater than the contraction, explaining the nonlinear nature of the response. This oscillation results in the generation of frequencies higher than the fundamental frequency initially hitting the microbubble, which are termed harmonic frequencies. When SonoVue is exposed to a US beam at 3.5 MHz, the frequencies generated include the sub-harmonic (half the fundamental), the ultra-harmonic (1.5 times the fundamental) and the second harmonic (double the fundamental). Even the destruction of a microbubble exposed to a high MI generates detectable high-intensity signals, which are only very transient and referred to as stimulated acoustic emission. These signals can be accurately visualized with high sensitivity, even with conventional color Doppler US, but this technique cannot be performed continuously due to the destruction of microbubbles [4].
Static tissues exposed to a low-MI US beam generate linear signals. However, the opposite happens when a higher MI is applied, with static tissues responding non-linearly and producing harmonic frequencies, similar to those originating from microbubbles and thus hampering UCA visualization, which is a further reason for using a low MI for CEUS examinations [8,9].
The safety profile of UCAs is well established, with no evidence of cardiac, hepatic, thyroid or renal toxicity. Severe adverse reactions occur less frequently than with current CT contrast agents and at roughly the same rate as with MR contrast agents. In a series of 23,188 patients undergoing abdominal CEUS, the rate of life-threatening allergic reactions was reported to be 0.001%, with no deaths reported and only two patients complaining of serious adverse reactions [10]. Anaphylactoid reactions have been reported to affect 0.014% of patients undergoing CEUS, a rate lower than that of CT (0.035%-0.095%) and comparable to that of MR imaging (0.001%-0.01%) [10-14]. UCAs were equally safe for echocardiographic applications [15,16] and for paediatric applications [17]. Despite the favourable safety profile of UCAs, departments where CEUS examinations are performed should be equipped with appropriate equipment and the personnel should be trained to treat allergic reactions [5-7].
Principles of Contrast-Specific Ultrasonographic Techniques
Based on the US wave-microbubble interactions, there are two ways of visualizing the UCA signal, which also correspond to the type of UCA. First-generation agents were generally imaged with high-MI techniques (high-MI CEUS with MI values >0.7), resulting inevitably in intermittent scanning and the subsequent early destruction of microbubbles. These techniques deployed the conventional color Doppler and power Doppler techniques. In simple terms, the UCAs were simply administered in order to increase the signal deriving from blood flow and to improve the signal-to-noise ratio, enhancing Doppler signals [18].
Second-generation agents are more stable, allowing continuous scanning, taking advantage of the emergence of low-MI CEUS techniques and evolving into the standard method for CEUS imaging. Current machines can generate adequate images with an MI as low as ≤0.1 (reaching 0.05) and maintain microbubble preservation [4,8]. The pulse-inversion technique is the latest advance in contrast-specific technologies and currently the most commonly used technique. This technique makes use of the different frequencies generated by microbubbles and static tissue to separate them, thereby enabling the exclusive visualization of microbubbles. The transducer initially emits a sequence of two pulses in rapid succession, identical in frequency and amplitude, but the second pulse is 180° out of phase compared to the first, representing an inverted copy. Static tissue reflects the same frequencies as those received; thus, the two pulses are cancelled and generate no detectable signal in the transducer. Microbubbles, though, generate harmonic frequencies, which are not opposite and thus add together to produce a strong signal (Fig. 1) [6]. The amplitude modulation technique makes use of a series of pulses with different amplitude, whose reflected signals from microbubbles can be selectively detected and visualized. This technique has better depth penetration than the pulse-inversion technique, although with poorer resolution; therefore, it could be preferred for deep blood vessels [5,7,19-23].
Schematic diagram showing the pulse-inversion technique.
On the top, the static tissue response is illustrated, reflecting the same two inverted pulses that are emitted and thus generating no signal. On the bottom, the microbubbles respond non-linearly, thereby generating harmonic frequencies that, when added, produce a signal detectable by the transducer.
In an attempt to minimize the disruption of microbubbles, a useful strategy is to perform continuous imaging for the first 60 seconds (complete arterial phase and part of venous) and thereafter to scan intermittently with short loops at 30-second intervals to observe the wash-out. This technique is more useful for liver applications, as with vascular applications continuous scanning for 60 seconds is usually sufficient to establish the diagnosis and collect relevant clinical information [7].
In low-MI techniques, re-observation of arterial enhancement and the arrival of microbubbles is possible after the destruction of microbubbles with a high-MI pulse, lasting for a couple of seconds. This pulse destroys every microbubble in the plane of insonation and allows the observation of the filling pattern of structures examined for a second or third time. This strategy can be usefully applied in vascular pathology in contexts including (1) re-evaluation of the origin of an endoleak, (2) analysis of enhancement of a plaque, and (3) obtaining evidence of contrast extravasation in vascular injuries.
UCA injection is usually performed with a bolus intravenous injection, followed by 5-10 mL of normal saline as a flush. The antecubital fossa vein is usually used, although central venous lines and ports may also be used if a peripheral vein cannot be accessed. According to the manufacturer, 2.4 mL of SonoVue is the recommended dose for vascular applications. Nonetheless, the dose can be adjusted according to the characteristics of the patient and scanning device. For instance, if a high-frequency transducer (>10 MHz) is to be used for superficial applications (e.g., scrotal imaging), an increased dose of 4.8 mL should be considered. In order to avoid microbubble destruction during administration, a 20-gauge cannula should be used and the dose should be administered either directly to the cannula or via the straight line of a 3-way stopcock [4,7]. A study found no difference in enhancement when catheters ranging from 18- to 21-gauge were used [24]. A continuous and constant delivery of the UCA (at roughly 1 mL/min) can sometimes be performed in order to lengthen the duration of enhancement and the time of examination; this technique is often used in oncologic applications to assess response to therapy, in myocardial perfusion studies in cardiology and in contrast-enhanced voiding urosonography for the diagnosis of vesicoureteral reflux in children [4,7].
Temporal maximum intensity projection (MIP) is another feature of CEUS, and is useful for demonstrating vascular architecture. In this mode, the US device records bright echoes for a defined time period and accumulates them in order to form detailed images of the macrovasculature and microvasculature. To achieve this, the physician should initially apply a high-MI pulse in order to disrupt all microbubbles and erase every signal. After this point, every microbubble entering the imaging plane adds its signal to the aggregated image, thereby enabling visualization of the vascular architecture. In essence, the US transducer acts as an "open shutter camera" and produces images similar to those produced with MIP in CT and MR imaging. Color coding in temporal maps has been recently introduced by some manufacturers to better and more objectively evaluate the arrival of microbubbles using the MIP technique [25].
Useful tips regarding the optimal application of vascular CEUS can be found in Table 1 [7,9].
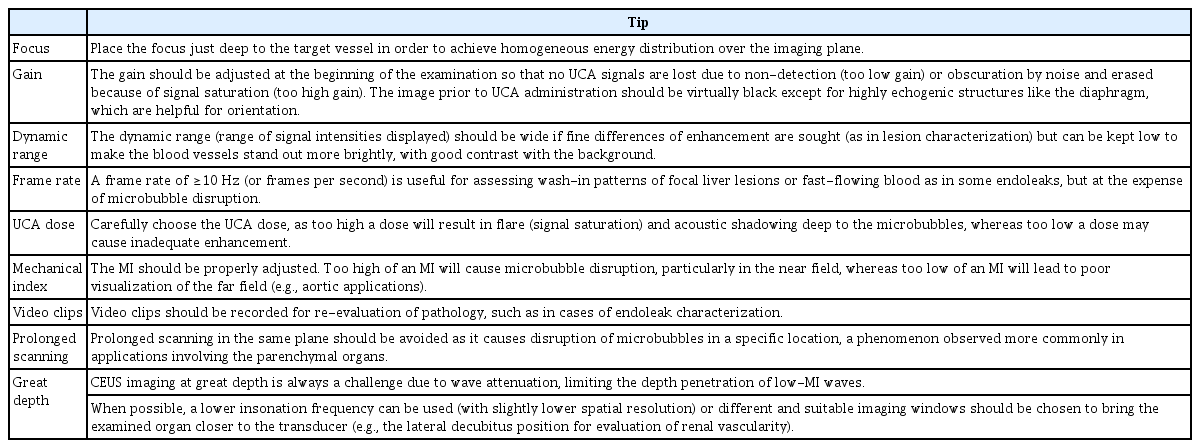
Tips for performing vascular CEUS
Quantitative CEUS
CEUS can be subjectively and qualitatively evaluated and interpreted by the physician performing the examination. However, current technology also provides the possibility to quantify the level of enhancement and generate quantitative indexes. Quantitative analysis can be performed either with a bolus injection or with the so called burst-replenishment technique, in which microbubbles are destroyed by a high-MI pulse after reaching an adequate concentration in the vascular bed and then re-observed during refilling of the field of view. The fact that UCAs remain strictly within the vascular bed means that the calculation of tissue perfusion and microvascularity indices is much more straightforward, compared with agents used for CT and MR imaging that diffuse in the extravascular space [4,7]. Quantitative CEUS is performed using time-intensity curve (TIC) analysis, in which the signal intensity of a region of interest is plotted over time. The curve formed represents the pattern of enhancement, increasing with time during the arterial enhancement, reaching a plateau of variable degree and duration and then decreasing during wash-out. Quantitative parameters calculated include peak enhancement, time to peak and area under the curve. An example of how this analysis can help with vascular disease is the quantification of enhancement in carotid plaques in order to quantify intraplaque neovascularization [26] and the TIC analysis of an abdominal aortic aneurysm sac to detect endoleaks after endovascular aneurysm repair [27,28].
CEUS Artifacts
Many artifacts affect CEUS, some of which also occur in conventional US, whilst others are exclusively encountered in contrast-specific techniques. In the former case, artifacts include increased through-transmission, mirror artifacts, acoustic shadowing and reverberation (Fig. 2). These artifacts may appear accentuated in CEUS images, since techniques such as spatial compounding and frame averaging are not activated in order to reduce microbubble disruption. In the second category, some artifacts are caused by the inadvertent disruption of microbubbles, such as signal loss due to continuous scanning in one image plane or the near-field signal loss caused by an inappropriately high MI [9,29]. In this section, we will focus on CEUS artifacts more closely related to vascular applications of CEUS.

Contrast-enhanced ultrasonography (CEUS) artifacts.
A. Acoustic shadowing (arrowheads) caused by a calcified plaque is shown. B. A color blooming artifact is noted, with color Doppler blood flow signals being enhanced by microbubbles and appearing outside the vascular lumen. C. High-intensity transient signals (arrowheads indicate spikes) are visualized superimposed onto the waveform in the pulsed-wave Doppler technique. D, E. B-mode (D) and CEUS (E) of the same patient show a focal calcification on a plaque (arrows) appearing hyperechoic on B-mode and being projected onto the CEUS image due to unsuccessful suppression. This finding should be carefully recognized to avoid false diagnosis of an ulceration.
Nonlinear propagation artifacts are a form of pseudo-enhancement observed in tissues or the vascular wall situated deep to the vascular lumen. These artifacts are caused by the nonlinear propagation of US waves through a cloud with a high concentration of microbubbles (situated within the vascular lumen) and are visualized as apparent bubble signals in areas with no true enhancement. In vascular applications, these artifacts may lead to a false diagnosis of neovascularization in carotid plaques affecting the distal wall of the carotid. True microbubble signals can be differentiated based on a comparison with the grayscale image, enabling differentiation of artifactual signals, and through observation of enhancement dynamics exhibited by true microbubble movements in all phases. These artifacts can be avoided by avoiding an excessively high dose of UCAs. Another relevant artifact is the visualization on a greyscale image of a hyperechoic structure that is unsuccesfully suppressed and thus appears on a contrast-specific image as bright echoes. This can be misinterpreted as enhancement, although this artifact is easy to identify based on the fact that true microbubbles move, but artifactual echoes are static. In vascular applications, this artifact is frequently encountered due to wall calcifications, which should not be mistaken for plaque ulcerations or neovascularization (Fig. 2) [7,29-31].
In color Doppler US, microbubbles tend to significantly increase the signal intensity of blood vessels and adjacent perfused static tissue. This means that low-intensity signals that were previously filtered now become visible, whilst the intensity of visualized flow signals is markedly enhanced, resulting in excessive color blooming or an overwriting artifact, demonstrating flow signals in areas with no flow (e.g., mural thrombus) and obscuring the surface of plaques and the vascular wall (Fig. 2). Moreover, this artifact may cause the false interpretation of findings as turbulent flow, mimicking stenosis. In the pulsed-wave Doppler technique, early reports showed that peak systolic velocity could be falsely measured (with values of up to 45% greater than the real values) when the measurement was performed after UCA administration, which was attributed to the increase of signals by the UCA. Nevertheless, this observation was made with older systems, and more recent studies have not been confirmatory [20,32,33]. Finally, the pulsed-wave Doppler technique may record high-intensity transient signals superimposed on the Doppler waveform, appearing as sharp spikes. These spikes, also audible as crackling sounds, are caused by the disruption of microbubbles by the high-MI pulse used in the Doppler technique (Fig. 2). Based on all these Doppler-related artifacts, it is recommended that Doppler techniques, including color Doppler visualization of blood flow and pulsed-wave Doppler interrogation, should be performed prior to the administration of microbubbles and CEUS should be performed with contrast-specific techniques [20].
Overview of Vascular CEUS
The role of CEUS in vascular imaging is multifaceted, as the technique is used for the initial diagnostic work-up, guiding of interventional treatment and follow-up. Moreover, there are various types of vascular applications, which can be categorized into four groups for educational purposes as follows, described in Table 2 and illustrated in Fig. 3: (1) luminal applications, (2) characterization of intraluminal pathology, (3) characterization of vascular walls, and (4) investigation of potential extravascular leakage. The 2017 version of the EFSUMB guidelines and recommendations on vascular CEUS is presented in Table 3 [6]. Similarly to unenhanced US, CEUS of the carotid and other superficial arteries can be performed with a linear-array transducer of 5-10 MHz, whilst the abdominal aorta, portal vein and other abdominal blood vessels can be examined with a convex transducer of 2.5-5 MHz [5].
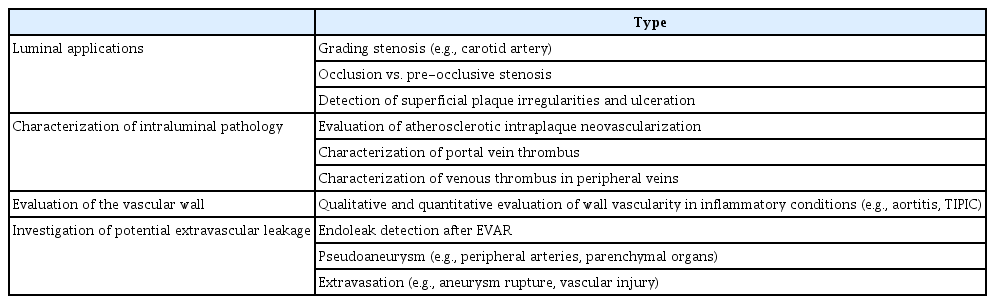
Overview of various types of potential vascular CEUS applications grouped into four categories
Diagrammatic representation of categories of vascular contrast-enhanced ultrasonography applications.
These applications include (1) luminal applications (A) focusing on improved delineation of the vascular lumen; (2) characterization of intraluminal pathology, such as an atherosclerotic plaque (B) or thrombus (C); (3) characterization of the vascular wall by studying enhancement (D); and (4) investigation of potential extravascular leakage (E), as in the case of a pseudoaneurysm.

The 2017 version of the European Federation for Ultrasound guidelines on the vascular use of CEUS
Carotid Artery
In carotid artery disease, CEUS has the potential to provide information both on a macrovascular level and a microvascular level. In the first case, CEUS offers improved blood flow visualization and vascular wall delineation, thereby providing accurate grading of stenosis, with a strong correlation with conventional angiography for diametric stenosis of the internal carotid artery and with MR imaging for area stenosis [34-36]. Furthermore, CEUS is comparable to CT angiography (CTA) and MR angiography for distinguishing occlusion from pre-occlusive stenosis and outperforms conventional Doppler US, as it is more sensitive in detecting a thread-like lumen in pre-occlusive stenosis [37-39].
In terms of plaque delineation, the use of microbubbles improves delineation of the endovascular border, including the ability to distinguish among plaque, thrombus and vascular wall in the pre-, intra-, and post-stenotic part of the vessel [40]. In this respect, UCAs can be used to accurately diagnose superficial plaque ulcerations, which can be detected with improved sensitivity compared to color Doppler US and represent an essential feature of plaque vulnerability (Fig. 4) [41-44]. On a microvascular level, CEUS can accurately evaluate intraplaque neovascularization, both qualitatively and quantitatively using TIC analysis. CEUS findings of neovascularization correlate with histologic findings of neovascularity and inflammation and are predictors of cerebrovascular symptoms, as plaques in symptomatic patients exhibit significantly higher enhancement [41,45-54]. In carotid inflammation including transient perivascular inflammation of the carotid artery (TIPIC) syndrome, CEUS not only better delineated vascular wall irregularities caused by inflammation, but also highlighted wall enhancement consistent with inflammatory vascularization, a marker of disease activity (Fig. 5) [55,56].

Imaging findings in an ulcerated internal carotid artery plaque.
A. Color Doppler ultrasonography shows a highly stenotic hypoechoic internal carotid artery plaque. The surface of the plaque appears irregular with overwriting artifacts present and color aliasing due to turbulence caused by severe stenosis. B. Contrastenhanced ultrasonography accurately delineates the plaque surface and the vascular lumen, identifying an ulceration (arrowhead) and accurately grading stenosis. C. The ulceration (arrowhead) was also confirmed on computed tomography angiography.
Imaging findings in a 52-year-old man diagnosed with transient perivascular inflammation of the carotid artery syndrome.
A. Longitudinal B-mode image shows hypoechoic mural thickening (arrowhead) eccentrically affecting the origin of the external carotid artery. The lesion was situated exactly at the location where the patient complained of pain. B, C. Transverse (B) and longitudinal (C) temporal maximum intensity projection contrast-enhanced ultrasonography images show intense enhancement of the lesion (arrowheads), a finding in keeping with an inflammatory lesion. D. Time-intensity curve analysis offers the potential to quantitatively analyze the enhancement of the lesion (yellow curve) compared with the lumen for reference (green curve), which is information useful for initial characterization and follow-up after conservative treatment. E. Computed tomography angiography confirmed the findings (arrowheads), although quantitative information about enhancement is not possible with the level of accuracy and duration provided by CEUS.
Beyond these applications, CEUS is valuable for evaluating restenosis after stenting of the internal carotid artery, improving visualization of the stent lumen [57], and has the potential to identify carotid dissection (Fig. 6) [58]. Although MR imaging is still the reference method, CEUS is able to demonstrate intramural haematoma and, finally, can better delineate fistulae and demonstrate flow within aneurysms or pseudoaneurysms occurring as a post-interventional complication [40,59].
Ultrasonography and contrast-enhanced ultrasonography findings in carotid dissection.
A. Color Doppler image shows narrowing of the common carotid artery lumen by a hypoechoic area possibly exhibiting reversed flow, which was not well visualized tdue to slow flow velocity. B, C. An early contrast-enhanced ultrasonography image (B) and one taken a couple of seconds later (C) show the true lumen enhancing earlier and the false lumen enhancing later. An intimal flap appears anechoic and separates the two lumens.
Aorta
CEUS can readily evaluate an aortic aneurysm, whilst also detecting aortic aneurysm rupture by demonstrating microbubble extravasation, although CTA remains the standard method for this diagnosis [60]. In the setting of inflammatory abdominal aortic aneurysm, CEUS can depict enhancement of the aneurysm wall, caused by inflammatory vascularity [61]. As a result, CEUS can discriminate between covered rupture of an aneurysm, showing mural thickening with no enhancement, and inflammatory aortic aneurysm, exhibiting marked enhancement of the vascular wall [62]. Similarly to the carotid arteries, dissection of the abdominal aorta can be readily visualized with CEUS, with higher accuracy than color Doppler US, with particularly improved sensitivity for slow flow, which is commonly encountered in false lumens. Microbubbles are also helpful in differentiating a true lumen from a false lumen, since the first enhances earlier than the second. Importantly, CEUS offers the opportunity to assess tissue perfusion during the same examination, readily demonstrating parenchymal organ ischemia as a complication of dissection [62,63].
After endovascular aortic repair (EVAR), endoleak is a common complication, defined as the presence of blood flow outside the stented lumen, remaining within the borders of the aneurysmal sac and within the thrombotic material filling the latter. Based on the origin of the endoleak, five different types have been documented. A type I endoleak is a high-flow endoleak originating from the proximal (Ia) or distal (Ib) end of the stent and into the aneurysmal sac. Type II endoleak is the most common, and may be a high- or low-flow leak originating from the inferior mesenteric artery or the lumbar arteries. It is further classified into type IIa if a single vessel is involved or type IIb if two vessels are affected. Type III endoleak is rare, being a high-flow leak originating from a defect in the stent graft. Type IV endoleak is associated with porosity of the stent graft material and is observed during stent implantation, requiring no further treatment. Type V endoleak is associated with an enlargement of the aneurysm sac with no detectable source ("endotension") (Fig. 7) [62].
Diagrammatic representation of the five types of endoleaks.
Type I endoleak (A), type II endoleak (B), type III endoleak (C), type IV endoleak (D), and type V endoleak (E) are shown.
This is a clinically significant classification given the different treatment required for different types of endoleaks. Type I and III endoleaks require interventional treatment given their higher risk for rupture, whereas type II endoleaks can be followed up with imaging until spontaneous thrombosis. If spontaneous resolution is not achieved, but an enlargement of the aneurysmal sac of more than 1 cm is documented, an intervention may be required [62]. CTA is the most commonly used modality for detection of endoleaks, although it entails the disadvantage of ionizing radiation and use of a nephrotoxic contrast agent, which is particularly harmful as there is a lifelong need for imaging of these patients. CEUS can diagnose endoleaks with higher accuracy than CTA and can be used to re-categorize previously diagnosed type V endoleaks (Figs. 8, 9) [27,64-69]. Detection of endoleaks with CEUS is typically performed through a qualitative assessment of enhancement, although quantitative analysis with TIC has also been considered, with promising results [27,28]. CEUS could be potentially incorporated into imaging algorithms of endoleak detection as a second complementary step to color Doppler US screening. Further imaging with CTA could be safely deferred if no evidence of endoleak is recorded on CEUS, whereas CTA could be performed in cases with abnormal or equivocal findings.
Contrast-enhanced ultrasonography findings of four types of endoleaks.
The asterisks show the occluded aneurysmal sac and the arrowheads the endoleaks. A. A type Ia endoleak is demonstrated with the endoleak originating from the cephalic end of the stent graft. B. A Type II endoleak is demonstrated with the endoleak originating from a lumbar artery. C. A type III endoleak is demonstrated with the endoleak originating from a defect in the stent graft. D. A type IV endoleak is demonstrated with multiple jets of microbubbles flowing through the fabric of the stent graft.
Fusion contrast-enhanced ultrasonography (CEUS)-computed tomography angiography (CTA) technique in a postendovascular aortic repair case of aortic imaging.
A. Registration image shows the same mural calcification in both techniques (yellow cross mark). B. A different fusion image shows a type II endoleak on CEUS (yellow cross mark), possibly originating from a lumbar artery, which was not detected on CTA.
Hepatic Vessels
The portal vein can be affected by thrombosis, the deposition of thrombotic material in any part of the portal venous system, which may be completely or partially occluded. Portal vein thrombosis is encountered in cirrhotic livers with a prevalence of 0.6%-11% [70]. The thrombus may be bland, usually being silent and having no clinical importance, but it also may be malignant, almost always associated with hepato-cellular carcinoma of the liver. The latter finding carries great clinical significance, with alteration of treatment options and upstaging of the disease. Portal vein thrombus is typically hyperechoic, but may be anechoic, thus making the vessel appear normal on the B-mode technique or hypoechoic. Greyscale imaging of the portal vein should be complemented with the color Doppler technique and pulsed-wave Doppler interrogation. No blood flow signals will be detected in case of complete occlusion by thrombus. The detection of blood flow signals with an arterial waveform on spectral examination inside the thrombus is a highly specific, but moderately sensitive sign of malignancy. Continuity of the thrombus with the hepatic tumour is another feature in keeping with a malignant nature that is evident on greyscale imaging.
CEUS is characterized by improved sensitivity for visualization of thrombi and neovascularity (suggesting malignancy) within the thrombotic material. A bland thrombus appears as a filling defect within the portal vein, avascular in all phases, although most conspicuous in the portal venous phase. A malignant thrombus has the same enhancement pattern as the tumour of origin, including rapid arterial phase hyper-enhancement simultaneously with the hepatic artery and rapid or late and mild portal venous wash-out (Fig. 10).
Malignant portal vein thrombosis on conventional ultrasonography and contrast-enhanced ultrasonography (CEUS).
A. Color Doppler ultrasound shows patency of the hepatic artery (HA), but an absence of blood flow signals within the portal vein (PV), part of which appears filled with echogenic material (asterisk) consistent with thrombosis. No definite blood flow signals can be detected within the thrombus, suggesting the diagnosis of bland thrombus. B. A focused Clarify vascular enhancement mode image (Siemens Healthcare) shows a B-mode image of vessels with reduced noise and artifacts and with better definition (asterisk indicates thrombus). C. Portal venousphase CEUS image shows enhancement of the thrombus (blue cross mark) but relative wash-out compared with the hepatic parenchyma, which are findings that establish the diagnosis of malignant thrombosis.
The thrombus can be targeted for biopsy under US guidance, with an attempt made to take specimens from enhancing regions of the thrombus. CEUS has also been found to be very useful in complementing US-guided biopsy of the thrombus in order to establish the diagnosis of benign or malignant thrombus. The tumour causing the thrombus may not be visible with US, although it can sometimes be detected while scanning the liver in any phase after UCA administration. Washed-out areas detected in the portal venous phase can be observed in the arterial phase (for vascularization) after re-injection to confirm the diagnosis. Compared with CT and MR imaging, CEUS offers the advantage of continuous and real-time scanning of thrombus vascularity for several minutes, whereas the former techniques typically record a few "snapshots" of thrombus enhancement [70-75].
Peripheral Arteries
When it comes to peripheral arteries, conventional Doppler US techniques are well-established and CEUS has not demonstrated significant superiority for detecting stenosis, although it can be used to detect complications after interventional procedures, as in cases of femoral artery pseudoaneurysm (Figs. 11, 12). Vascular injury after trauma, along with other causes, may result in the formation of aneurysms or, more commonly, pseudoaneurysms, which potentially require interventional treatment if they become symptomatic and rupture. CEUS not only can detect such a complication, but can also potentially determine the anatomic location of the origin of ongoing haemorrhage (Figs. 13, 14) [76]. In a paediatric population series, pseudoaneurysms were encountered in 17% of children sustaining liver or splenic injuries and CEUS was 83% sensitive and 92% specific for this diagnosis, offering a valuable alternative to CT for diagnosis and follow-up of this entity [77].

Atherosclerosis of the external iliac artery before and after angioplasty.
A. Color Doppler ultrasonography shows severe stenosis with significant turbulence. Note the presence of aliasing and an overwriting artifact, whilst some parts of the lumen are not filled with Doppler signals due to low sensitivity. B. A contrast-enhanced ultrasonography (CEUS) image accurately delineates the borders of a plaque (asterisk) causing severe stenosis. The lumen is accurately visualized in its pre-, intra- and post-stenotic part. C. A CEUS image following angioplasty confirms the favourable result and the restored patency of the vessel.
Superficial femoral artery pseudoaneurysm on color Doppler ultrasound and contrast-enhanced ultrasonography (CEUS).
A. Color Doppler ultrasonography (US) shows partial filling of the pseudoaneurysm along with its connection with the vessel of origin. The cavity of the pseudoaneurysm is partially filled with an echogenic thrombus. Color flow reversal is noted, giving rise to a "yin-yang" appearance. Overwriting artifacts obscure the fistulous neck of the pseudoaneurysm. B. A CEUS image shows filling of the patent part of the pseudoaneurysm and accurately delineates its neck. C, D. After thrombin injection, color Doppler US (C) and CEUS (D) show absence of blood flow within the successfully treated pseudoaneurysm. CFA, common femoral artery.
Hepatic artery pseudoaneurysm.
A. A B-mode image shows an enlarged anechoic rounded structure with a thickened wall, situated near the porta hepatis. B. Color Doppler ultrasonography shows the filling of the structure with color Doppler signals, establishing the diagnosis of pseudoaneurysm. Note that parts of the cavity are not filled with signals due to a lack of sensitivity. C. Contrast-enhanced ultrasonography (CEUS) image shows the filling of the pseudoaneurysm with microbubbles except for the limited mural thrombus, which appears anechoic. D. Computed tomography angiography confirms the diagnosis of a hepatic artery pseudoaneurysm, with mural thrombus and calcifications. E. After the placement of a stent (arrowhead), CEUS confirms the exclusion of the aneurysmal sac from circulation by documenting a lack of enhancement.
Pseudoaneurysm formation after renal biopsy.
A. A B-mode image shows a subcapsular renal haematoma (asterisk). B. Color Doppler US demonstrates blood flow signals in the renal hilum, with no clear evidence of further pathology. C. A CEUS image demonstrates a pseudoaneurysm (arrow), whilst the subcapsular haematoma (asterisk) and an intra-parenchymal haematoma (arrowhead) become prominent due to a lack of enhancement. D. Followup CEUS image after embolization of the pseudoaneurysm shows absence of the pseudoaneurysm and normal perfusion of the renal parenchyma, confirming the success of the intervention.
Conclusion
CEUS is a well-suited modality for the evaluation of vascular pathology given its favourable inherent characteristics such as the strictly intravascular nature of microbubbles used as UCAs. Physicians performing this technique should be familiar with basic physical principles in order to recognize artifacts, avoid misdiagnoses and correct them by making adjustments to scanning parameters. CEUS has already been studied in many vascular applications such as carotid disease, post-EVAR aortic evaluation and portal vein thrombus characterization, providing promising results and thus being included in official recommendations. Nonetheless, it has many more potential applications that have not yet been thoroughly studied.
Notes
Author Contributions
Conceptualization: Rafailidis V, Huang DY, Yusuf GT, Sidhu PS. Data acquisition: Rafailidis V, Huang DY, Yusuf GT, Sidhu PS. Data analysis or interpretation: Rafailidis V, Huang DY, Yusuf GT, Sidhu PS. Drafting of the manuscript: Rafailidis V. Critical revision of the manuscript: Huang DY, Yusuf GT, Sidhu PS. Approval of the final version of the manuscript: all authors.
PS has received lecture fees from Bracco, Siemens, Samsung, Philips, and Hitachi. The rest of the authors have no conflict of interest regarding the publication of this manuscript.
Acknowledgements
VR has received a scholarship for his PhD studies on "Imaging of the carotid vulnerable plaque with contrast-enhanced ultrasound and multi-detector computed tomography angiography" from the Alexander S. Onassis Public Benefit Foundation. VR has received honorarium from the Korean Society of Ultrasound in Medicine.