Clinical utilization of shear wave dispersion imaging in diffuse liver disease
Article information

Abstract
Shear wave (SW) dispersion imaging is a newly developed imaging technology for assessing the dispersion slope of SWs, which is related to tissue viscosity in diffuse liver disease. Our preclinical and preliminary clinical studies have shown that SW speed is more useful than dispersion slope for predicting the degree of fibrosis and that dispersion slope is more useful than SW speed for predicting the degree of necroinflammation. Thus, dispersion slope, which reflects viscosity, may provide additional pathophysiological insight into diffuse liver disease.
Introduction
Shear wave elastography (SWE) is an emerging technology that provides information concerning tissue elasticity by emitting an acoustic radiation force impulse to generate laterally propagating shear waves (SWs), and it can also provide biochemical information concerning tissue quality [1-3]. Furthermore, viscosity also provides biochemical information concerning tissue quality, as viscosity is considered to be a different property than elasticity [4-6]. However, most ultrasound (US) elastographic models use a linear elastic model to describe tissue mechanical properties, and only tissue elasticity is quantified. It is now well known that dispersion is related to the frequencydependence of the speed of SWs and the attenuation of SWs in the viscous component [7]. If a tissue is dispersive, the speed and attenuation of SWs increase with frequency [7]. Analysis of the dispersion properties of SWs can therefore serve as an indirect method for measuring viscosity. A new imaging technology known as shear wave dispersion imaging (SWD; Canon Medical Systems Corporation, Otawara, Japan) has recently been developed for evaluating the dispersion of SWs, which is related to the viscosity of liver tissue [8]. In this review article, the feasibility of liver viscosity evaluation using SWD is assessed based on the findings of preliminary animal experiments and clinical evaluations.
Shear Wave Dispersion Imaging
Theory
A homogeneous biological tissue can be modeled using viscoelastic models such as the Voigt and Maxwell models [9], which consist of a spring and a damper, and the Zener model [10], which consists of two springs and a damper. Using the Voigt model as an example to illustrate the frequency-dependence of SW speed, the SW speed cs at SW frequency ω is calculated by the Voigt model as shown below [11,12]:
where ρ , μ , and η are the density, shear elasticity, and shear viscosity of the medium, respectively.
When zero is substituted for shear viscosity η in Eq. (1)-that is, a perfectly elastic tissue is assumed and viscosity is ignored-the SW speed cs can be transformed into a simple relationship with shear elasticity:
However, as shown in Eq. (1), SW speed depends on the frequency of the SWs in a viscoelastic tissue and therefore exhibits frequency dispersion [12,13]. The gradient of SW speed-that is, the slope of the graph of SW speed versus frequency-varies according to the shear viscosity value. Therefore, the shear viscosity value can be estimated from the slope over the SW frequency bandwidth (Fig. 1). It should be noted that the slope does not directly correspond to viscosity, but this method has the advantage of providing meaningful quantification of a parameter that is directly related to viscosity without the need to use a rheological model.
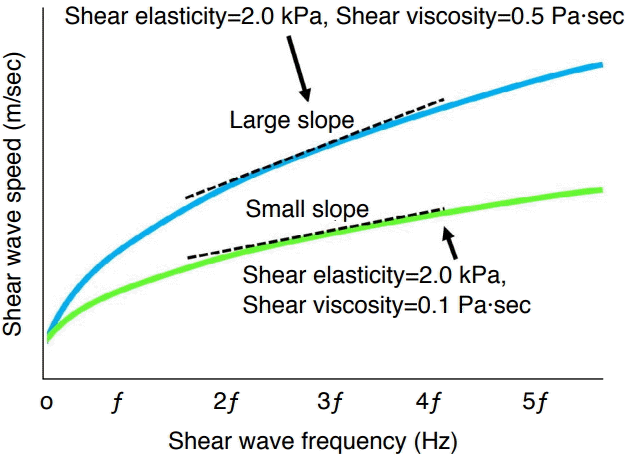
Relationship between shear wave speed and frequency in viscoelastic tissue.
In perfectly elastic tissue, shear wave speed is constant regardless of shear wave frequency. However, in viscoelastic tissue such as that found in the human body, shear wave speed does vary depending on shear wave frequency. The graph shows the relationship between shear wave speed and shear wave frequency in viscoelastic tissue. The charts are formulated based on the Voight model. If shear elasticity is fixed at 2.0 kPa and shear viscosity varies from 0.1 to 0.5 Pa·sec, the slope becomes higher according to the shear viscosity level. The slope itself is not the viscosity coefficient, but they correlate with the viscosity coefficient.
Shear Wave Dispersion Maps
SWD maps can be created using an imaging technique that has been incorporated into commercially available ultrasound systems (Aplio i-series, Canon Medical Systems). This technique can be used to estimate the dispersion slope of SW speed versus frequency in order to evaluate changes in tissue viscosity.
SWD processing involves four steps (Fig. 2). In the first step, the displacement induced by the SWs is obtained using a technique based on color Doppler scanning. Second, the displacement at each location is transformed from the time domain to the frequency domain through a Fourier transform in order to estimate the phase changes in the SWs at several frequencies. Third, SW speed is calculated using the phase-difference method. The SW speed at each frequency cs(ω ) is as shown below:

Schematic diagram of shear wave dispersion (SWD) map processing.
SWD processing involves four steps. First, the displacement induced by the shear waves (SWs) is obtained using a technique based on color Doppler scanning. Second, the displacement at each location is transformed from the time domain to the frequency domain by a Fourier transform in order to estimate the phase changes in the SWs at several frequencies. Third, the SW speed is calculated using the phase-difference method. Fourth, the gradient of the SW speed is calculated based on the distribution of SW speed versus frequency. The calculated gradient values are then superimposed on the measurement locations to create a dispersion map. FFT, fast Fourier transform.
where Δø (ω ) is the phase change over the distance traveled ΔL between two measurement locations in the direction of SW propagation. Fourth, the gradient of SW speed is calculated based on the distribution of SW speed versus frequency. The calculated gradient values are then superimposed on the measurement locations to create a dispersion map.
Shear Wave Dispersion Imaging
The details of the actual acquisition using the Aplio i-series are as follows. SWD can be activated automatically in SWE mode. The dispersion map shows dispersion slope, which is a parameter directly related to viscosity. The calculated dispersion slope value ([m/sec]/kHz) and its standard deviation are displayed. In SWE quad-view mode, SW speed or SW elasticity (speed map, elasticity map), SW arrival time contours (propagation map), grayscale, and dispersion slope (dispersion map) can be viewed simultaneously (Fig. 3).
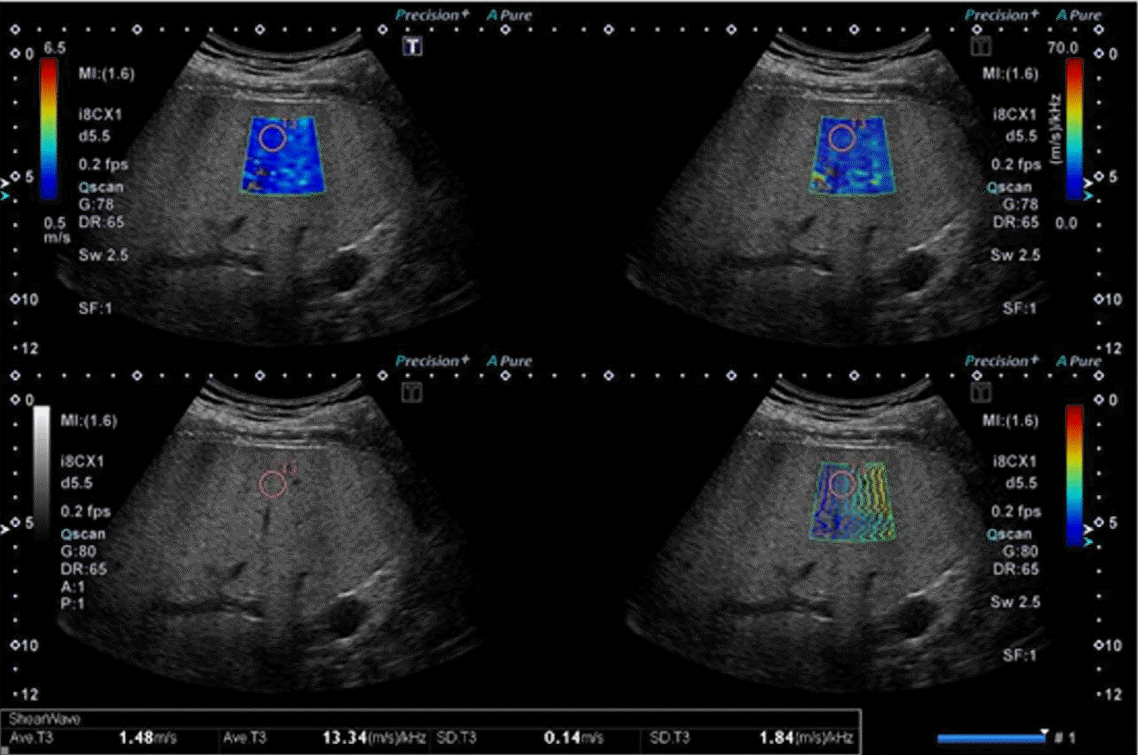
Quad-view for shear wave elastography/shear wave dispersion quantification.
Upper left, elasticity map; upper right, dispersion map; lower left, grayscale; lower right, propagation map.
Preclinical Study
Sugimoto et al. [8] investigated SW speed and dispersion slope measurements in rat livers with various degrees of necroinflammation and fibrosis, and the authors hypothesized that an increase in necroinflammatory changes in the liver would lead to an increase in dispersion slope and that an increase in fibrotic changes would lead to an increase in SW speed. Briefly, a total of 25 male Sprague-Dawley rats were randomly divided into five groups of five rats each: G0 (control), G1 (carbon tetrachloride [CCl4] injected twice a week for 1 week), G2 (CCl4 injected 4 times a week for 1 week), G3 (CCl4 injected twice a week for 6 weeks), and G4 (CCl4 injected twice a week for 10 weeks). G1 and G2 comprised a necroinflammation rat model, and G3 and G4 comprised a fibrosis rat model.
The distributions of the US values in each group are shown in Fig. 4A and B. SW speed tended to increase from G0 to G2, reached a peak value in G2, plateaued in G3, and decreased slightly in G4. SW speed was significantly higher in the fibrosis model (G3) (median, 1.67; interquartile range [IQR], 1.59 to 1.78) than in the necroinflammation model (G1) (median, 1.39; IQR, 1.24 to 1.61) (P<0.05). Dispersion slope rose sharply, reaching its peak value in G2, and was lower in the other groups. Dispersion slope was significantly higher in the necroinflammation model (G2) (median, 6.11; IQR, 5.16 to 7.43) than in the fibrosis model (G4) (median, 4.90; IQR, 4.39 to 4.97) (P<0.05). In the multivariable analysis (Table 1) conducted using histologic features as independent variables, fibrosis grade was significantly related to SW speed (P<0.05) and necrosis grade was significantly related to dispersion slope (P<0.05).

Shear wave speed and dispersion slope in inflammation and fibrosis model rats.
Boxplots show shear wave (SW) speed (A) and dispersion slope (B) (median and interquartile range) for each group (G0-G4). Kruskal-Wallis test: P<0.01; Jonckheere-Terpstra test: P<0.01. a)Wilcoxon signed-rank test: P<0.05. G0, rats that were not treated and served as control; G1, rats that received an intraperitoneal injection of 50% carbon tetrachloride (CCl4) twice a week for 1 week; G2, rats that received an intraperitoneal injection of 50% CCl4 4 times a week for 1 week; G3, rats that received an intraperitoneal injection of 50% CCl4 twice a week for 6 weeks; G4, rats that received an intraperitoneal injection of 50% CCl4 twice a week for 10 weeks.
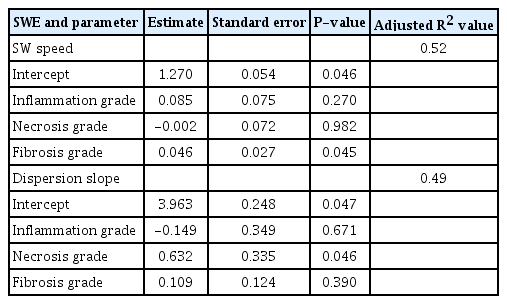
Results of multivariable regression analysis
Thus, as expected, the study showed that SW speed is a more effective predictor of the degree of fibrosis than dispersion slope and that dispersion slope is a more effective predictor of the degree of necroinflammation than SW speed.
Clinical Studies
To date, three clinical studies have assessed 2-dimensional (2D)-SWE focusing on viscosity in the clinical setting. Deffieux et al. [14] measured not only liver stiffness (kPa), but also viscosity (Pa·sec) and dispersion slope using the Aixplorer ultrasound imaging system (Aixplorer, Supersonic Imagine, Aix-en-Provence, France) in patients with viral hepatitis (n=70). Briefly, after each SWE acquisition, the SW propagation data were saved and processed to estimate SW dispersion using the SW spectroscopy technique [5]. The spectrum and dispersion curve of the SWs were then estimated by finding the maxima in k-space of the wave propagation profile [15]. Dispersion curves were then fitted, first using linear regression to determine the slope of the dispersion curve and then using a Voigt model to estimate the viscosity parameter. The results showed that viscosity had less predictive value in staging the degree of fibrosis than liver stiffness (area under the curve [AUC], 0.76 and 0.89 for significant fibrosis; AUC, 0.87 and 0.87 for cirrhosis, respectively) and was a poor predictor of disease activity and steatosis levels.
Chen et al. [16] measured both elasticity (kPa) and viscosity (Pa·sec) using shear wave dispersion ultrasound vibrometry (SDUV) technology with an ultrasound system (iU22, Philips Healthcare, Andover, MA, USA) in patients with various chronic liver diseases (n=35). Briefly, the main data postprocessing steps for SDUV were as follows, as described in the literature [16]: (1) cross-correlation-based speckle tracking was used to estimate the SW raw displacement; (2) conditioned displacement was obtained by mapping the displacement time curve to the uniform time grid and using bandpass filtering to remove background motion; (3) the SW speed was estimated at frequencies of 95, 190, 285, and 380 Hz; and (4) elasticity and viscosity were calculated using Voigt model fitting within the frequency range of 95-380 Hz. The results showed that viscosity measured by SDUV had less predictive value in staging the degree of fibrosis than elasticity measured by SDUV liver stiffness (AUC, 0.86 and 0.98 for differentiating between grade F0-F1 fibrosis and grade F2-F4 fibrosis, respectively), but the study included no analysis of the usefulness of viscosity for evaluating disease activity and steatosis levels.
Sugimoto et al. [17] investigated the usefulness of SW speed and dispersion slope measurements obtained using a US elastography system (Aplio i 800, Canon Medical Systems) in patients with biopsy-proven nonalcoholic fatty liver disease (NAFLD; n=24). In a multivariable analysis with histologic features as independent variables, fibrosis stage was found to be significantly related to SW speed (P=0.037) and lobular inflammation grade was significantly related to dispersion slope (P=0.022). SW speed was found to be more useful than dispersion slope for predicting the degree of fibrosis, and dispersion slope was found to be more useful than SW speed for predicting the degree of necroinflammation. These findings suggest that performing dispersion slope measurements, as well as SW speed measurements, may lead to more accurate diagnosis, staging, and treatment monitoring of nonalcoholic steatohepatitis (NASH) than is possible using existing imaging methods (Fig. 5).
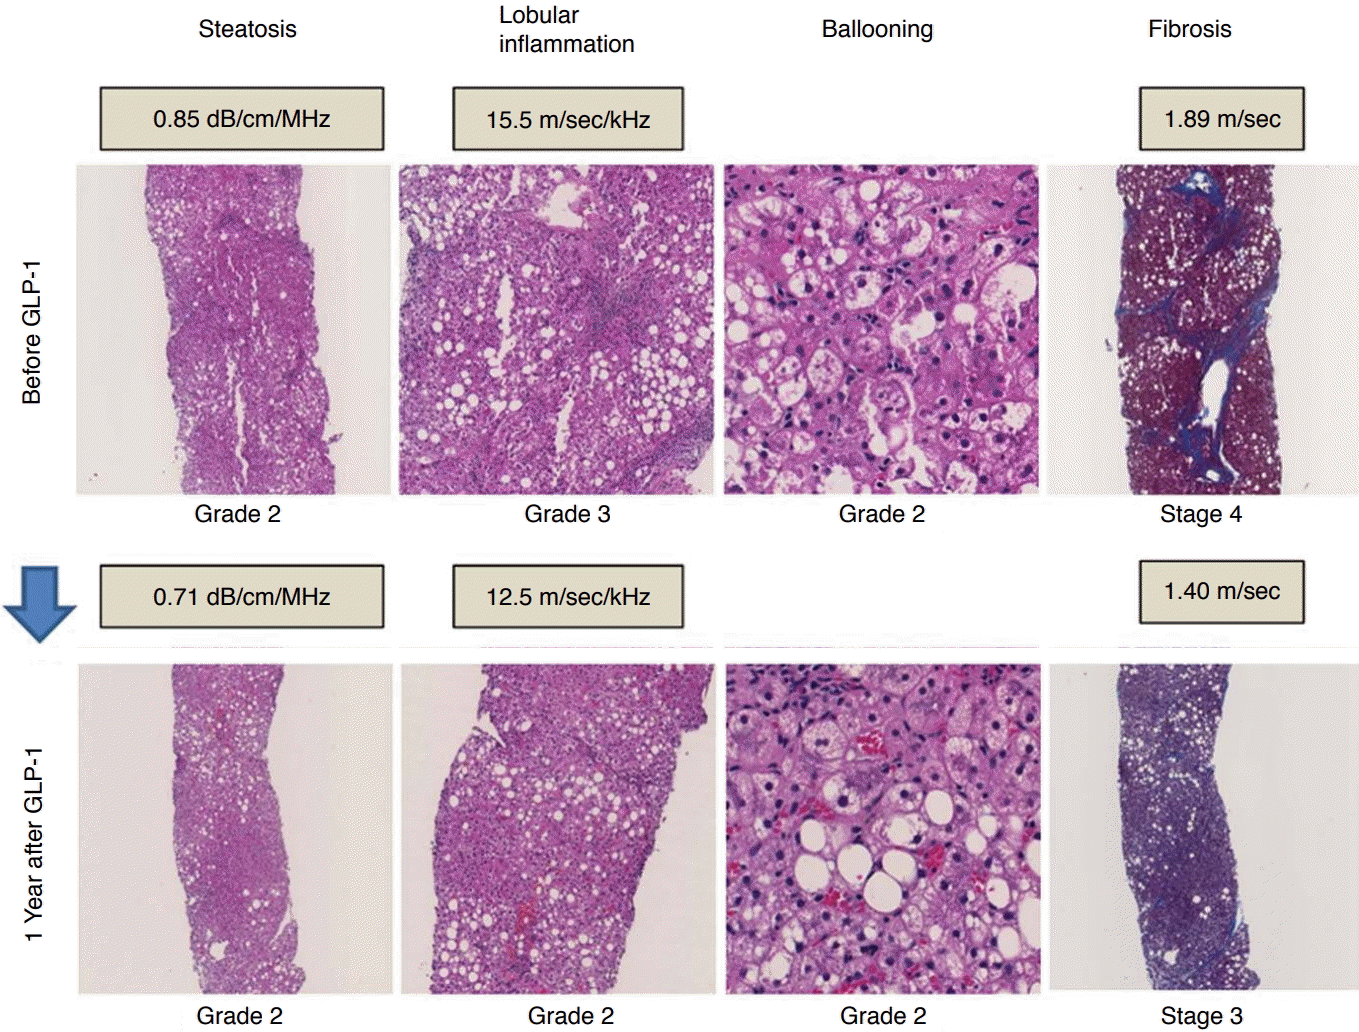
Histopathologic and ultrasonography parameter changes in patient with nonalcoholic steatohepatitis.
Histopathologic changes in a patient with nonalcoholic steatohepatitis and type 2 diabetes mellitus, comparing findings from before glucagon-like peptide-1 (GLP-1) therapy and 1 year after therapy. As the lobular inflammation grade improved from grade 3 to 2, the dispersion slope also improved from 15.5 to 12.5 m/sec/kHz. As the fibrosis stage improved from stage 4 to 3, shear wave speed also improved from 1.89 to 1.40 m/sec.
The three clinical studies focusing on elasticity and viscosity have been summarized above. All these studies showed that elasticity was more useful than viscosity for evaluating the stage of fibrosis. Deffieux et al. [14] also reported that viscosity was a poor predictor of disease activity and steatosis levels. However, Sugimoto et al. [17] showed that dispersion slope was a good predictor of the inflammation grade.
What are the reasons for this discrepancy? Two possibilities should be considered. The first possibility is that the patient populations of the former two studies (Deffieux et al. [14] and Chen et al. [16]) were more inhomogeneous (i.e., of more varied etiology) than those of the third study (Sugimoto et al. [17]). It is well known that liver stiffness values differ depending on etiology, such as hepatitis C virus infection, hepatitis B virus infection, or NASH, even when the fibrosis stage is the same [18]. In contrast, the study of Sugimoto et al. [17] enrolled subjects with only a single etiology (NAFLD), which may have led to different results. The second possibility is that the former two studies (Deffieux et al. [14] and Chen et al. [16]) employed viscoelastic models such as the Voigt model to calculate viscosity. In addition to the Voigt model [11,12], there are other rheological models such as the Maxwell [9] and Zener [10] models. However, to our knowledge, no consensus exists regarding which model is the most suitable for measurements of liver viscoelasticity. Sugimoto et al. [8,17] employed the dispersion slope value, which is a physical quantity that is not based on a rheological model. The fact that this quantity is not dependent on the model employed may also have led to different results. Given the above considerations, it will be necessary to investigate whether there are any discrepancies between the dispersion slope values obtained using these models (the Voigt, Maxwell, and Zener models) in future studies involving large, homogeneous clinical series.
Technical Considerations and Potential Pitfalls
Due to the absence of guidelines in the literature for ensuring proper SWD measurements, recommended 2D-SWE methods [19] should be employed because proper SW speed measurement is also required for dispersion slope measurement. The basic methods of obtaining dispersion measurements based on SW speed measurements are described below.
The patient is placed in the supine or slight left lateral decubitus position. The right arm is raised above the head to expand the intercostal acoustic window. The transducer is placed in an intercostal location. The B-mode image is optimized for the best acoustic window as well as the best color gain setting. The transducer is placed perpendicular to the liver capsule to avoid refraction of the acoustic radiation force impulse. The measurement is made while the patient is holding his or her breath. This lasts only a few seconds, and the patient should avoid deep inspiration/expiration or the Valsalva maneuver, which can affect stiffness measurements [20]. A region of interest (ROI) is placed 1.0-1.5 cm below the Glisson capsule to avoid reverberation artifacts and increased subcapsular stiffness. Within the ROI (we usually use an ROI of 3×3 cm), a single circular ROI for the measurement (we usually use an ROI with a diameter of 1.0 cm) is placed manually to avoid color drop-out, color hot spots, and blood vessels within the reference propagation map (Fig. 6). Color drop-out is defined as a low-dispersion spot-like area seen in a relatively homogeneous SW box, and a color hot spot is defined as a high-dispersion spot-like area seen in a relatively homogeneous SW box. We have no specific recommendations regarding the size of the measurement ROI, but we prefer to use a relatively small ROI (1.0 cm in diameter) because it makes it easier to avoid the above artifacts. Further research is required to determine which measurements yield optimal accuracy.

Pitfall on dispersion slope measurements.
Dispersion slope values vary according to the location of the region of interest. Color hotspots should be avoided to ensure accurate dispersion measurements.
Although 10 SWE measurements are recommended [19], in some studies employing 2D-SWE, the investigators suggested that a smaller number of measurements may provide a comparable degree of accuracy [21]; however, no reports have presented guidance on the optimal number of measurements for dispersion measurements. For the time being, the recommendation of 10 SWD measurements should be followed. Furthermore, there are no quality criteria for dispersion slope measurements, and the IQR of SW speed should be used as an alternative to assess the quality of the data. The IQR is a measure of statistical dispersion equivalent to the difference between the upper and lower quartiles. IQR/median values of less than 0.30 for kPa measurements and 0.15 for m/sec measurements suggest that a dataset may be acceptable [19] and may also be suitable for dispersion measurement.
Conclusion
Our preclinical and preliminary clinical studies have shown that SW speed is more useful than dispersion slope for predicting the degree of fibrosis and that dispersion slope is more useful than SW speed for predicting the degree of necroinflammation. Thus, dispersion slope, which reflects viscosity, may provide additional pathophysiological insight into diffuse liver disease.
Notes
Author Contributions
Conceptualization: Sugimoto K, Moriyasu F, Itoi T. Data acquisition: Takeuchi H, Yoshimasu Y, Kasai Y. Data analysis or interpretation: Sugimoto K, Oshiro H. Drafting of the manuscript: Sugimoto K. Approval of the final version of the manuscript: all authors.
No potential conflict of interest relevant to this article was reported.