Automated versus handheld breast ultrasound examinations of suspicious breast masses: methodological errors in the reliability analysis
Article information

I was interested to read the recently published article by Yun et al. in the July 2019 issue of Ultrasonography [1]. The purpose of the authors was to assess the reliability of automated breast ultrasound (ABUS) examinations of suspicious breast masses in comparison to handheld breast ultrasound (HHUS) with regard to Breast Imaging Reporting and Data System (BI-RADS) category assessment, and to investigate the factors affecting discrepancies in categorization. A total of 135 masses that were assessed as BI-RADS categories 4 and 5 on ABUS and underwent ultrasound-guided core needle biopsy from May 2017 to December 2017 were included in this study. The BIRADS categories were re-assessed using HHUS. Agreement of the BI-RADS categories was evaluated using kappa statistics, and the positive predictive value of each examination was calculated. They reported that the overall agreement between ABUS and HHUS in all cases was good (79.3%, kappa=0.61, P<0.001).
The authors concluded that the agreement between ABUS and HHUS examinations in the BI-RADS categorization of suspicious breast masses was good.
It is crucial to understand that for assessing the reliability of a qualitative variable, applying kappa statistics is not always appropriate. First, the use of kappa statistics depends on the prevalence in each category. Table 1 shows that in both situations (a) and (b), the prevalence of concordant cells is 90% and that of discordant cells is 10%; however, we get a different kappa value in each situation (0.44, interpreted as moderate, and 0.81, interpreted as very good, respectively). Second, whether it is appropriate to use kappa statistics also depends on the number of categories [2-7]. When a variable with more than two categories or an ordinal scale is used (with 3 or more ordered categories), then the weighted kappa would be a good choice (Table 2). Finally, another important flaw occurs when the two raters have unequal marginal distributions of their responses.
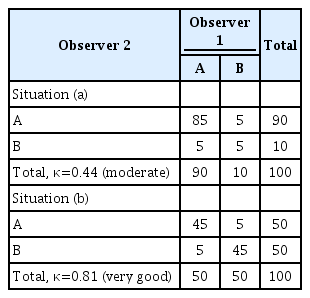
Limitation of the Cohen kappa for assessing reliability in two observers with different prevalence values for two categories
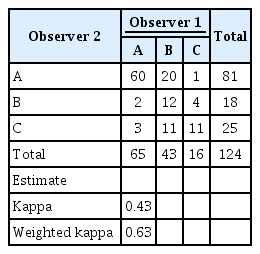
The kappa and weighted kappa values for calculating agreement between two observers for more than two categories
It is vitally important to recognize that reliability (precision, repeatability) and validity (accuracy) are completely different methodological issues. Positive predictive value is an estimate used to assess validity and has nothing to do with reliability. Other well-known estimates are sensitivity, specificity, negative predictive value, the positive likelihood ratio (ranging from 1 to infinity; the higher the positive likelihood ratio, the more accurate the test), and the negative likelihood ratio (ranging from 0 to 1; the lower the negative likelihood ratio, the more accurate the test) [8-10].
In this letter, I discussed some important limitations of applying kappa statistics to assess reliability. Any conclusion regarding reliability needs to be supported in light of the methodological and statistical issues mentioned above. Otherwise, misinterpretations are inevitable.
Notes
No potential conflict of interest relevant to this article was reported.