Impact of respiratory motion on liver stiffness measurements according to different shear wave elastography techniques and region of interest methods: a phantom study
Article information

Abstract
Purpose
This study quantified the impact of respiratory motion on liver stiffness measurements according to different shear wave elastography (SWE) techniques and region of interest (ROI) methods, using liver fibrosis phantoms.
Methods
Three operators measured stiffness values in four phantoms with different stiffness on a moving platform with two SWE techniques (point-SWE [pSWE] and 2-dimensional SWE [2D-SWE]), three types of motion (static mode and moving mode at low and high speeds), and four ROI methods in 2D-SWE (circle, point, box, and multiple). The circular ROI method was used to compare the two SWE techniques. The occurrence of technical failure and unreliable measurements, stiffness values, and measurement time were evaluated.
Results
Technical failure was observed only in moving mode for pSWE and 2D-SWE (n=1 for both). Unreliable measurements were also only observed in moving mode and were significantly less common in 2D-SWE (n=1) than in pSWE (n=12) (P<0.001). No statistically significant differences in the technical failure rate or stiffness values were noted between the static and moving modes for both SWE techniques. The technical failure and unreliable measurement rates were not significantly different among the ROI methods for 2D-SWE. Stiffness values did not differ significantly according to the ROI method used in any moving mode. However, the multiple ROI method had significantly shorter measurement times than the circular ROI method for all moving modes.
Conclusion
2D-SWE may be preferable for evaluating liver fibrosis in patients with poor breath-hold. Furthermore, 2D-SWE with multiple ROIs enables rapid measurements, without affecting liver stiffness values.
Introduction
Ultrasound (US) elastography is widely used to evaluate hepatic fibrosis due to its easy accessibility and high diagnostic performance [1,2]. Currently, various US elastography techniques exist, including transient elastography (TE), point shear wave elastography (pSWE), and 2-dimensional shear wave elastography (2D-SWE) [2]. Although TE has been widely validated [3-5], pSWE and 2D-SWE have the advantage of being equipped with conventional US machines that allow appropriate positioning of the measurement box or the region of interest (ROI) [6]. In addition, pSWE and 2D-SWE offer a larger area than TE for liver stiffness measurements. The recently introduced 2D-SWE technique provides a sample area of up to 6 cm×5 cm, allowing multiple ROI measurements within a box in diverse forms (e.g., circular ROIs, point ROIs, and ROIs encompassing the entire box).
However, liver stiffness measurements are affected by the SWE technique, transducer, and patient-related factors such as respiratory status and food intake [1,5]. The Society of Radiologists in Ultrasound recommends a shallow breath-hold during liver stiffness measurements [1]. Nonetheless, some patients, such as pediatric and elderly patients, as well as those with cardiac or respiratory disease, might not be able to hold their breath sufficiently. Thus, 2D-SWE might be more prone to motion-induced inaccuracies than TE or pSWE because it samples a larger area. The effect of motion on liver stiffness measurements using these techniques has rarely been investigated [7].
In addition, until the recent development of 2D-SWE, which provides various options for ROI shape, most SWE techniques only utilized circular ROIs [8]. No studies have assessed whether multiple ROIs or ROIs of other shapes (e.g., point and box) could be viable replacements for the single-circle ROI in an elastographic box.
Therefore, this study aimed to measure the impact of respiratory motion on liver stiffness measurements according to different SWE techniques and ROI methods, using liver fibrosis phantoms.
Materials and Methods
Liver Fibrosis Phantoms
We used four non-standardized commercial polymer gel phantoms (phantoms #1-4), contained in a 14-cm-tall cylinder (Computerized Imaging Reference System Company, Norfolk, VA, USA) with different stiffness values. Their stiffness values measured with TE were 3.6, 16.1, 16.7, and 18.4 kPa, respectively [9].
Construction of the Moving Platform
To mimic various breathing conditions of patients, we used an automatic electric cradle (730×530×500 mm platform, Youarang Swing Bed, YJ-1000, Youarang Co. Ltd., Namyangjoo, Korea) with three moving modes: static mode, a low-speed (2 cm/s) moving mode, and a high-speed (4 cm/s) moving mode. The phantom was placed in an upright position on the cradle, which underwent a constant back-and-forth pendulum movement perpendicular to the direction of the US beam, at a consistent speed during the stiffness measurements. The US probe was placed in the middle of the surface of the phantom, horizontal to the direction of the movement of the automatic electric cradle, which was not fixed to the phantom and could slide on the surface of the phantom when moving (Fig. 1).
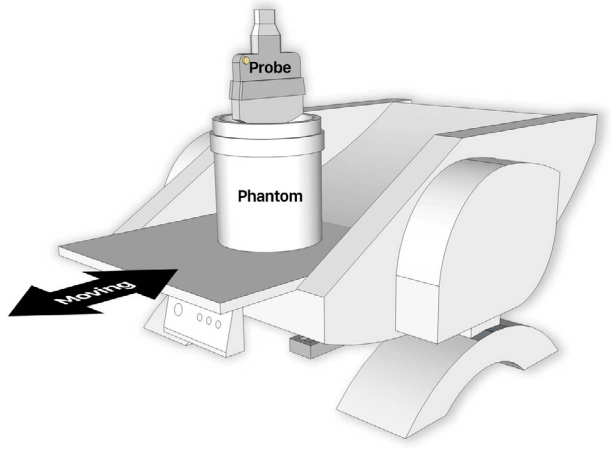
Illustration of the phantom on the moving platform.
To reflect various degrees of respiratory motion, each liver fibrosis phantom was placed on a moving platform with three moving modes (static mode and moving mode at low speed and high speed).
Stiffness Value Measurements
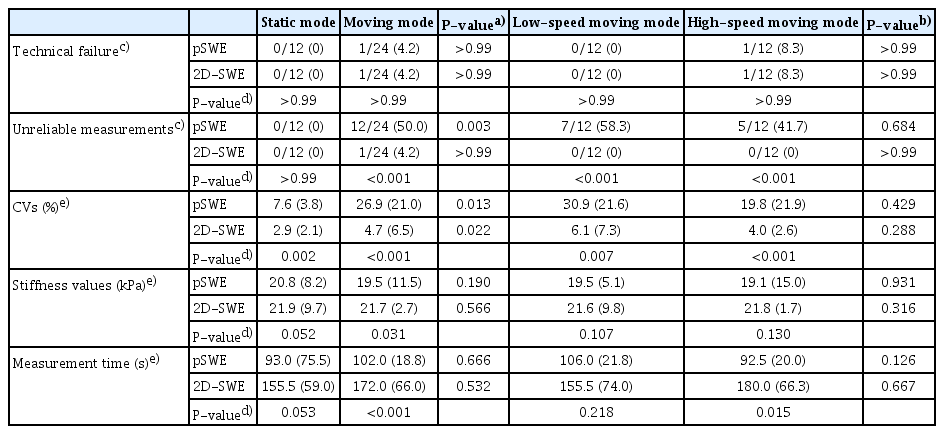
Both pSWE (ElastPQ) and 2D-SWE (ElastQ Imaging) were performed using a single scanner (EPIQ 7G, Philips Healthcare, Cleveland, OH, USA) and a convex probe (C5-1 probe). Three board-certified radiologists (S.M.L., H.I.H., and M.J.K., with more than 10, 14, and 18 years of experience in US, respectively) measured the stiffness values of the four phantoms placed on a moving platform with three different moving modes, using both pSWE and 2D-SWE techniques with caution to avoid excessive pressure (Table 1). To assess intraobserver agreement, one of the operators (S.M.L.) repeated the liver stiffness measurements after repositioning the phantom at a 24-hour interval. For both pSWE and 2D-SWE, the values were measured at least 10 times and the median value was analyzed. Details on pSWE and 2D-SWE acquisition and ROI measurements are given below.

Study design
pSWE
For pSWE, a fixed (1.5 cm×0.5 cm) trapezoidal ROI was used. We measured stiffness with the center of the ROI placed 4 cm below the surface of the phantom, and tried to keep the location constant while acquiring the 10 valid stiffness values (Fig. 2A).
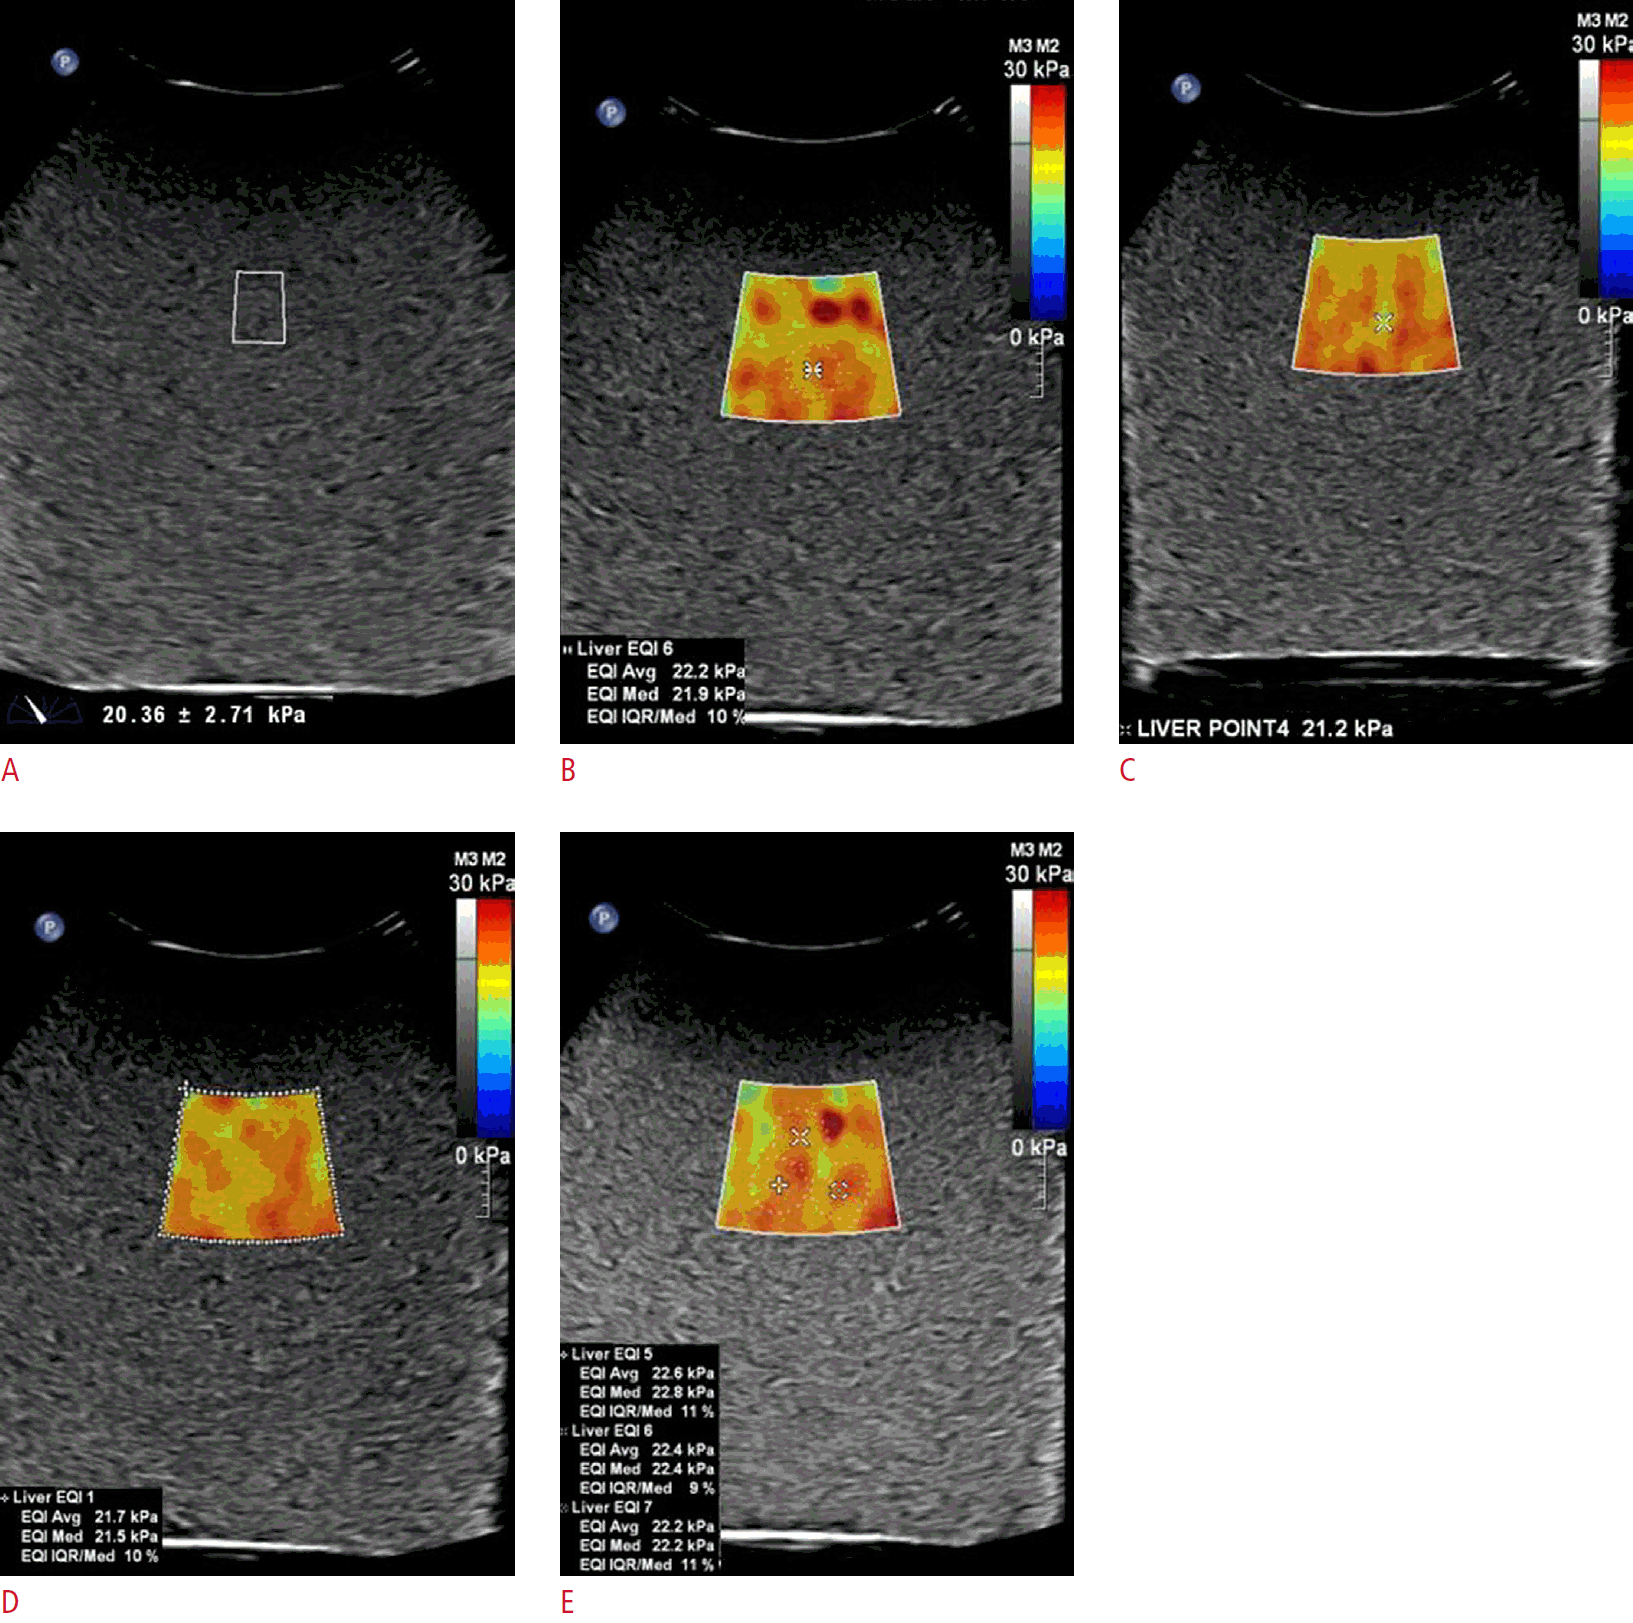
Stiffness value measurements using point shear wave elastography (pSWE) (A) and 2-dimensional shear wave elastography (2D-SWE) (B-E).
The figures show pSWE (A) and the four methods of obtaining a region of interest (ROI) in 2D-SWE (B-E) performed on phantom 2. The four ROI methods in 2D-SWE included a circular ROI (B), a point ROI (C), a box ROI (D),and multiple ROIs (E).
2D-SWE
The center of the elastographic box of 2D-SWE was placed 4 cm below the surface of the phantom. Of the multiple cine loops of the elastographic map, the third loop was selected for stiffness value measurements because the color indicative of the values was consistent in the third and subsequent color boxes. Stiffness values were measured using the following four ROI methods as follows: (1) a single circular ROI (1.0 cm×1.0 cm) (Fig. 2B); (2) a single-point ROI measuring a single-point spot (Fig. 2C); (3) a box ROI measuring the entire sampling area (box) (in which the average stiffness value of the selected region of the colored elastographic box [3 cm×3 cm] was measured with a single click) (Fig. 2D); and (4) multiple ROIs, with multiple (≥2) circular ROIs placed in the elastographic box (Fig. 2E). The ROI method involving a single circular ROI in the elastographic box was used to compare pSWE and 2D-SWE. The other ROI methods were only used for evaluating the impact of ROI measurements made using 2D-SWE.
Evaluation of Technical Failure and Reliability
Technical failure was defined as the inability to obtain 10 valid stiffness measurements after 15 attempts with pSWE and the inability to obtain sufficient colored maps (>50%) in 10 2D-SWE acquisitions [10,11]. Reliability was defined as measurement consistency [12]. A measurement was considered unreliable if it was >30% beyond the ratio of the interquartile range (IQR) to the median of 10 valid stiffness measurement values [1]. Both intraobserver and interobserver agreement were assessed. For repeatability, the coefficient of variation (CV) was calculated as the standard deviation divided by the mean of stiffness and expressed as a percentage [9,13], with a lower CV indicating higher repeatability. The median value of 10 valid liver stiffness measurements was considered as the representative value [14]. The measurement time required to acquire 10 valid stiffness values was recorded. When measuring stiffness values using 2D-SWE with three ROI methods (single circle, single point, and single box), one stiffness value was obtained from one elastographic box. In contrast, when measuring stiffness values using 2D-SWE with multiple circular ROIs, two or three stiffness values were obtained from one elastographic box; therefore, 10 valid stiffness values were obtained from four elastographic boxes.
Statistical Analysis
Statistical analyses were performed using commercial software (version 19.0.3, MedCalc, MedCalc Software, Mariakerke, Belgium). The Fisher exact test or chi-square test was used to compare categorical values (e.g., technical failure, unreliable measurements). For continuous values (e.g., CV, stiffness values, measurement time), normality was assessed using the Kolmogorov-Smirnov test. Since the hypothesis of normality was rejected for these variables, continuous values were presented as median values with IQR. The Mann-Whitney test was used to compare stiffness values and measurement times between pairs of groups (e.g., pSWE and 2D-SWE) and the Kruskal-Wallis test was used to compare the same factors among three or more groups (e.g., the four different ROI methods of 2D-SWE). The intraclass correlation coefficient (ICC) was used to evaluate intraobserver or interobserver agreement. A P-value <0.05 was regarded as indicating statistical significance. The Bonferroni correction was performed for post hoc analysis in multiple pairwise comparisons.
Results
Impact of SWE Techniques on Technical Failure, Reliability, Stiffness Values, and Measurement Time in the Static Mode
A total of 24 measurements were taken with pSWE (n=12) and 2D-SWE (n=12) in the static mode. No technical failure or unreliable measurements were observed with either pSWE or 2D-SWE for the phantoms placed on the static platform (Table 2). The ICCs for intraobserver and interobserver agreement were excellent (0.997 and 0.993 for pSWE, respectively, and 0.999 and 0.998 for 2D-SWE, respectively). However, the CV obtained using 2D-SWE was significantly lower than that obtained using pSWE (2.9% vs. 7.6%, P=0.002). The stiffness value was not significantly different between pSWE and 2D-SWE (20.8 kPa vs. 21.9 kPa, P=0.052). For each phantom, the stiffness values did not differ significantly between pSWE and 2D-SWE (P≥0.05 for all). The 95% Bland-Altman limit of agreement between the stiffness values obtained by pSWE and 2D-SWE was -1.0 of the mean. The measurement time was slightly longer with 2D-SWE than pSWE, but this difference did not reach statistical significance (155.5 seconds vs. 93.0 seconds, P=0.053).
Impact of motion on technical failure, reliability, stiffness values, and measurement time of pSWE and 2D-SWE
Impact of Motion on Technical Failure, Reliability, Stiffness Values, and Measurement Time of pSWE and 2D-SWE
In the moving mode, 48 measurements were performed (24 measurements with pSWE [n=12] and 2D-SWE [n=12] at low speed and 24 measurements with pSWE [n=12] and 2D-SWE [n=12] at high speed). In the moving mode, there was one technical failure for both pSWE (4.2% [1 of 24]) and 2D-SWE (4.2% [1 of 24]). However, no significant difference was found in the technical failure rate between the static and moving modes (0% [0 of 12] vs. 4.2% [1 of 24], P>0.99 for pSWE and 0% [0 of 12] vs. 4.2% [1 of 24], P>0.99 for 2D-SWE). The unreliable measurement rate was significantly higher in the moving mode than in the static mode for pSWE (50.0% [12 of 24] vs. 0% [0 of 12], P=0.003), whereas this was not the case for 2D-SWE (0% [0 of 12] in the static mode vs. 4.2% [1 of 24] in the moving mode, P>0.99). Therefore, pSWE showed a significantly higher unreliable measurement rate in the moving mode than 2D-SWE (50.0% [12 of 24] vs. 4.2% [1 of 24], P<0.001). The ICCs for intraobserver and interobserver agreement were also excellent in the moving mode for both pSWE (0.992 and 0.957, respectively) and 2D-SWE (0.954 and 0.934, respectively). The CV was significantly greater in the moving mode than in the static mode (P=0.013 for pSWE and P=0.022 for 2D-SWE). There was a significant difference in the CV between pSWE and 2D-SWE in the moving mode (26.9% vs. 4.7%, P<0.001) (Fig. 3A). However, no significant difference was found in stiffness values between the static and moving modes at low and high speed in pSWE (P=0.190) and 2D-SWE (P=0.566). In the moving mode, the stiffness value was significantly lower in pSWE than in 2D-SWE (P=0.031) (Fig. 3B). No significant difference was found in the measurement time between the static and moving modes at low and high speed in pSWE (P=0.666) and 2D-SWE (P=0.532). In the moving mode, the measurement time was significantly longer with 2D-SWE than with pSWE (P<0.001) (Fig. 3C).
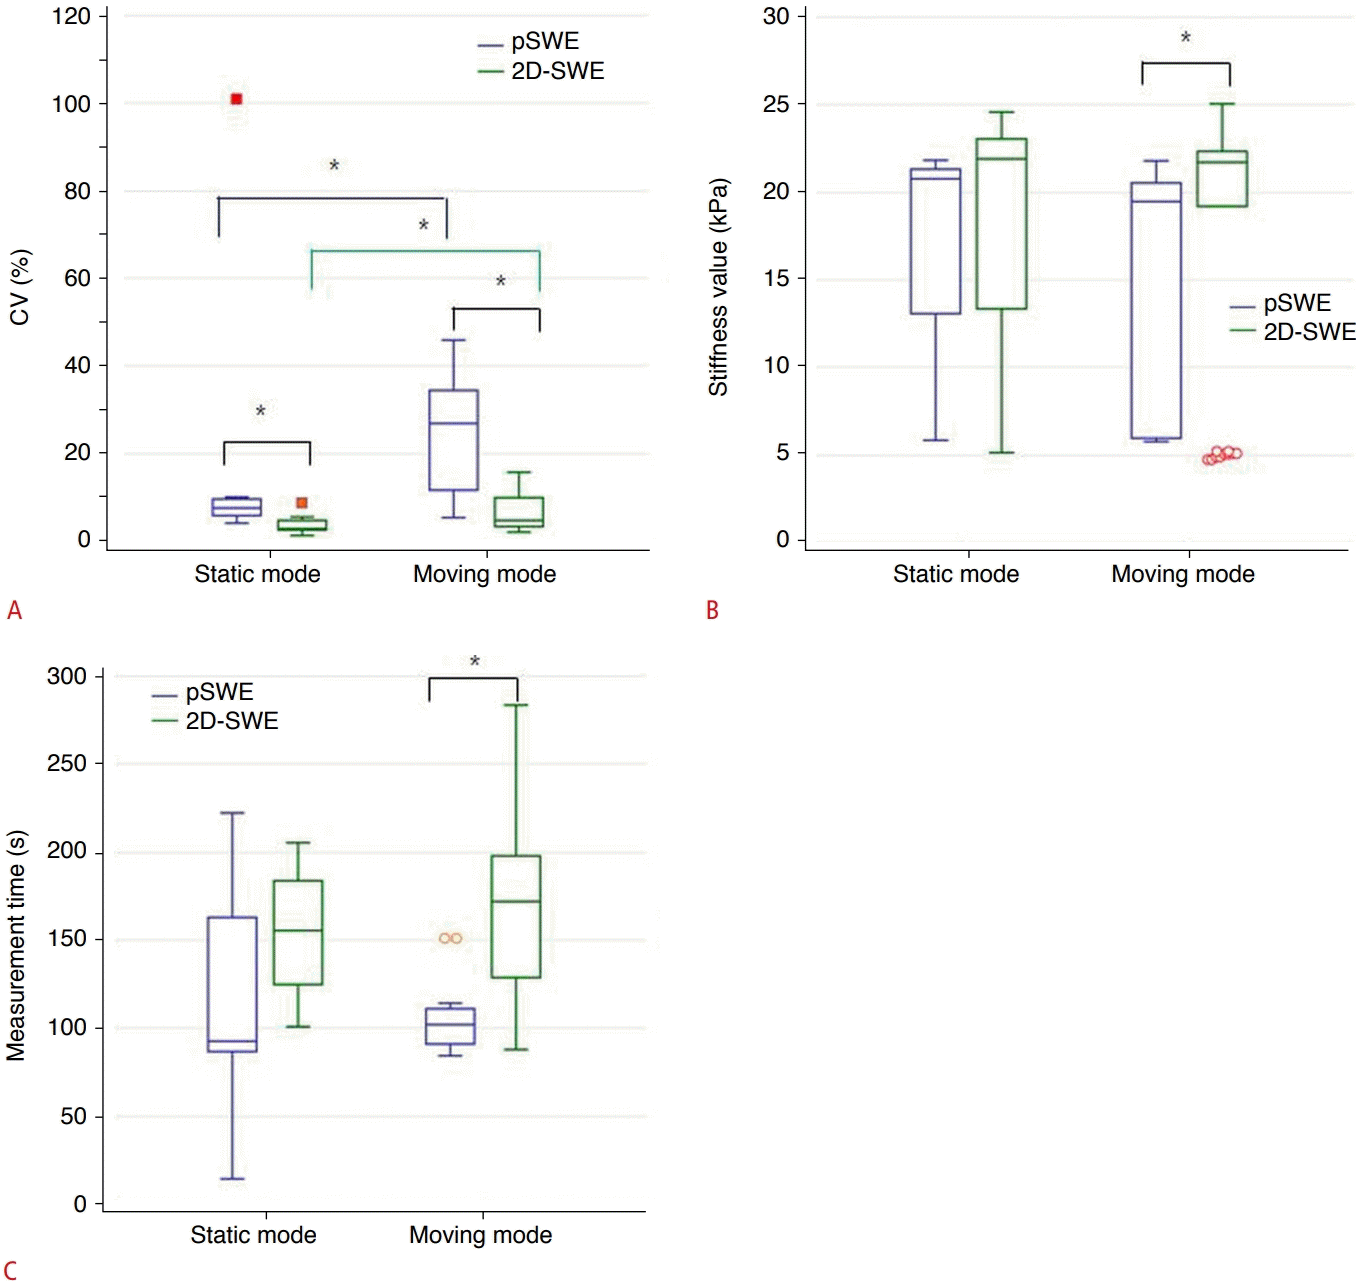
Impact of motion on point shear wave elastography (pSWE) and 2-dimensional shear wave elastography (2D-SWE) measurements of stiffness values.
Graphs of moving modes and coefficient of variation (CV) (A), stiffness values (B), and measurement time (C) for each shear wave elastography technique. *Statistical significance.
Regarding the impact of movement speed, technical failures were observed only on the high-speed moving platform, but no significant difference was found between the low- and high-speed platform in either pSWE or 2D-SWE (0% [0 of 12] vs. 8.3% [1 of 12], P>0.99 for pSWE and 0% [0 of 12] vs. 8.3% [1 of 12], P>0.99 for 2D-SWE). The unreliable measurement rate showed no significant difference between high and low speeds in pSWE (58.3% [7 of 12] vs. 41.7% [5 of 12], P=0.684) and 2D-SWE (0% [0 of 12] vs. 0% [0 of 12], P>0.99). In reliable measurements made using both pSWE and 2D-SWE, the CV, stiffness values, and measurement time did not show a significant association with the movement speed of the platform.
The impact of differences in the stiffness values of the phantoms is summarized in Table 3. No significant differences were observed in the technical failure rate, unreliable measurement rate, CV, or measurement time according to the phantoms with different stiffness values in either pSWE or 2D-SWE in any of the moving modes. In each phantom, no statistically significant differences were observed in the technical failure rate, unreliable measurement rate, CV, stiffness values, or measurement time according to the moving mode in either pSWE or 2D-SWE.
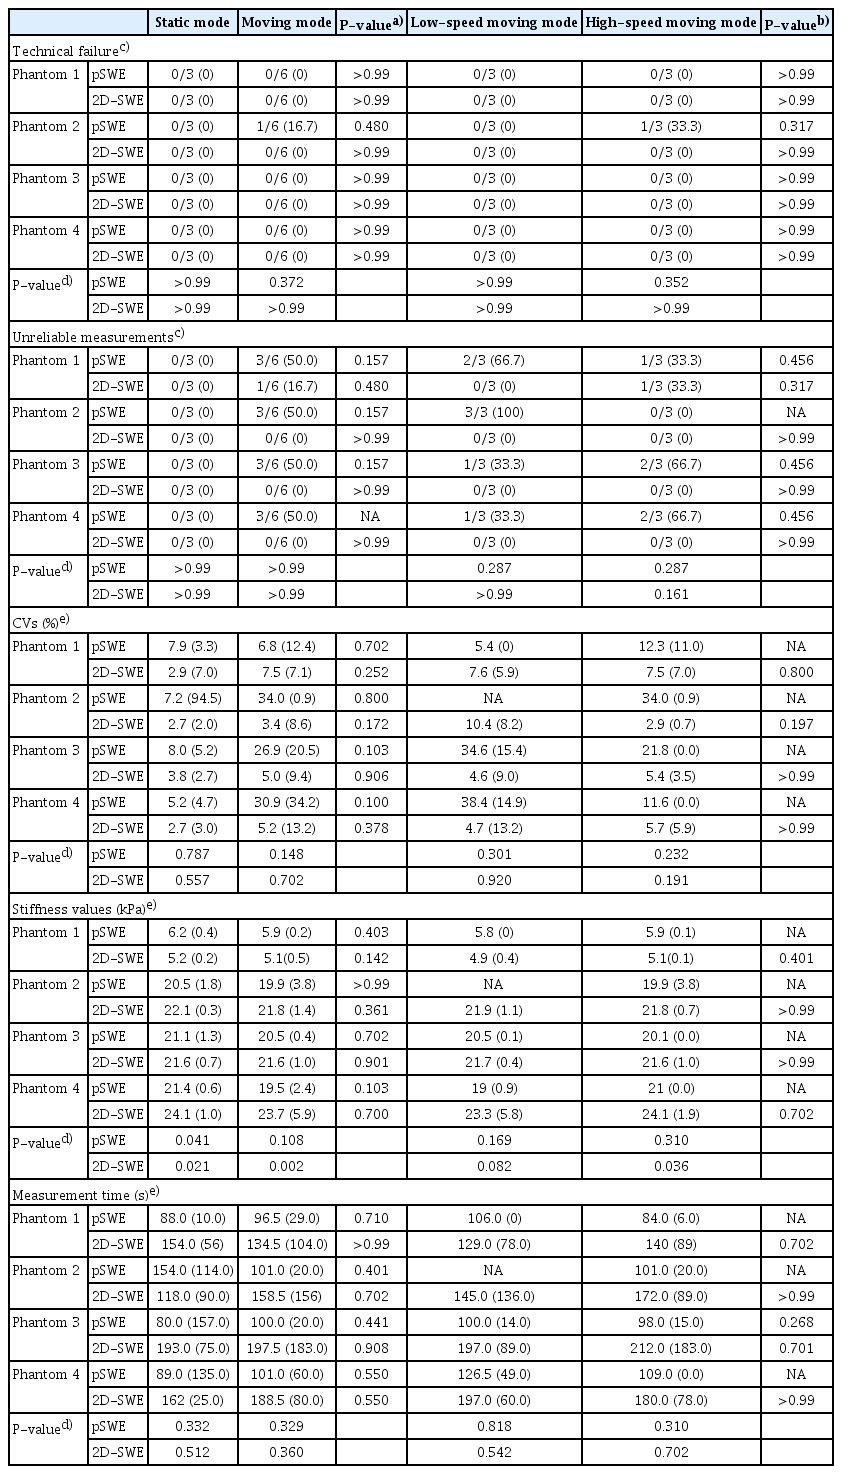
Impact of motion on technical failure, reliability, stiffness values, and measurement time of four phantoms with different stiffness values
Impact of ROI Methods of 2D-SWE on Technical Failure, Reliability, Stiffness Values, and Measurement Time
All four ROI measuring methods (circular ROI, point ROI, box ROI, and multiple ROIs) of 2D-SWE showed no technical failure or unreliable measurements, except for a single unreliable measurement observed with a circular ROI on the moving platform at high speed (Table 4). The ICCs for intraobserver and interobserver agreement were excellent for the circular ROI, point ROI, box ROI, and multiple ROIs of 2D-SWE (0.989 and 0.994, 0.995 and 0.998, 0.995 and 0.996, 0.988 and 0.998, respectively).
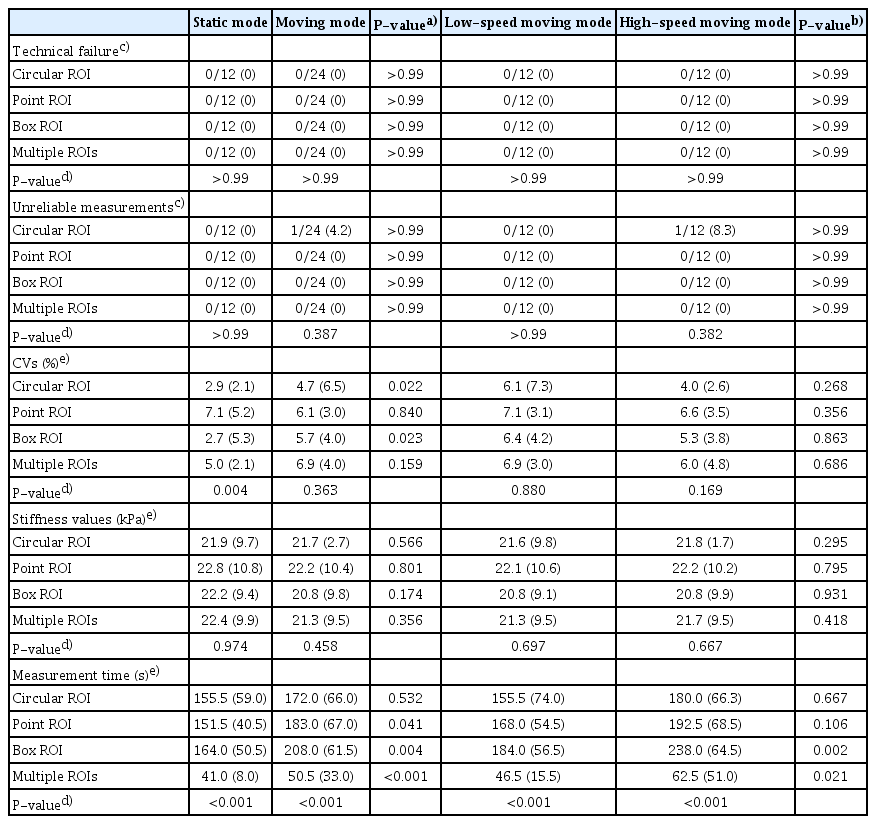
Impact of motion on technical failure, reliability, stiffness values, and measurement time of four ROI methods in 2D-SWE
The CVs were significantly different among the four ROI methods in the static mode (P=0.004). Post hoc analysis showed that the CV of the point ROI method (7.1%) was significantly higher than that of the circular ROI method (2.9%, P=0.001) (Table 5). The CVs of the other ROI methods (box ROI and multiple ROIs) were not significantly different from that of the circular ROI method (Fig. 4A). Median stiffness values showed no significant difference according to the four ROI methods in 2D-SWE in the static mode (P=0.974) (Fig. 4B). Measurement time showed a considerable difference among the four ROI methods in 2D-SWE (P<0.001) (Fig. 4C). In a post hoc analysis, the measurement time with multiple ROIs was significantly shorter than that with the circular ROI (41.0 seconds vs. 155.5 seconds, P<0.001). The measurement times of other ROI methods (point ROI and box ROI) did not differ significantly from that of the circular ROI method.

Post hoc analysis of CVs and measurement time among four ROI methods in 2D-SWE

Impact of motion in various region of interest (ROI) methods for 2-dimensional shear wave elastography on stiffness value measurements.
Graphs of the moving modes and coefficient of variation (CV) (A), stiffness values (B), and measurement time (C) in each ROI method. *Statistical significance.
The impact of the moving mode and movement speed are summarized in Table 4. The stiffness values did not differ significantly according to the ROI method in any moving mode. The multiple ROI method had significantly shorter measurement times than the circular ROI method in all moving modes (Table 5).
Discussion
In our study, we investigated whether motion affected technical success, reliability, or stiffness values using two different SWE techniques. Our results showed that pSWE had a significantly higher rate of unreliable measurements and a greater CV for liver stiffness in the moving mode than in the static mode. For 2D-SWE, however, there was no significant difference in the unreliable measurement rate between the static mode and the moving mode. The 2D-SWE technique showed a significantly greater CV in the moving mode (4.7%) than in the static mode (2.9%), but the CVs for 2D-SWE were much lower than those for pSWE in all modes (static mode, 7.6%; moving mode, 26.9%). The stiffness values and measurement times were not significantly different between the static and moving modes for both SWE techniques.
The current clinical practice guideline on SWE recommends a shallow breath-hold during liver stiffness measurements [1]. Studies on liver stiffness measurements with free breathing are lacking. A study on liver stiffness measurements using 2D-SWE in pediatric patients with free breathing demonstrated no technical failure; however, it did not prove that the liver stiffness values were similar between free-breathing and static conditions or that the values were closely correlated with the pathological staging of liver fibrosis [15]. Our study, in contrast, demonstrated no difference in stiffness values and measurement times between the static and moving modes with both pSWE and 2D-SWE, although unreliable measurements were more frequent in the moving mode, especially for pSWE, and repeatability decreased in the moving mode for both pSWE and 2D-SWE. Based on our observations, we cautiously suggest that stiffness measurements may be feasible in the free-breathing state. The resultant liver stiffness values would be reliable in the absence of technical failure or unreliable measurements.
It is not clear why 2D-SWE is less affected by motion than pSWE in terms of unreliable measurements and repeatability. However, this tendency might be associated with the fact that the 2D-SWE system used in our study provided a larger elastographic box with multiple cine loops using multiple beams, whereas pSWE provided a smaller, single-shot elastographic box with a single push beam. Moreover, the results are consistent with those of a previous study using two phantoms with elasticities of 3 and 16.9 kPa on an orbital shaker with different directions of motion, in which technical failure was more frequent in acoustic radiation force impulse elastography than in supersonic image elastography [7]. The CV was also much lower in 2D-SWE than pSWE in the moving mode, indicating higher repeatability. These results suggested that 2D-SWE may be preferable over pSWE for measurements of liver stiffness in patients with poor respiratory control (e.g., pediatric patients or patients with respiratory or heart problems).
The ability to place multiple ROIs within an elastographic box has been available for some 2D-SWE systems, but no previous evidence was available to indicate that liver stiffness measurements with multiple ROIs differed from those obtained using the conventional single-circle ROI. However, we showed that using multiple ROIs, as compared to the single-circle ROI, can significantly reduce measurement time without changing the stiffness values. Therefore, the multiple ROI method can be applied when measuring stiffness values under the assumption that an optimal elastographic map (i.e., a homogeneous and fully saturated color map) is obtained. In addition, the point ROI method (a unique ROI method in the ElastQ Imaging system) did not affect the stiffness values compared to the conventional ROI method. However, the point ROI method may enable straightforward measurements of stiffness even in organs smaller than the liver (e.g., the kidney or pancreas). To our knowledge, our study is the first to provide evidence for liver stiffness measurements in a free-breathing state with the use of multiple ROIs in 2D-SWE.
Our study has several limitations. First, we used four phantoms with different stiffness values. The stiffness values were not the absolute values provided by the manufacturer, but were measured using TE. Although TE is the most widely validated tool for measuring stiffness values, the values measured with TE are not the real stiffness values. Second, an automatic electric cradle cannot precisely simulate human respiratory motion, as the movement of the cradle is only horizontal, whereas the actual physiological movements of the liver inside a human body are complex and include vertical and cranio-caudal movements with resultant liver deformations [16,17]. Thus, this issue needs to be further studied using in vivo elastography examinations. Lastly, we performed the study with a single scanner, and the results may not be consistent across different scanners.
In conclusion, the reliability of SWE measurements was affected by motion, and pSWE was more strongly affected than 2D-SWE. Thus, 2D-SWE may be more feasible for evaluating liver fibrosis in patients with poor breath-hold. Furthermore, 2D-SWE with multiple ROIs can enable rapid measurements without any change in liver stiffness values. Additional human studies on respiratory motion and the use of ROI methods for SWE to validate the accuracy of liver stiffness measurements, with reference standards, are warranted.
Notes
Author Contributions
Conceptualization: Lee SM. Data acquisition: Lee SM, Kim MJ, Ha HI, Park SJ. Data analysis or interpretation: Lee SM, Yoon JH. Drafting of the manuscript: Lee SM, Lee JH. Critical revision of the manuscript: Kim ES, Lee K, Lee JM. Approval of the final version of the manuscript: all authors.
No potential conflict of interest relevant to this article was reported.
Acknowledgements
The authors would like to thank Professor Junhee Han, Department of Statistics and Institute of Statistics, Hallym University, for his assistance with the statistical analysis.