Ultrasonography and dual-energy computed tomography: impact for the detection of gouty deposits
Article information

Abstract
Ultrasonography (US) and dual-energy computed tomography (DECT) are useful and sensitive diagnostic tools to identify monosodium urate deposits in joints and soft tissues. The purpose of this review is to overview the imaging findings obtained by US and DECT in patients with gout, to understand the strengths and weaknesses of each imaging modality, and to evaluate the added value of using both modalities in combination.
Introduction
With a prevalence of approximately 2% among men and 1% among women in industrialized nations, gout has become a major cause of musculoskeletal pain and arthritis. Its incidence has tripled over recent decades and it is now reported to be the most common form of inflammatory arthritis globally [1,2]. Gout is a form of inflammatory arthritis characterized by the deposition of monosodium urate (MSU) crystals in joints, cartilage, and soft tissues, which can lead to formation of tophi and joint damage [3]. Peripherally located structures such as the great toe and the ears are more commonly involved than the axial skeleton [4]. Structures of the lower limbs are especially frequently affected by gout, which has a predilection for the first metatarsophalangeal (MTP) joint. This is classically described as podagra, and is reported in up to 80% of untreated patients [5]. A recent survey showed that gout presented with single joint involvement in more than 90% of patients, whereas fewer than 1% of patients presented with gout affecting more than 4 joints [6].
Apart from intra-articular deposits, gout frequently affects tendons, where MSU deposits may be intratendinous, peritendinous, or at the enthesis [7-12]. Recently, Dalbeth et al. [13] evaluated the frequency and pattern of tendon and ligament involvement in the foot of tophaceous gout patients by dual-energy computed tomography (DECT). These authors observed that tendon involvement occurred in about 10.8% of cases, with the most affected tendon being the Achilles. Interestingly, MSU crystal deposition occurred both in the tendon substance and at the enthesis more frequently than in isolation at either of these sites [13,14]. The clinical presentation of gout includes recurrent episodes of acute arthritis with a rapid onset of severe pain, swelling and erythema. Gout has a strong association with cardiovascular diseases and hyperuricemia [15].
Demonstrating MSU crystals in the joint fluid or in a tophus by puncture and polarizing microscopy is the gold standard for the diagnosis of gout [16,17]. However, this method is invasive and not always feasible, which has led to the increasing role of ultrasonography (US) and DECT in detecting gout [15,18-23]. Both US and DECT have been included in the 2015 American College of Rheumatology (ACR) classification criteria, along with radiographs, elevated serum urate levels, clinical evidence of tophus, and MSU crystals in synovial fluid analysis [24]. Bongartz et al. [19] showed that DECT has a significant impact on clinical decision-making when gout is suspected. Since a diagnosis of gouty arthritis typically results in therapeutic steps that are markedly distinct from those used to address other types of inflammatory arthritis, failure to detect MSU deposition can result in exposure to unnecessary and ineffective treatment strategies. Alternative tests for the detection of MSU crystals, which could aid clinicians in challenging diagnostic situations, would therefore be desirable. In studies by Dalbeth [15] and Zhang et al. [20], DECT was advocated as an advanced technique for longitudinal follow-up in the monitoring of tophus size regression as a marker of treatment response [25,26]. Furthermore, DECT is very useful for the detection of MSU deposits in structures that cannot be easily aspirated, such as tendons [13].
US has been suggested as the first-line imaging modality of choice for the diagnosis and management of gout [27-29]. High-frequency transducers (12-18 MHz) provide high-resolution imaging with the unique ability to depict tiny amounts of MSU deposits on the cartilage surfaces before larger deposits develop. The advantages and reliability of using both US and DECT in conjunction for the diagnosis of gout will be addressed in this review.
Ultrasonography
On US, MSU deposits can have several different appearances.
Double Contour Sign
The double contour (DC) sign is defined as an abnormal hyperechoic band over the superficial margin of the hypoechoic articular hyaline cartilage, independent of the angle of insonation, which may be homogeneous or inhomogeneous, irregular or regular, and continuous or intermittent. There may be posterior acoustic shadowing, depending on both the amount and density of the MSU deposits. The DC sign can be distinguished from the cartilage interface sign by adjustment of the transducer position. The cartilage interface sign is detectable only when the US beam is perpendicular to the cartilage surface. It appears as a subtle hyperechoic line, which is thinner than the underlying osteochondral interface. This sign should be interpreted with care since posterior acoustic enhancement can be generated by an effusion, which might be present in a joint affected by gout. With the DC sign, the presence of MSU deposits on the cartilage surface generates focal or diffuse hyperechoic enhancement of the superficial margin, which can be detected even when the outer cartilage margin is not insonated perpendicular to the probe (Fig. 1) [30,31]. The thickness of the DC sign should be similar to the cortex; however, in early stages it may be thinner than the cortex.
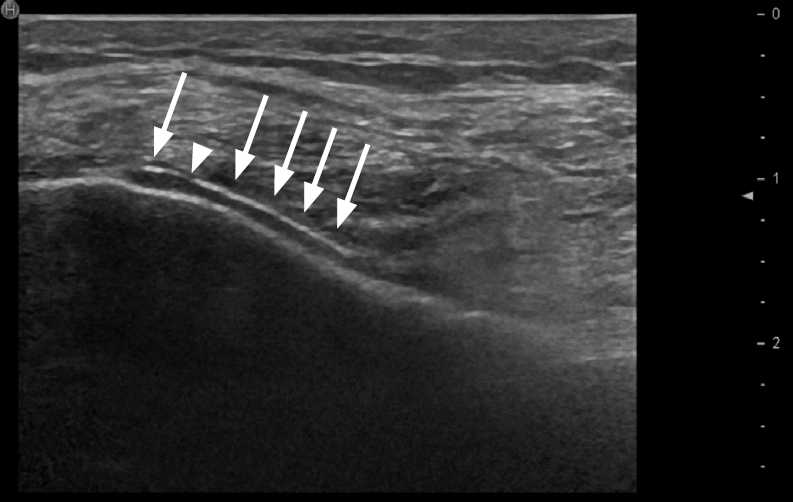
Double contour (DC) sign in an ultrasonography (US) scan of the knee.
Longitudinal US shows a DC sign (arrows) in a patient with gouty arthritis of the knee, with a hyperechoic band over the articular cartilage (hypoechoic) of the medial condyle. Note: The DC sign has the same thickness as the cortical bone, and is continuous apart from a small defect (arrowhead).
Snowstorm Sign and Tophi
MSU crystals may also form aggregates and appear as heterogeneous hyperechoic foci. Larger, dense aggregates develop into hypoechoic to hyperechoic inhomogeneous tophi, which have a cloudy appearance, with a hypoechoic or anechoic rim [25]. De Avila Fernandes et al. [32] reported that chronic tophi are mainly hyperechoic (96.3%). Of these, 37.6% are hyperechoic and heterogeneous and 32.6% are heterogeneous with calcification (Fig. 2A, B). US is unable to differentiate between MSU crystal depositions and calcifications, which can be achieved by DECT. Depending on the density of the MSU aggregates, partial or complete posterior acoustic shadowing, similar to that seen with calcium deposits, can be observed.
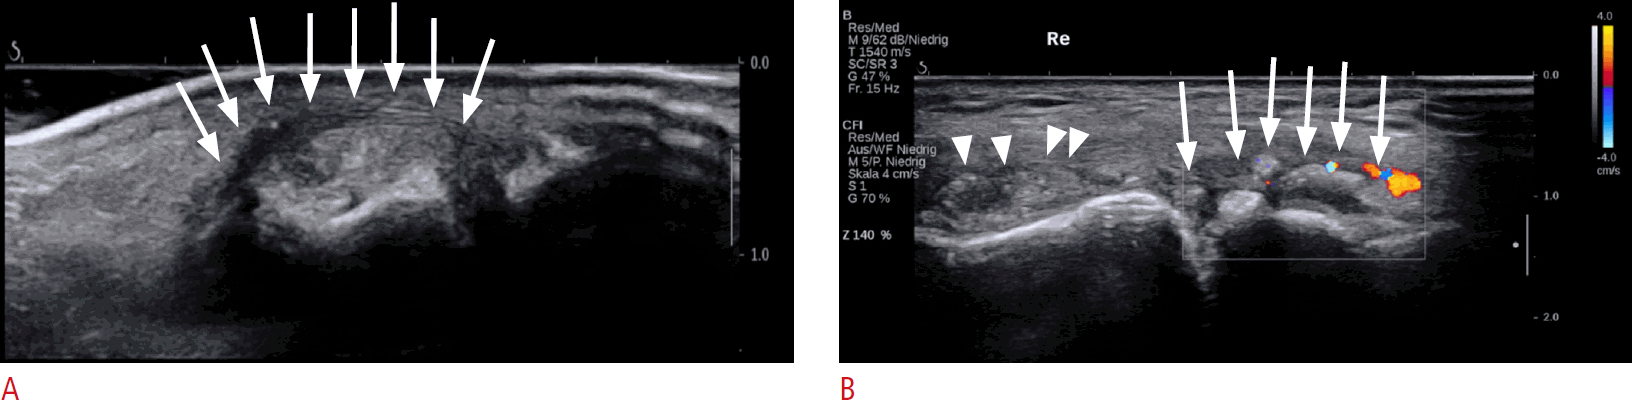
Typical appearance of podagra on ultrasonography (US).
A. Longitudinal US of the first metatarsophalangeal joint (MTP 1) shows a hyperechoic tophus with a surrounding hypoechoic rim (arrows), present in a patient with podagra. B. Longitudinal US of MTP 1 shows a snowstorm appearance (arrowheads) and tophus formation with a surrounding anechoic rim (arrows) with hyperemia.
The snowstorm sign is caused by hyperechoic microtophi within a joint effusion. The differential diagnosis includes debris in an osteoarthritic joint or synovial chondromatosis, which can have a similar appearance to the snowstorm sign, as described by several authors [33-36]. Aggregates and tophi are most useful when seen in conjunction with the DC sign. Standing alone, the findings may be difficult to differentiate from calcium pyrophosphate dihydrate (CPPD) crystal deposition disease. It should be noted that in patients with full-thickness cartilage loss, as seen in advanced osteoarthritis, no DC sign can be observed because of the absent hypoechoic cartilaginous layer.
Erosions
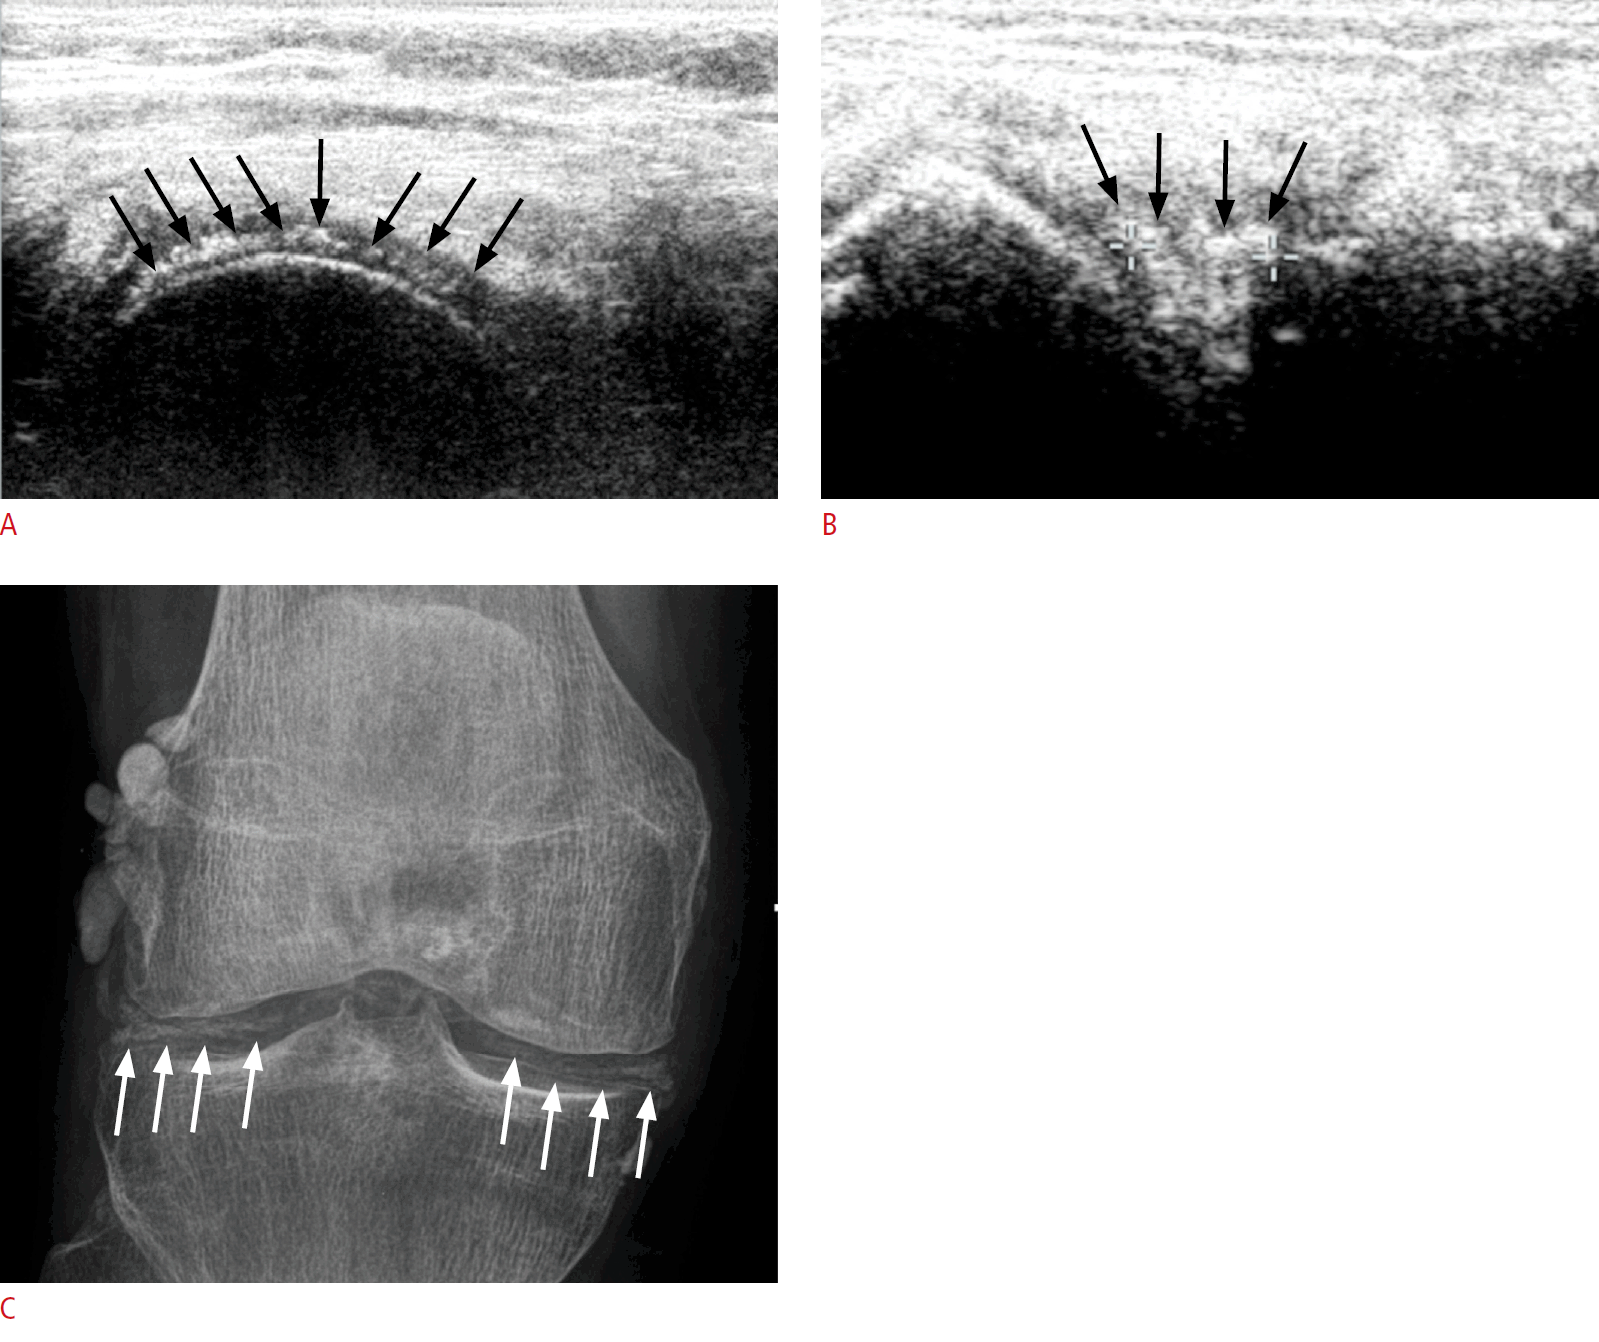
Bony erosions can be seen on high-resolution US and appear as defects in the hyperechoic cortical bone, which are detectable in two perpendicular planes (Fig. 3A). US has been proven to be considerably more sensitive than plain radiographs for detecting erosions in rheumatoid arthritis (RA), as well as in gout [37]. Typically, gouty erosions are irregular, with overhanging margins, and are located at the joint margins, closer to the diaphysis than the erosions of RA. However, DECT gives a more comprehensive overview of intra-articular tophi, periarticular tophi, "empty" old erosions, and erosions filled with MSU deposits (Fig. 3B, C) [38]. In addition, US is also capable of detecting the inflammatory aspects of MSU deposits, including synovitis, tenosynovitis, and soft tissue inflammation, and hence can be used to monitor the efficacy of antiinflammatory therapies [39].

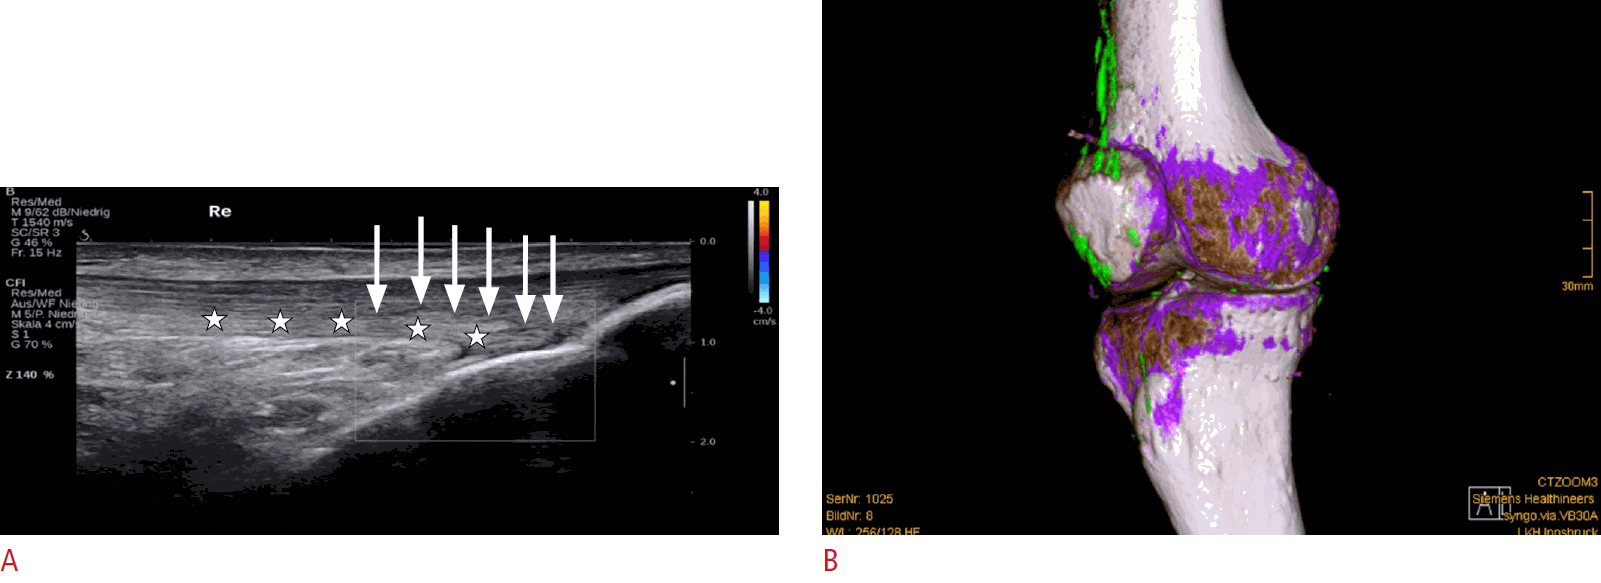
Bone erosion in a patient with podagra.
A. Longitudinal ultrasonography (US) of first metatarsophalangeal joint shows bone erosion (star) of the head of the first metatarsal head in a patient with podagra. Tophus outlined by arrows. B. A corresponding computed tomography scan shows the bone erosion (arrow), as seen on US, but with better delineation of size and intraosseous extent (arrowheads). C. Axial dual-energy computed tomography shows a color-coded green monosodium urate deposit within the erosion. D. The same bone erosion is pictured in a radiographic image (arrows).
Dual-Energy Computed Tomography
Non-contrast DECT has high sensitivity and specificity for detecting MSU deposits in patients with suspected gout when compared to the gold standard of synovial fluid analysis by polarized microscopy. A recent meta-analysis of the accuracy of DECT for gout diagnosis was performed by Lee and Song [40]. In the eight studies analyzed, which included 510 patients and 268 controls, the pooled specificity and sensitivity of DECT were 93.7% and 84.7%, respectively [40,41]. DECT scanning is rapid and noninvasive, and enables multiple joints to be imaged on a single scan without the use of contrast agents [42]. Data are acquired at 80 and 140 kV with a plot of the attenuation of each voxel at 80 kV (y-axis) against attenuation at 140 kV (x-axis). The pixels containing calcium and sodium urate can be separated and presented as a color image for easy identification. Although the color coding can vary across manufacturers, the most common software color codes are green for MSU deposits, lavender for cortical bone, and pink for trabecular bone. These color-coded images are displayed as an overlay on either two-dimensional conventional gray-scale computed tomography images or as three-dimensional volume-rendered images [41] (Fig. 4). DECT can therefore provide color-coded information about the composition of certain materials, including urate, calcium pyrophosphate (CPPD), and hydroxyapatite (HADD). In addition to the visualization of MSU deposits, automated volume assessment tools that allow reliable measurements of urate deposition within a field of interest are available, which may be useful for therapeutic follow-up [43].
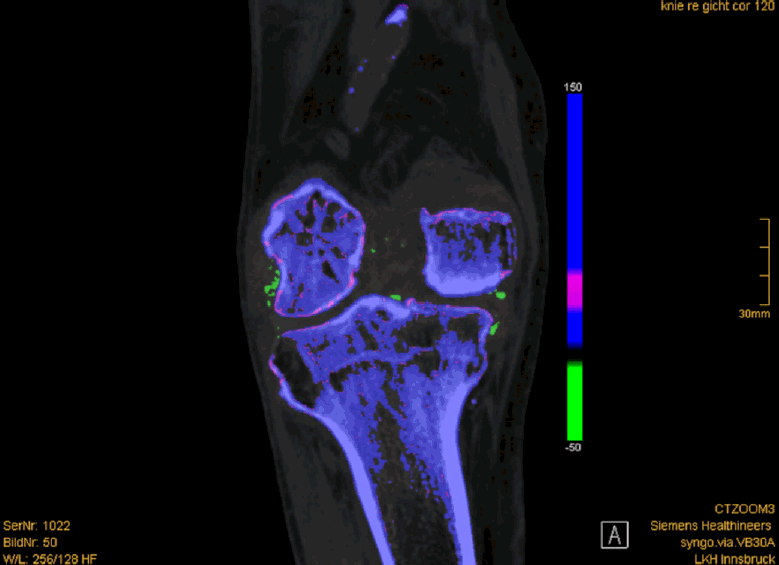
Monosodium urate (MSU) deposit in a dual-energy computed tomography (DECT) of the knee.
Coronal DECT shows color-coded green MSU deposits in the right knee affecting the medial and lateral collateral ligaments, cruciate ligaments, and intracondylar fossa.
According to the ACR/European League Against Rheumatism guidelines, nail bed deposits, sub-millimeter deposits, skin deposits, and deposits obscured by motion, beam hardening, and vascular artifacts should not be classified as positive findings [24]. These artifacts were also described by Mallinson et al. [44], who concluded that the appearance of artifacts was especially dependent on the postprocessing protocols that were used. Park et al. [45] concluded that setting the minimum attenuation to a higher value of 150 Hounsfield units (HU) in their study reduced the frequency of artifacts, and that adding a tin filter to DECT greatly reduced their occurrence. In a study by Hu et al. [46] DECT had a specificity of about 92.7%, resulting in a false positive rate of 7.3%. Therefore the results should be interpreted carefully [46]. Furthermore, the radiation dose is generally low, in the range of 0.1 mSv, depending on the anatomical region and the patient’s body habitus. DECT may also demonstrate cardiovascular MSU deposits, which might have implications for patients who are at risk of cardiovascular disease [47].
US and DECT in Conjunction
In 2014, Sivera et al. [48] conducted a systematic review of clinical, laboratory, and imaging findings in clinically suspected gout patients and showed that clinical features had low diagnostic utility, except for the presence of tophi on physical examination (likelihood ratio [LR], 15.6 to 30.9). US demonstrated a better performance than clinical features when using the DC sign (LR, 13.6). DECT was also found to be superior to clinical examinations (LR, 9.5) [48].
The relative value of US and DECT has been evaluated for gout in the first MTP joint, as well as the knee and the wrist, by comparing two different postprocessing protocols for DECT with US. Seventy-five consecutive patients with podagra (66 men and nine women; mean age, 65.6 years; age range, 33 to 88 years) and 75 control subjects with first MTP joint osteoarthritis (49 men and 26 women; mean age, 63.0 years; age range, 35 to 87 years) prospectively underwent US and DECT of the MTP joint between 2016 and 2018. Two Syngo.via postprocessing DECT protocols were utilized with different minimum attenuation thresholds of 150 HU (DECT 150 protocol) versus 120 HU (DECT 120 protocol). The same maximum attenuation threshold (500 HU) was used with a constant kilovoltage setting at 80 and 140 kV. The conventional postprocessing DECT 150 protocol yielded positive results for tophus detection in 55 of 75 patients (73.3%) with podagra, whereas the postprocessing DECT 120 protocol detected MSU deposits in all 75 patients (100%). Tophus size assessed using the DECT 120 protocol showed a closer correlation with tophus size as detected by US (P<0.01) [49].
In contrast to the excellent accuracy of US in detecting gouty arthritis of the first MTP joint, its accuracy in the knee and the wrist is lower, as these joints are less accessible. A study that compared DECT and US findings in patients with suspected gouty knee arthritis included 65 patients (52 men and 13 women; median age, 61.7 years; range, 38 to 87 years). DECT identified gout as the final diagnosis in 52 of 65 patients (80.0%). US detected gout in 31 of 52 patients (sensitivity, 59.6%) and produced findings negative for gout in seven of 13 patients (specificity, 53.8%). The DC sign on US was positive for gout in 23 of 52 patients (44.2%) and negative in 12 of 13 patients (92.3%).
Similar results were obtained in patients presenting with suspected gouty hand and wrist arthritis, as DECT could identify a final diagnosis of gout in 97 of 180 patients (53.9%). An alternative diagnosis was confirmed in 83 patients. US showed a sensitivity of 70.1% (extra-articular: 42.5%, P<0.001; intra-articular: 80.3%, P=0.14) and a specificity of 51%. The DC sign was present in 58 of 61 patients with a positive US study for intra-articular gout (95.1%) [23,50].
Although US and DECT have a high sensitivity in detecting gouty arthritis, there are some limitations to each modality. A major differential diagnosis of MSU deposits is CPPD, which is characterized by the accumulation of CPPD crystals in articular and periarticular tissues [51]. On US, CPPD can be detected with a high sensitivity and specificity. Chondrocalcinosis is visualized as thin intra-cartilaginous hyperechoic bands parallel to the surface of the articular cartilage [52]. Furthermore, punctate hyperechoic bands may be observed in regions of fibrocartilage, such as the triangular fibrocartilage complex or menisci. CPPD aggregates are located within the cartilage layer, whereas MSU deposits are typically localized on the outer hyaline cartilage surface [53-55] (Fig. 5). Homogeneous hyperechoic nodular or oval deposits in the joint space or bursa, representing free crystal aggregates, may also be present in CPPD and HADD [56] (Fig. 6). These echogenic deposits may be very similar to MSU deposits, making differentiation by US alone difficult if the DC sign is not present. Furthermore, in advanced gouty disease, extensive tophi causing dorsal shadowing might be present, obscuring the DC sign. Under these circumstances, either synovial fluid aspiration with microscopy or DECT are the only reliable techniques for a definitive diagnosis.
A patient with calcium pyrophosphate dihydrate (CPPD) of the knee.
A. Axial ultrasonography (US) of the femoral condyle shows a thick linear deposit (arrows) within the cartilage layer, indicates high-grade CPPD. B. Parasagittal US of the lateral knee shows echogenic deposits (arrows) within the lateral meniscus. C. Corresponding X-ray of the same patient shows typical calcification (arrows) within the menisci and around the condyle.

A patient with hydroxyapatite (HADD) of the Achilles tendon.
A. Longitudinal power Doppler ultrasonography shows extensive hyperechoic aggregates (stars) in the Achilles tendon with posterior acoustic shadowing. This could also be interpreted as multiple tophi due to edema limiting the detection of the fibrillar echotexture of the Achilles tendon. B. A 3D rendered dual-energy computed tomography of the same patient confirms HADD (color-coded purple) in the Achilles tendon, without evidence of monosodium urate deposits (color-coded green). Note: Green artifacts of nails.
Another advantage of using DECT following first-line US is the detection of extra-articular MSU deposits (e.g., in the tendons), which cannot be differentiated from HADD by US alone. For MSU deposits in regions not accessible by US, such as the cruciate ligaments of the knee or the subtalar joint, DECT also offers an excellent overview of MSU deposits (Fig. 7).
Extra-articular monosodium urate (MSU) deposits in the quadriceps tendon.
A. Longitudinal ultrasonography of the distal quadriceps tendon is shown. No hypervascularity or tendinosis is seen, but there are diffuse discrete hyperechoic deposits at the posterior layer of the tendon (stars). There is no dorsal shadowing, but a discrete hypoechoic halo is present (arrows). The extent of the abnormality only became apparent retrospectively after performing dual-energy computed tomography (DECT). B. Sagittal three-dimensional rendered DECT demonstrates color-coded green MSU deposits along the quadriceps tendon and the prepatellar region. Furthermore, discrete MSU deposits (green) are visible in the infrapatellar tendon, medial collateral ligaments, and menisci.
DECT can also detect subclinical MSU deposits [43,57]. Discrepancies between the detection rates of US and DECT have been observed in several studies. Huppertz et al. [58] showed that DECT was slightly more specific for the diagnosis of gout than US (sensitivity, 84.6% [33 of 39 patients]; specificity, 85.7% [18 of 21 patients]; positive predictive value [PPV], 91.7% [33/36]; negative predictive value [NPV], 75.0% [18/24] for DECT vs. sensitivity, 100% [39/39 patients], specificity, 76.2% [16/21 patients]; PPV, 88.6% [39/44], and NPV 100% [16/16] for US). However, they concluded that DECT failed to detect small MSU deposits and was less sensitive than US on a joint-based evaluation because its lower spatial resolution missed crystal depositions on the cartilage surface (which represent the DC US sign). Therefore, the diagnosis of gout may be missed by DECT in patients with early disease limited to a few joints.
Small MSU deposits and those with low concentrations seem to generate false negative results on DECT. DECT detects dense tophi (corresponding to approximately 15%-20% by volume urate concentrations in the tophus) and misses less dense tophi below the detection threshold of 150 HU even if they have a considerable size. This might result in diagnostic performance discrepancies between the two modalities [59,60]. In summary therefore, using both modalities in conjunction, especially with US as the first-line examination whenever necessary, generates the best possibility of not missing any positive findings.
For this reason, we provided a standardized algorithm, where US is the first-line investigation for patients with a high pre-test probability of gout due to distinct clinical features, followed by DECT if the US findings are inconclusive. This approach can obviate the need for radiography and synovial fluid puncture and aligns with the recommendations of other authors (Table 1) [61-63].

Proposed diagnostic algorithm
Conclusion
US and DECT are noninvasive imaging modalities with excellent sensitivity and specificity for detecting MSU deposits. In some patients, it may be necessary to use them both in conjunction to improve the diagnostic imaging algorithm for gout. US is cheaper and more widely available than DECT, and has been shown to be more sensitive for early disease and when low concentrations of MSU deposits are present. It also allows the detection of soft tissue inflammation, which may be useful for assessing the response to therapy. DECT may not be available at the same day for most institutions, and clinicians may want to initiate therapy. It is therefore proposed to use US as a first line of investigation in patients with suspected acute gout. However, DECT has the advantage of greater sensitivity and specificity than US in the detection of MSU deposits in certain regions. With a standardized algorithm using DECT after US in unclear cases, high accuracy can be achieved in the diagnosis or exclusion of gout, obviating the need for invasive procedures.
Notes
Author Contributions
Conceptualization: Schwabl C, Klauser AS, Widmann G. Data acquisition: Schwabl C, Klauser AS. Data analysis or interpretation: Schwabl C, Klauser AS, Taljanovic M, Teh J. Drafting of the manuscript: Schwabl C, Klauser AS, Teh J, Taljanovic M. Critical revision of the manuscript: Schwabl C, Klauser AS, Widmann G, Taljanovic M, Teh J. Approval of the final version of the manuscript: all authors.
No potential conflict of interest relevant to this article was reported.