Combination of shear-wave elastography with ultrasonography for detection of breast cancer and reduction of unnecessary biopsies: a systematic review and meta-analysis
Article information

Abstract
Purpose
This study was undertaken to compare the diagnostic performance and biopsy reduction rate of combined shear-wave elastography (SWE) and B-mode ultrasonography (US) versus B-mode US alone for breast lesions and to determine the most discriminatory parameter in SWE.
Methods
A systematic review and meta-analysis were conducted. The resources for the study were obtained from MEDLINE, Embase, Cochrane Library, and KoreaMed on August 17, 2018. The quality of the articles was evaluated using the Scottish Intercollegiate Guidelines Network (SIGN) tool.
Results
Twenty-five articles with 5,147 breast lesions were selected. The meta-analysis showed pooled sensitivities of 0.94 and 0.97 (P=0.087), pooled specificities of 0.85 and 0.61 (P=0.009), and area under the receiver operating characteristic curve (AUC) of 0.96 and 0.96 (P=0.095) for combined SWE and B-mode US versus B-mode US alone. When SWE was combined with B-mode US, the Breast Imaging Reporting and Data System category changed from 4 to 3 in 71.3% of the tests, decreasing the frequency of unnecessary biopsies by 41.1%. All four parameters of SWE (the color grade of lesion stiffness, maximum elasticity, mean elasticity, and color grade of lesion stiffness/homogeneity of the lesion) improved the specificity when they were added to B-mode US. The AUC for each SWE parameter was 0.99, 0.96, 0.96, and 0.93, respectively.
Conclusion
Adding SWE to B-mode US not only provides additional diagnostic information for differentiating between benign and malignant breast lesions, but also decreases the likelihood of unnecessary biopsies.
Introduction
B-mode ultrasonography (US) is used as a supplementary workup test after mammography for woman with dense breast tissue in clinical settings [1]. B-mode US has a high sensitivity (greater than 95%), but also a low specificity (13%-81%) for distinguishing between benign and malignant breast masses [2-5]. The high false-positive rate of B-mode US increases the likelihood of unnecessary biopsies and may increase patients’ levels of discomfort and anxiety [6].
Shear-wave elastography (SWE) is a new technique for measuring the stiffness of biological tissues [4,7]. It can be used to decrease the high false-positive rate of B-mode US by increasing specificity [8-10]. SWE introduces stress force into the mass and induces shear in the tissue [11]. The acoustic radiation force is generated by the transfer of momentum from the acoustic wave to the tissue; therefore, a stiffer object has a higher elastic modulus [11] and the speed of shear waves is higher in hard tissues than in soft tissues [8,12]. To distinguish breast lesions, two types of SWE techniques are most widely used: supersonic shear imaging (SSI; Aixplorer SuperSonic Imagine, Aix-en-Provence, France) and acoustic radiation force impulse (ARFI; Siemens Healthcare, Erlangen, Germany) imaging [13]. SSI measures shear wave velocities in kilopascals (kPa) or shear wave speed (m/s), while ARFI (virtual touch quantification) uses only meters per second for shear wave velocities [14,15]. The difference between SSI and ARFI is that SSI is monitored using multiple axial push beams, while ARFI creates shear waves by a single push beam [11]. In addition, the transducers and acquisition depths differ between SSI and ARFI [16].
SSI displays a color image to provide qualitative grades for lesion stiffness (Ecolor; red, orange, green, light blue, dark blue, and black) and the homogeneity of elasticity within the lesion and surrounding tissue (Ehomogeneity: very homogeneous, reasonably homogeneous, and heterogeneous) [17]. For the Ecolor feature, red represents a stiffer lesion [12,17], and for Ehomogeneity, greater heterogeneity indicates a greater likelihood of malignancy [12,17]. In the Ecolor, homogeneity pattern proposed by Tozaki and Fukuma [18], each image is classified as having one of four patterns (pattern 1: homogeneous blue, pattern 2: vertical stripe pattern, pattern 3: a localized colored area at the margin of the lesion, pattern 4: heterogeneously colored areas in the interior of the lesion).
In addition, various features including maximum elasticity (Emax), mean elasticity (Emean), minimum elasticity (Emin), standard deviation of elasticity (ESD), and the elasticity ratio of lesion stiffness to a similar region of fat (Eratio) are quantitatively calculated using SSI [7,17].
Recently, many studies have reported that SWE improved the specificity of B-mode US, while simultaneously reducing the likelihood of unnecessary biopsies [8,9,19]. Three meta-analyses of breast SWE have been published [13,15,20]. Li et al. [15] showed the diagnostic accuracy of SWE alone, and Liu et al. [13] showed a high level of heterogeneity among the selected studies, which contained 27 articles on ARFI and six articles on SSI. Luo et al. [20] did not examine the effect of combining B-mode US with SWE on the biopsy rate. Furthermore, the meta-analysis did not indicate which SWE parameter was the most effective.
The present study aimed to evaluate the diagnostic performance and effect on the biopsy rate of combining SWE with B-mode US in breast lesions and to evaluate the most effective SWE parameter. In addition, in this review, only SSI was analyzed to ensure consistency in calculations and reported lesion elasticity.
Materials and Methods
A systematic review and meta-analysis were performed in accordance with the Preferred Reporting Items for Systematic Reviews and Meta-Analyses (PRISMA) statement [21]. This study involved consultation with seven medical specialists: two radiologists, two breast surgeons, two pathologists, and one evidence-based medicine expert. The specialists discussed and reviewed the search strategy, selection/exclusion criteria, the result of quality assessment for selected articles, and subsequent results, in three consultation meetings.
Literature Search Strategy
On August 17, 2018, we searched KoreaMed (from January 1997), MEDLINE (from January 1946), EMBASE (from January 1996), and Cochrane Library (from January 1990). From this search, a total of 724 abstracts were identified through the use of keywords such as {breast.mp. AND shear.mp. AND (elastography.mp. OR elasticity imaging.mp. OR sonoelastography.mp.)} (Table 1). Duplicate articles were excluded manually.

Details of the search strategy
Study Selection Criteria
Two reviewers (S.Y.P. and S.Y.K.) screened the titles and abstracts to identify potentially relevant articles according to the inclusion and exclusion criteria. The inclusion criteria were as follows: studies that (1) included patients with breast lesions, (2) performed SWE with B-mode US and compared it with B-mode US alone, (3) used fine-needle aspiration biopsy, surgical excision, and/or follow-up observations as reference tests, (4) reported relevant outcomes (diagnostic accuracy and the biopsy reduction rate), (5) obtained informed consent from patients, and (6) were approved by an institutional review board. Articles were excluded on the basis of (1) any animal experiments, (2) pre-clinical experiments, (3) gray literature (conference abstracts), (4) not being written in English, (5) reviews, letters, editorials, and case reports.
In the meeting with specialists to address discrepancies in article selection, the specialists decided to exclude studies that (1) did not report the results of adding SWE to B-mode US, and (2) did not conduct SWE and B-mode US in the same patients. For the meta-analysis, studies that compared the diagnostic performance of the combination of SWE and B-mode US versus B-mode US alone were selected.
Quality Assessment
Two reviewers (S.Y.P. and S.Y.K.) independently evaluated the methodological quality of the selected studies using the Scottish Intercollegiate Guidelines Network (SIGN) methodology checklist for studies of diagnostic accuracy [22]. The SIGN tool consists of five domains: patient selection, index test, reference standard, flow and timing, and overall assessment of the study. The domains used to assess any risk of bias could result in high-quality (++), acceptable (+), or unacceptable (-) ratings (Table 2). If a study fulfilled all 13 items on the checklist, we gave it a score of "++". Furthermore, we downgraded the quality of an article if (1) the images were not assessed blindly between the index test (combination of SWE and B-mode US) and the comparator test (B-mode US), (2) patients were not enrolled with consecutive sampling or random selection, and (3) the selection criteria for the patients were not mentioned.
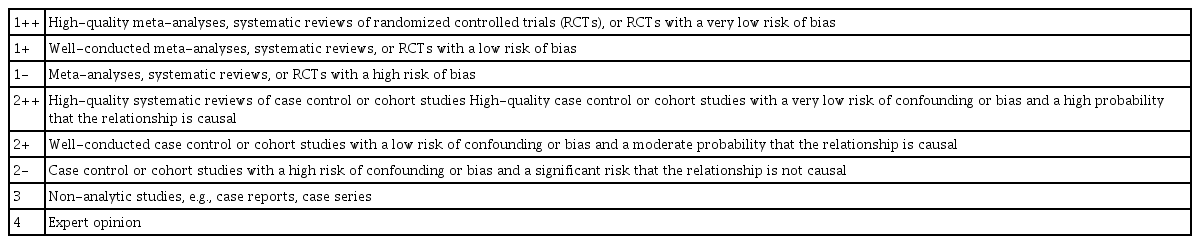
Methodological quality of studies (SIGN criteria)
Data Extraction
Data from each article were extracted in a standardized form: (1) study information: author, year of publication, study design (prospective or retrospective study), study purpose (diagnostic or screening), country, study period, inclusion criteria for the research, and duration of follow-up; (2) patient characteristics: number of patients, number of lesions, number of malignant lesions, mean age of patients; (3) technical characteristics: SWE parameters (with cutoffs) and reference tests; and (4) outcomes: 2×2 tables (for true-positive, false-positive, true-negative, and false-negative results) and the biopsy reduction rate. The effects of combining SWE with B-mode US on biopsy were assessed by three possible outcome measures, which are listed in Table 3. This process was repeated several times for fully published reports by one investigator (S.Y.P.) and was further checked by the seven medical specialists.
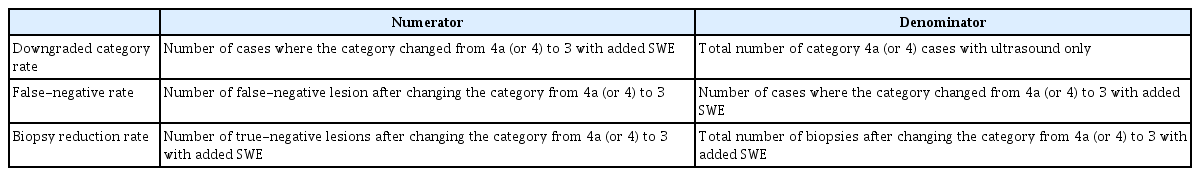
Definitions of biopsy reduction performance outcomes
Data Synthesis and Analysis
In this study, a quantitative synthesis was used to overview the general characteristics of the selected research and the effects of the combination of SWE and B-mode US on the biopsy rate [23]. In addition, we conducted a meta-analysis to provide summary information from articles [23].
To analyze the reduction rate of breast biopsies when SWE was added to B-mode US, we synthesized the downgraded results from Breast Imaging Reporting and Data System (BI-RADS) category 4a (or 4) to category 3 when the SWE was lower than the optimal cutoff in each selected article. The results for upgrading from BI-RADS category 3 to category 4 when adding SWE were not analyzed, since there is insufficient evidence that adding SWE is beneficial in terms of increased sensitivity [3-5,24-27]. To analyze the effects of SWE on biopsies, the downgraded category rate, false-negative rate, and biopsy reduction rate were categorized according to SWE parameters (Emax, Emean, Emax, and Ecolor). The average values of biopsy reduction outcomes were calculated according to SWE parameters.
The meta-analysis of the diagnostic accuracy of all articles was performed using the MIDAS modules in STATA version 14.0 (StataCorp LP, College Station, TX, USA) [28]. Measures of diagnostic accuracy, including sensitivity, specificity, and the area under the receiver operating characteristic curve (AUC), were reported as pooled estimates with 95% confidence intervals (95% CIs). The results of the meta-analysis were illustrated using forest plots to display the variability and estimates of sensitivity and specificity among each study, together with tabular data [23,29]. Statistical analyses were conducted to compare sensitivity, specificity, and AUC between SWE added to B-mode US and B-mode US alone, and a P-value ≤0.05 was considered to indicate statistical significance [29].
To reduce the heterogeneity among the results of articles, the variance in the results of the individual studies was assessed, while the data were categorized according to SWE parameters such as Emax, Emean, Ecolor, Ehomogeneity, and Ecolor, homogeneity. Heterogeneity among articles was tested using the I2 approach. I2 quantifies the effects of heterogeneity to measure the degree of observed inconsistency across the results of studies [30,31]. The I2 value lies between 0% and 100%, where a larger value of I2 indicates higher observed heterogeneity, and lower values show less heterogeneity [30,31]. I2 values of 25%, 50%, and 75% were considered to indicate low, moderate, and high heterogeneity, respectively [30,31].
Publication bias was assessed using Deeks funnel plot tests to evaluate associations between the diagnostic log odds ratio and the effective sample size [28-30]. A P-value <0.10 for the slope coefficient indicates a significant asymmetry [28,29,32].
To differentiate between the categories, BI-RADS categories 2 and 3 were considered to indicate benign lesions, while categories 4a, 4b, 4c, 5 were considered to indicate possibly malignant lesions, for which a biopsy is recommended [33,34].
Meta-regression and Subgroup Analyses
To investigate the sources of potential heterogeneity in outcomes among the selected studies, univariate meta-regression and subgroup analyses were performed using data combining SWE and B-mode US [28,29]. The covariates were the methodological quality of the study (2++, 2+), the cutoff of the parameter (≥70 kPa, <70 kPa), the study country (Asian or Western countries), publication year (2010-2014 or 2015-2018), the type of reference test (biopsy or biopsy/follow-up, or biopsy/surgical excision), and the type of parameter (quantitative or qualitative). In the subgroup analysis, pooled estimates of test accuracy were calculated and compared according to each covariate.
Results
Literature Search
The chosen search strategies identified a total of 724 publications (excluding 367 duplicated articles). Furthermore, we excluded 319 articles because the titles and abstracts did not meet the selection criteria. The search process is shown in Fig. 1. The remaining 48 articles were evaluated through a comprehensive full-text review. Finally, a total of 25 studies were selected for the final quantitative and qualitative analyses [3-5,7,9,12,17,24-27,35-48] (Table 4). All the studies were diagnostic accuracy studies [22], and none were randomized controlled trials. Of the 25 studies, 21 were used to conduct the quantitative analysis (meta-analysis) [3-5,9,12,17,24-27,35,37,39-41,43-48]. Eight studies were used to estimate the effects of adding SWE on the biopsy rate [3,7,24,26,36,38,39,42].

PRISMA flow diagram of the study selection.
SWE, shear wave elastography; US, ultrasonography.
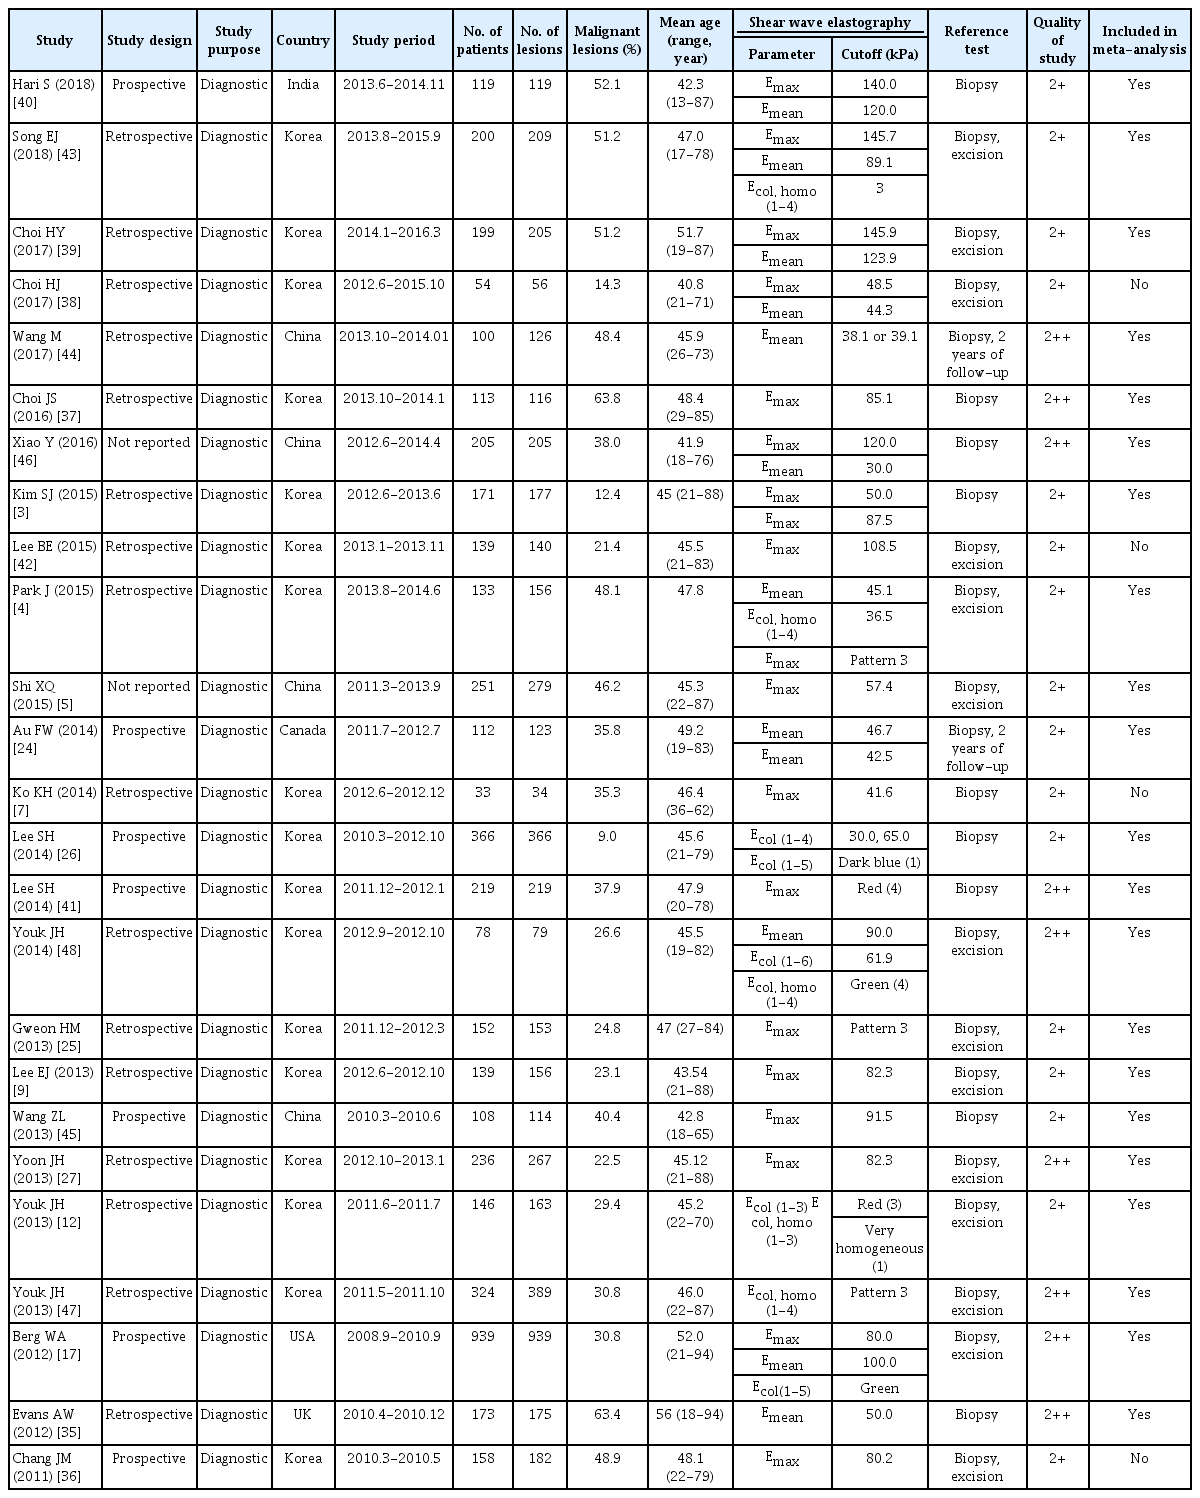
Main characteristics of the selected studies
Characteristics of the Included Studies
The 25 studies included a total of 5,147 breast lesions in 4,867 patients for the final analysis. Seventeen of these studies were conducted in Korea, four in China, and one each in the United States, Canada, India, and the United Kingdom. Among the selected studies, the malignant lesion rate ranged from 9.0% to 63.8%, and the mean age of the patients ranged from 40.8 to 56 years. The SWE parameters, including Emax (18 articles), Emean (12 articles), Ecolor, homogeneity (five articles), and Ecolor (four articles) varied among the selected studies. Various SWE cut-offs were also used: that for Emax was 30-145.9 kPa, that for Emean was 30.0-123.9 kPa, that for Ecolor, homogeneity was pattern 3 or red/very homogeneous, and that for Ecolor was red, green, or dark blue. A total of 4,887 breast lesions from 4,483 patients were included in the meta-analysis (Table 4). The reference standards were biopsy (nine articles), biopsy or surgical excision (14 articles), and biopsy or follow-up (two articles). Seven studies had a prospective design, 16 were retrospective studies, and two studies did not report the study design.
Quality Assessment of the Included Studies and Publication Bias
Out of the 25 studies, nine articles had a quality score of 2++ [17,27,35,37,41,44,46-48], and 16 had a score of 2+ [3-5,7,9,12,24-26,36,38-40,42,43,45]. The quality of the selected studies is summarized in Table 4. No publication bias was observed in the Deeks funnel plot asymmetry test among 21 studies (P=0.861) (Fig. 2) or for studies that reported the diagnostic accuracy of Emax and Emean (P=0.892 for Emax, and P=0.530 for Emean) (Fig. 2).
Deeks’ funnel plots of shear wave elastography (SWE) and B-mode according to SWE parameter.
US, ultrasonography; Emax, maximum elasticity; Emean, mean elasticity.
Comparison of Diagnostic Accuracy between the Combination of SWE with B-Mode US and B-Mode US Alone
Twenty-one of the studies (4,816 lesions) reported the diagnostic accuracy of combining SWE and B-mode US to differentiate benign from malignant breast lesions. By combining SWE with conventional US, the overall sensitivity decreased from 0.97 (95% CI, 0.94 to 0.98; I2=91.6%) to 0.94 (95% CI, 0.90 to 0.96; I2=89.8%), while the pooled specificity improved from 0.61 (95% CI, 0.42 to 0.78; I2=98.4%) to 0.85 (95% CI, 0.77 to 0.90; I2=96.1%) without any changes in the AUC (Table 5, Figs. 3, 4). Comparing the diagnostic performance of combining SWE and B-mode US with that of B-mode US only, no significant differences in sensitivity (P=0.087) or AUC (P=0.095) were found; however, significant differences were observed in specificity (P=0.009) (Table 5).

Comparison of the pooled diagnostic accuracy of the combination of SWE and B-mode US with that of B-mode US alone according to SWE parameters

Summary receiver operating characteristic (SROC) plot for the combination of shear wave elastography (SWE) and B-mode ultrasonography (US) against B-mode US. AUC, area under the receiver operating characteristic curve.
Comparison of Diagnostic Accuracy According to SWE Parameters
Among the SWE parameters, the best performance was provided by Ecolor (AUC, 0.99; 95% CI, 0.97 to 0.99) when SWE was combined with B-mode US. For Ecolor, Emax, Emean, and Ecolor, homogeneity, the sensitivity was 0.98, 0.93, 0.95, and 0.86; the specificity was 0.84, 0.87, 0.86, and 0.89; and the AUC was 0.99, 0.96, 0.96, and 0.93, respectively (Table 5).
Among the quantitative parameters, when SWE was combined with B-mode US (index test), Emax displayed a 28% improvement in specificity and a 5% decrease in sensitivity, and Emean displayed a 24% improvement in specificity and a 1% decrease in sensitivity, compared with B-mode US alone (comparator test) (Table 5). However, there was no statistically significant difference in sensitivity, specificity, and AUC between the index test and the comparator test (Table 5).
Meta-regression and Subgroup Analyses for Identifying Potential Sources of Heterogeneity
Among the selected 21 studies, significant heterogeneity was present for sensitivity and specificity. As shown in the meta-regression, the cutoff of parameters (P=0.01), publication year (P<0.01), and types of reference test (P=0.01) accounted for significant heterogeneity in sensitivity (Table 6). The difference between the meta-regression models of the index test and comparator test was statistically significant in accordance with the methodological quality of the study and cutoff. The subgroup analyses revealed that sensitivity was better in studies with a higher cutoff, published in an earlier year (2010-2014), and when the reference test was the biopsy or biopsy/follow-up instead of biopsy/surgical excision.
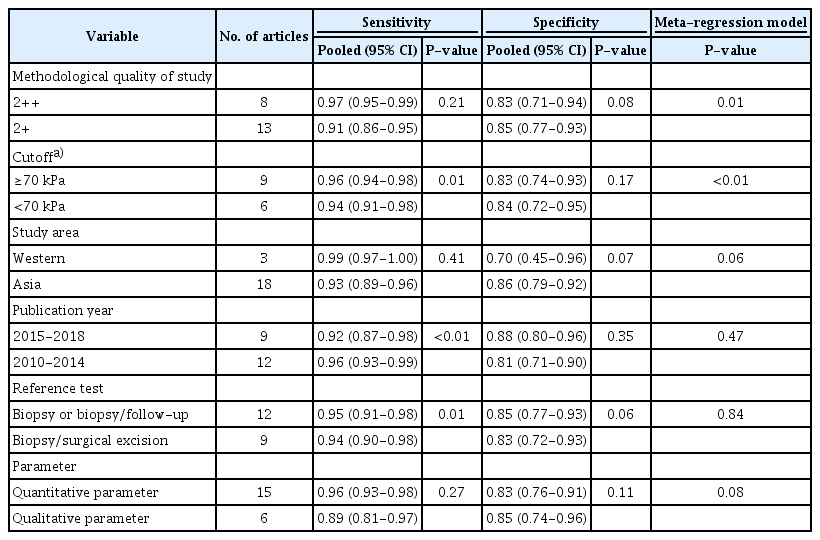
Meta-regression and subgroup analysis for identifying potential sources of heterogeneity
Effects of Adding SWE to B-Mode US on the Biopsy Rate
Eight studies showed that adding SWE changed the biopsy rate. By combining SWE and US, 25.0%-89.6% of BI-RADS category 4a or 4 lesions (mean, 71.3%; 477/669 lesions) were downgraded to category 3, and the false-negative rate was 0%-9.4% (mean, 3.1%; 15/485 lesions). Therefore, 11.2%-73.6% of unnecessary biopsies (mean, 41.1%; 462/1,123 lesions) could have been eliminated for BI-RADS category 4a or 4 lesions by adding SWE.
In the subgroup analyses for Emax and Emean, the categories changed for 32.0%-89.6% (mean, 69.5%) and 25.0%-88.6% (mean, 54.6%) of the lesions, respectively. The false-negative rates were 0%-9.4% (mean, 3.3%) and 0%-8.0% (mean, 3.5%), and the biopsy reduction rates were 14.1%-73.6% (mean, 38.1%) and 11.2%-58.9% (mean, 26.1%) for Emax and Emean, respectively. The effects on the biopsy rate are summarized in Table 7.

Effects on biopsy of adding SWE to B-mode US
Discussion
Our meta-analysis showed that combining SWE with B-mode US improved the pooled specificity from 0.61 to 0.85 compared with B-mode US alone, without significant changes in sensitivity and AUC. In this review, when SWE was combined with B-mode US, the frequency of unnecessary biopsies decreased by 71.3%, and the false-negative rate was 3.1%. All four parameters of SWE (Ecolor, Emax, and Emean, and Ecolor, homogeneity) improved specificity when they were added to B-mode US, and Ecolor, Emax, and Emean showed better performance than Ecolor, homogeneity. As shown in the meta-regression, the methodological quality of studies and the cutoff affected the heterogeneity of diagnostic performance of the index test (combining SWE with B-mode US). In the subgroup analyses, sensitivity was higher in studies with a higher cutoff, published in an earlier year (2010-2014), and when the reference test was biopsy or biopsy/follow-up. There was no significant publication bias. Our findings indicate that SWE could be used as an effective tool for the differential diagnosis of breast lesions.
Our meta-analysis demonstrated that the combination of SWE with B-mode US had high diagnostic performance for patients with breast lesions, showing a pooled sensitivity, specificity, and AUC of 0.94, 0.85, and 0.96 in the 21 studies, respectively. Meanwhile, the sensitivity, specificity, and AUC of B-mode US were 0.97, 0.61, and 0.96, respectively. Although a previous meta-analysis compared the diagnostic performance of combined SWE and B-mode US with that of B-mode US alone for breast lesions across nine studies [13], our study included the latest data, with 21 studies on SSI. In addition, our study revealed that the improved specificity was statistically significant. The previous study reported that overall sensitivity increased from 0.95 to 0.97, while pooled specificity improved from 0.55 to 0.80 by combining SWE and B-mode US compared with B-mode US alone [13]. Our current data therefore support the assertion that adding SWE to B-mode US for breast lesions may be a clinically acceptable practice.
In previous meta-analyses, the best-performing SWE features were not examined, although it has been proven that various elasticity parameters can be obtained with SWE, such as Emax, Emean, Emin, ESD, Eratio, Ecolor, and Ecolor, homogeneity [13,15,20]. In our meta-analysis, the AUC values were 0.99 for the Ecolor, 0.96 for both Emax and Emean, and 0.93 for Ecolor, homogeneity. The most discriminatory SWE parameter for distinguishing between benign and malignant lesions was Ecolor in this study. However, Emax and Emean displayed a similar AUC and sensitivity, with Ecolor, showing increased specificity when SWE parameters were added to B-mode US. Unlike other parameters, when adding Ecolor, homogeneity as an SWE parameter to B-mode US, sensitivity decreased by 9%. Therefore, radiologists need to pay careful attention when using Ecolor/homogeneity to discriminate malignant from benign lesions.
Heterogeneity in study outcomes was found for pooled diagnostic accuracy, including sensitivity and specificity. Considering the possible influence of the study design and variation in cutoffs on heterogeneity among the selected studies [4,15], we further conducted meta-regression and subgroup analyses. For quantitative parameters, a higher cutoff (≥70 kPa) yielded significantly higher sensitivity than a lower cutoff (<70 kPa). However, there is no standardized cutoff value for SWE, and the cutoff values varied across the selected studies in this review. Further clinical studies should therefore be carried out to determine the appropriate cutoff value for screening breast cancer by considering the related factors that can have an effect on diagnostic accuracy. In addition, radiologists need to evaluate the most appropriate cutoff for their institution, and it should be regularly monitored and adjusted [49].
Meta-regression also showed that the methodological quality of the study could affect the heterogeneity of each study. Thus, to confirm the benefit of adding SWE to B-mode US, future research should implement strategies that improve the quality of the study, such as blinding between the index test and comparator test and using rigorous selection criteria for the enrollment of patients.
Additional sources of heterogeneity in diagnostic accuracy could be considered, such as the characteristics of breast lesions (e.g., lesion size, the histological type of malignancy, and a combination of those factors) [22,27]. Those characteristics of breast lesions could also contribute to the high heterogeneity of the diagnostic accuracy results.
Although the combination of SWE and B-mode US could eliminate a large proportion of unnecessary biopsies, the false-negative rate was reported to be 0%-9.4% (mean, 3.1%) among eight articles [3,7,24,26,36,38,39,42]. In light of the high rate of false-negative results, further research should explore effective strategies of reducing the false-negative rate. The benefit of reducing unnecessary biopsies by adding SWE must be supported by a sufficiently low false-negative rate. In addition, we suggest that a conservative approach is needed when breast lesions are downgraded from BI-RADS category 4a to 3 after adding SWE. To decrease the prevalence of false-negative cases, several strategies might be helpful, such as using lower cutoff values (<40 kPa) [3,26,39], or short-term follow-up after downgrading BI-RADS category 4a lesions with SWE [24]. In particular, the studies selected in this review suggested that applying lower cutoff values might be an important strategy for reducing false-negative cases. For example, Kim et al. applied different cutoff levels of Emax for downgrading BI-RADS 4a lesions to category 3, and the false-negative rate decreased from 6.6% to 0% for Emax of 87.5 kPa and Emax of 50 kPa [3]. Choi et al. [39] used the highest quantitative cutoff levels (Emean cutoff: 123.9 kPa, Emax cutoff: 145.9 kPa) among the selected articles; hence, they reported higher false-negative rates, in the range of 8.0%-9.4%, than other studies. Furthermore, radiologists need to decide whether to perform biopsy based on the fact that relatively low elasticity values are seen in SWE for soft malignant lesions (ductal carcinoma in situ, lobular carcinoma, mucinous carcinoma, and lymphomas) [3,7,9,36,49], small lesions, deep lesions, and lesions in women with higher breast thickness [27,50], while certain benign lesions, such as fat necrosis and mastitis, have relatively high elasticity values [49].
In this study, wide ranges of biopsy reduction rates were found (26.1%-52.7%) and SWE downgraded 54.6%-71.3% of BI-RADS 4 lesions to category 3. Among the studies selected to review the biopsy reduction rate, the cutoff values (30.0-145.9 kPa), SWE parameters, lesion size, malignant lesion rates, and histological types also varied. Therefore, we suggest that the diversity of SWE methods and patient characteristics may be related to the wide range of biopsy reduction rates.
This study is subject to a few limitations. First, the cutoff values for SWE ranged from 30 to 145.9 kPa across the different studies. We were unable to obtain an optimal single cutoff value because of heterogeneity among the studies; thus, this issue remains to be resolved through studies with a larger sample size. Second, although we conducted a validated meta-analysis, considerable heterogeneity among studies was found. Nonetheless, we performed a comprehensive systematic review with robust methods, and no publication bias was identified among the selected studies. Third, we did not investigate the performance of SWE in upgrading lesions. Therefore, any future studies need to consider the various factors that can affect diagnostic accuracy. Lastly, different techniques such as ARFI were not examined in our meta-analysis.
In conclusion, this meta-analysis indicated that the SWE imaging is effective for increasing the specificity of B-mode US for distinguishing benign and malignant lesions in patients suspected of having breast cancer, as well as reducing the likelihood of unnecessary biopsies in patients with benign lesions. All four parameters of SWE (Ecolor, Emax, Emean, and Ecolor, homogeneity) improved specificity when they were added to B-mode US. Among the SWE parameters, Ecolor, Emax, and Emean showed better performance than Ecolor, homogeneity. Future studies are required to extend these findings and to confirm appropriate cutoff values of SWE.
Notes
Author Contributions
Conceptualization: Park SY, Kang BJ. Data acquisition: Park SY. Data analysis or interpretation: Park SY. Drafting of the manuscript: Park SY. Critical revision of the manuscript: Park SY, Kang BJ. Approval of the final version of the manuscript: all authors.
No potential conflict of interest relevant to this article was reported.
Acknowledgements
We thank the following investigators for helpful comments on the research: Mi Ja Kim, RN, PhD FRCN, FAAN, Department of Biobehavioral Health Science, University of Illinois at Chicago, Chicago; Jun Il Choi, MD, PhD, Department of Radiology, Seoul St. Mary's Hospital, Korea; Heung Gyu Park, MD, PhD, Department of Surgery, Gachon University Gil Medical Center, Korea; Jung Won Bae, MD, PhD, Department of Surgery, Korea University College of Medicine, Korea; Jung Yeul Kim, MD, PhD, Department of Pathology, Korea University College of Medicine, Korea; Eiu Jung Kim, MD, PhD, Department of Pathology, National Health Insurance Service Ilsan Hospital, Korea. We thank the following employee of the National Evidence-based Collaborating Agency for contributing to the selection and quality assessment of the articles: SY Kim, MS. This study was supported by research funds from the Ministry of Health and Welfare in Korea (HTA 2016-37).