Comparison of superb microvascular imaging and shear wave elastography for assessing liver fibrosis in chronic hepatitis B
Article information

Abstract
Purpose
The present study investigated the effectiveness and applicability of superb microvascular imaging (SMI) in determining the degree of liver fibrosis noninvasively in comparison with shear wave elastography (SWE).
Methods
Ninety-eight consecutive patients with chronic hepatitis B who underwent ultrasound (US)-guided needle biopsy were examined using US combined with SMI and SWE. The predictive performance of the two US techniques in staging liver fibrosis and inflammation was compared with reference to the histological findings obtained from liver biopsy. The intraobserver and interobserver reproducibility of SMI in vascularity scores were evaluated.
Results
SWE values and SMI vascular scores were statistically significantly different among fibrosis stages (χ2(3)=76.3, χ2(3)=81.5, P<0.001). The SWE and SMI models significantly predicted fibrosis stages separately, and SMI scores alone predicted fibrosis stages better than SWE values (50.1% for SWE, 63.5% for SMI, P<0.001). A model with both SMI scores and SWE values together explained 73.2% of variance in fibrosis stages. When other clinical and laboratory predictors were added to the model (81.5%, P<0.001), SWE values and SMI scores remained the main predictors of fibrosis stages. SWE and SMI were also applicable in predicting inflammatory grades, explaining 31% and 34% of variance, respectively, and 37.7% when used together (P<0.001).
Conclusion
Both SWE and SMI had good diagnostic performance in determining the degree of liver fibrosis in chronic hepatitis B patients. The efficacy of SMI was better than that of SWE. SMI can improve diagnostic performance for staging liver fibrosis and shows potential for estimating necroinflammation of the liver.
Introduction
Liver fibrosis is caused by many diseases such as chronic hepatitis, primary biliary cirrhosis, drug-induced liver injury, autoimmune hepatitis, alcoholic liver disease, and non-alcoholic steatohepatitis. An accurate and precise estimation of the degree of liver fibrosis is important for planning the treatment and determining the prognosis in patients with chronic hepatitis [1]. Liver biopsy is commonly used as a reference to evaluate fibrosis and inflammation, but its invasiveness does not make it suitable for disease monitoring and reproducibility [2]. Therefore, there is a need for easy-to-apply, inexpensive, and reproducible alternative reliable tests that evaluate liver fibrosis with a different approach for follow-up of the disease.
According to some guidelines, elastography and Fibrosis-4 or FibroTest are recommended as alternative tests to evaluate fibrosis [3]. Noninvasive measurements of stiffness with ultrasound (US)-based elastography has been applied for several clinical applications in recent years and is recommended in several guidelines for the evaluation of liver fibrosis because of its reproducibility and wide availability [4-9].
Liver fibrosis causes progressive distortion of the intrahepatic vascular structures and angiogenesis [8,10,11]. In the early stages of hepatitis, the liver undergoes hemodynamic changes in the microvascular structure. In the chronic process, the portal vein branches are disrupted and compressed. An increasing number of coiled neo-veins is seen originating from thin branches from the portal vein [12-14]. Superb microvascular imaging (SMI) is a new Doppler method that visualizes low velocity flows with superior resolution and minimal artifacts. In contrast, the detailed imaging capacity of color and power Doppler US imaging is insufficient, especially for deeply located vascular structures.
A few studies have shown that SMI can predict the fibrosis stage by detecting vascular changes due to liver fibrosis [15-17]. These studies focused on identifying the benefits of SMI in distinguishing early-stage liver fibrosis from late-stage. To the authors’ knowledge, no studies have yet compared the diagnostidc performance of SMI to that of shear wave elastography (SWE) in staging liver fibrosis. Therefore, the present study investigated SMI as a novel Doppler-based technique for the noninvasive assessment of liver fibrosis staging and inflammation grading using vascularity and compared the diagnostic performance of SMI and SWE for staging liver fibrosis in patients with chronic hepatitis B. The second aim of the study was to evaluate the intraobserver and interobserver repeatability of SMI for the vascularity score.
Materials and Methods
Compliance with Ethical Standards
This study was conducted with institutional review board approval (IRB No. 2020/125) from the local ethics committee and informed consent was obtained from the participants.
Patients
Between December 2019 and December 2020, 98 consecutive adult patients (≥18 years) with hepatitis B underwent US-guided needle biopsy. The biopsy decision was made by the patient's clinician according to the following clinical and laboratory parameters: (1) patients with hepatitis B e-antigen (HbeAg)-negative chronic hepatitis B, normal or elevated alanine aminotransferase (ALT) values, and hepatitis B virus DNA levels >2,000 IU/mL; or (2) HBeAg-positive chronic hepatitis V patients with elevated ALT values and a family history of cirrhosis or hepatocellular carcinoma. The patients were previously examined using US with both SMI and SWE. Among the participants, obese individuals (body mass index >30 kg/m2), pregnant women, and those using drugs or alcohol were excluded.
As laboratory markers, aspartate aminotransferase, ALT, total bilirubin (T-Bil), prothrombin time (PT), platelet count (PLT), and albumin (Alb) were collected at the same time as the biopsy.
Ultrasound Techniques
Both SMI and SWE were performed after B-mode US with the Aplio 500 US scanner (Canon Medical Systems, Tustin, CA, USA) equipped with a convex transducer (3.5 MHz) by a radiologist with 12 years of liver US experience in patients who were scheduled for an US-guided needle biopsy. The examination was performed from the intercostal region, in the left lateral decubitus position. All US measurements were made in the peripheral liver part of the right anterior sector, approximately 2 cm below the liver capsule. All US images were sent to the workstation and archived in the picture archiving and communication system (PACS) (Sectra IDS 7, Sectra, Linköping, Sweden). The examinations were reviewed by two radiologists, both of whom had 10 to 12 years of experience in abdominal US, and they were blinded to each other decisions. First, quantitative measurements were obtained with SWE. The elastographic images that exhibited color homogeneity were selected for elastographic data analysis. Five regions of interest were set for the SWE images, which were displayed as a translucent color map superimposed on the corresponding B-mode image. The color of the SWE images ranged from dark blue (indicating the lowest stiffness) to red (indicating the highest stiffness). The results were expressed in kilopascals (kPa) and ranged from 2.5 to 75 kPa. The most important parameter for assessing the reliability of SWE evaluation is the interquartile range (IQR), which reflects the variability of the validated measures. From the five measurements, the mean, median, IQR, and IQR/median values were calculated by the machine, and only measurements with IQR/median ratios ≤30% were considered acceptable.
The same US device was used for SMI Doppler and elastographic examinations. The distance from the capsule to the most peripheral area in which a vessel can be detected with both techniques was noted in millimeters. Using the SMI method, the vascular shapes were qualitatively evaluated and signs suggesting parenchymal fibrosis were looked for. Changes in vascular structures were scored in the vascular tree with reference to previous studies and divided into four main classes by two radiologists blinded to each other [15,17,18]. According to this, minimal loss of tapering and branching of the vascular tree was classified as grade 1, mild tortuosity of the main branches and marked tortuosity in distal branches as grade 2, blunting of distal small branches as grade 3, and in addition to the findings of grade 3, blunting of larger branches as grade 4 (Fig. 1A, D). The first radiologist made the second evaluation of vascular scoring for assessing intraobserver agreement. The median time of the second evaluation for reader 1 was 14 days (range, 7 to 30 days).
Superb microvascular imaging vascular scores.
A, D. Superb microvascular imaging (SMI) images at different fibrosis stages are shown. A. This figure (monochrome SMI) shows thinning of the distal branches but no evidence of tortuosity or blunting, classified as a vascular score of 1 according to Doppler grading. B. This figure shows tortuosity (arrow) in distal branches but no evidence of blunting, classified as a vascular score of 2. C. Monochrome SMI image shows blunting in small branches (arrowhead) but not in large branches, classified as a vascular score of 3. D. Monochrome SMI image shows tortuosity, blunting in small (arrow) and large branches (arrowhead), classified as a vascular score of 4.
Histopathological Analysis
The histopathological results obtained from the US-guided needle biopsy results were accepted as a reference standard. The histopathological evaluation was performed according to the METAVIR scoring system [19]. In the METAVIR scoring system, liver fibrosis is evaluated semi-quantitatively and staged on a 5-point scale from 0 to 4 (F0, absent; F1, periportal fibrotic expansion; F2, portal fibrosis with few septa; F3, bridging fibrosis; F4, cirrhosis). Inflammation was classified using a 4-point scale (A0, no activity; A1, mild activity; A2, moderate activity; and A3, severe activity).
Statistical Analysis
A descriptive analysis of quantitative variables such as patients’ age and elasticity were expressed as mean values with standard deviations, or median with range (minimum-maximum). The normality of the distribution of the numerical dataset was checked using the Kolmogorov-Smirnov test. Nonparametric tests were used for data that were not normally distributed. SWE and SMI measurements were compared with METAVIR liver fibrosis scores and inflammation grades using Spearman rho correlation coefficients (rs). The Kruskal-Wallis H test was conducted to determine whether there were differences in the mean SMI and SWE values among different fibrosis stages and inflammation grades. If the difference was statistically significant, the Dwass-Steel-Critchlow-Fligner test was conducted as a post-hoc test for pairwise comparison of the fibrosis stages. The Dwass-Steel-Critchlow-Fligner pairwise comparison test was used to evaluate the effectiveness of both SMI and SWE in discriminating fibrosis stages from each other. Univariate and multivariate analyses of predictors of liver fibrosis and inflammation were assessed using ordinal logistic regression. McFadden's pseudo-R squared (R2McF), the Akaike information criterion (AIC), and the Bayesian information criterion (BIC) were used for model comparison. Predictors that caused multicollinearity and were not significant in the univariate analysis were excluded from the multivariate analysis. The weighted kappa (κw) coefficient with linear weights was calculated to determine whether there was agreement between the two radiologists' judgments and between the judgments made by one radiologist between the first and second evaluation within 1 month. Statistical analyses were performed with SPSS version 22.0 (IBM, Armonk, NY, USA). A P-value ≤0.05 was considered as the threshold for statistical significance.
Results
Patient Population
Between December 2019 and December 2020, 108 consecutive patients (median age, 50; age range, 20 to 70 years) with hepatitis B underwent US-guided needle biopsy and a US examination with SMI and SWE. Fig. 2 shows the process of study selection. Twelve participants were excluded from the study since they were obese (body mass index >30 kg/m2, n=6), pregnant women (n=1), and drug (n=2) or alcohol users (n=3). As a result, 96 patients (45 women and 51 men) fulfilled the inclusion criteria in the study. The distribution of patients by fibrosis stage was as follows: 37 (38%) patients in F1, 27 patients (28.1%) in F2, 17 patients (17.7%) in F3, and 15 patients (15.6%) in F4. The distribution of inflammation grades was as follows: no inflammation was found in eight patients (8.3%), mild inflammation in 46 patients (47.9%), moderate inflammation in 23 patients (24%), and severe inflammation in 19 patients (19.8%). The demographic characteristics and the mean aspartate aminotransferase, ALT, T-Bil, PT, PLT, and serum Alb values of the patients are shown in Table 1.
Flowchart of the patient selection process.
US, ultrasonography; SWE, shear wave elastography; SMI, superb microvascular imaging.
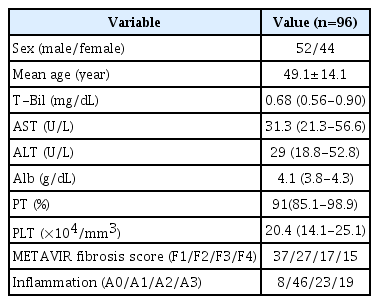
Baseline characteristics of patients
Predictive Performance of SWE and SMI
Liver stiffness measured with SWE ranged from 3.1 kPa to 35.96 kPa. Fig. 3A shows the categorical histogram graphs for the representation of liver stiffness values for each fibrosis stage. Liver stiffness was significantly different between patients according to their fibrosis stages (P<0.001). There was a strong positive correlation between stiffness and liver fibrosis stage (r=0.894, P<0.001). The Kruskal-Wallis H test was performed to determine whether SWE values were significantly different across fibrosis stage groups. Participants were classified into four fibrosis stages, from F1 to F4. The median SWE values were statistically significantly different between the different fibrosis stages (F1-F2, F1-F3, F1-F4, F2-F3, F2-F4, F3-F4; χ2 (3)=76.3, P<0.001) (Table 2). Subsequently, pairwise comparisons were conducted using the Dwass-Steel-Critchlow-Fligner test to determine which of the fibrosis stages are statistically significantly different. This post hoc analysis of the Dwass-Steel-Critchlow-Fligner test revealed that there were statistically significant differences in median SWE values between all fibrosis stage groups (P<0.001) (Table 3). The correlation between stiffness values and inflammation scores was positive and significant (r=0.723, P<0.001).

Categorical histograms representing the distribution of both shear wave elastography (SWE) (A) and superb microvascular imaging (SMI) (B) over fibrosis stages.
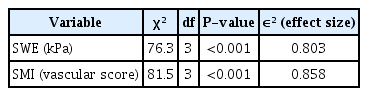
Kruskal-Wallis H test for the median scores of SWE and SMI parameters in fibrosis stage groups
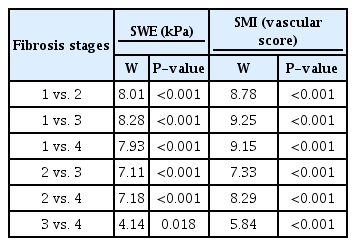
Dwass-Steel-Critchlow-Fligner post-hoc test for pairwise comparisons
To determine whether the SMI parameters, which were ordinal numbers from level 1 to 4, were different among the fibrosis stage groups, the Kruskal-Wallis nonparametric test was also conducted. Participants were classified into four groups of fibrosis stage and four levels of SMI values. Fig. 3B shows categorical histogram graphs representing the distribution of SMI scores across fibrosis stages. SMI vascular scores were statistically significantly different between the different fibrosis stages, (χ2 (3)=81.5, P<0.001) (Table 2). Subsequently, pairwise comparisons were performed using the Dwass-Steel-Critchlow-Fligner test. This post hoc analysis revealed that there were statistically significant differences in SMI levels between all fibrosis stage groups (P<0.001) (Table 3). The SMI vascular scores showed strong positive correlations with both liver fibrosis stages and inflammation grade (r=0.925, P<0.001 and r=0.758, P<0.001, respectively).
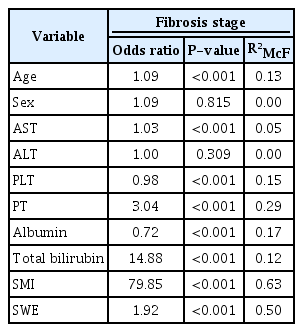
Since fibrosis stages are ordinal values from 1 to 4, ordinal logistic regression procedures were run to determine the discrimination of every fibrosis stage by SWE and/or SMI scores. Using ordinal logistic regression, it was possible to model the effects of SWE scores and SMI parameters separately and together on fibrosis stages. The model using SWE levels alone explained 50.1% of variance in fibrosis stages, and SMI vascular scores alone explained 63.5% (Table 4) of variance in fibrosis stages. The SWE and SMI models significantly predicted fibrosis stages separately. Since the probabilistic model selection parameters AIC and BIC were lower for the SMI model (AIC, 101; BIC, 111) than for the SWE model (AIC, 135; BIC, 145), the SMI scores alone predicted fibrosis stages better than the SWE values alone. The model with both SMI scores and SWE values together explained 73.2% of variance in fibrosis stages, and this multivariable model was statistically significantly better than the univariable SWE-only or SMI-only models (P<0.001) (Table 5). A univariate model was also run with other clinical and laboratory predictors of fibrosis stages (Table 4). When significant predictors were added to the final multivariate model, SWE values and SMI scores still significantly predicted fibrosis stages, and the model explained 81.5% of variance in fibrosis stages. Alb and T-Bil were also significant predictors of fibrosis stages in the final multivariate model (Table 6).
Univariate ordinal logistic regression analysis of factors associated with fibrosis stage
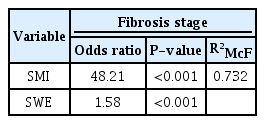
Multivariate ordinal logistic regression analysis of the effects of SMI and SWE scores on the fibrosis stage
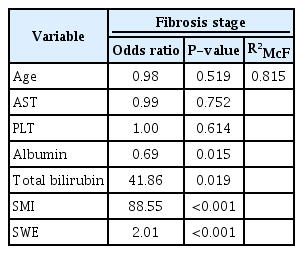
Multivariate ordinal logistic regression analysis of the effects of SMI, SWE, and other predictors on the fibrosis stage
A logistic regression model was run with the same variables for predicting inflammatory grades. The models of SWE alone, SMI alone, and both SWE and SMI explained 31%, 34%, and 37.7% of variance in inflammatory grades, respectively (Tables 4, 5). The univariate ordinal logistic regression model with other clinical and laboratory predictors of inflammatory grades is shown in Table 4. When significant predictors were added to the final multivariate model, SWE values and SMI scores still significantly predicted inflammatory grades, and the final model explained 40.5% of variance in inflammatory grades (Table 6).
Reproducibility of SMI
The κw coefficient with linear weights was calculated to determine whether there was agreement between the two radiologists' judgments (interobserver agreement) and the judgments made by one radiologist judgment between the first and second evaluations within 1 month (intraobserver agreement). Both interobserver agreement and intraobserver agreement were statistically significant (κw=0.83; 95% confidence interval [CI], 0.76 to 0.90 and κw=0.81; 95% CI, 0.74 to 0.89, respectively) and classified as excellent according to Fleiss et al. [20].
Discussion
Conventional imaging diagnostic tools do not adequately reflect liver fibrosis due to the absence of significant morphological changes associated with early-stage hepatitis, liver fibrosis, or cirrhosis. US-based imaging techniques such as SWE have been developed based on evaluating liver elasticity. Several studies have shown that the assessment of liver stiffness with SWE can replace liver biopsy, especially in patients with chronic viral hepatitis [21-24]. The results of this study are consistent with previous findings based on SWE that higher or lower liver stiffness values were associated with the degree of liver fibrosis. SWE values demonstrated high accuracy for identifying each stage of liver fibrosis in this study.
Since microvascular processes play an important role in liver fibrosis, as in many diseases, early recognition and characterization of the fibrotic process with changes in the vascular structure can assist in the initiation of timely effective medical treatments [25]. SMI is a Doppler technique that is more sensitive to low flow speeds without motion artifacts than other Doppler imaging techniques, with the added benefit of increased spatial and temporal resolution [26,27]. This technique analyzes tissue movement and uses an adaptive new algorithm to identify and eliminate it, thereby revealing the true blood flow. SMI provides high frame rates and high resolution, allowing it to image very small vascular structures. This method, which enables the evaluation of fibrosis by examining the peripheral hepatic vascular structure close to the liver surface, is a new technique that is quite different from the evaluation of morphological features in the liver tissue or liver stiffness by the elastography-based technique [16]. Kuroda et al. [17] reported that SMI enables a detailed description of vascular structures in patients with chronic liver disease, and their study showed a significant difference in the distribution of SMI patterns according to fibrosis stage. Similarly, another study showed that patients with advanced liver fibrosis had a significantly higher mean vascular score than those with early-stage liver fibrosis [16]. However, they reported that evaluation of peripheral hepatic vessels by SMI could not accurately differentiate between the early and middle stages of liver fibrosis, as in US-based elastography. This study demonstrated that the SMI vascular scores showed statistically significant differences across the four fibrosis stages (F1, F2, F3, and F4). Since SMI can show small vessels better than other Doppler techniques, it can distinguish changes from mild to severe forms of fibrosis, enabling evaluation of peripheral vessel thinning, increased tortuosity, and blunting of the vascular tree that occurs in liver fibrosis. Balik et al. [15] compared SMI with other Doppler methods for detecting small vascular structures of the liver, and showed that SMI was the best method of these Doppler applications to identify the morphological changes that occur due to chronic fibrosis [17].
While it is possible to diagnose fibrosis with the aid of biopsy, shear wave measurements and SMI Doppler can document much larger parts of the liver. This can give more accurate results than examining a small sample. This study is the first to compare the SMI Doppler method with SWE, which is widely used in the diagnosis of liver fibrosis. Compared with the predictive power of SWE and SMI in staging liver fibrosis, the SMI vascular score was superior to SWE in detecting the fibrosis stage. US elastography evaluates liver fibrosis from the perspective of pathological or physiological stiffness. US-based elastography can be affected by acute inflammation, cholestasis, cardiac dysfunction, high portal pressure, and hepatic congestion [28].
However, there are still insufficient data regarding the specific influence of histopathological findings, such as inflammation, on vascular scores in patients with liver fibrosis. Ohno et al. [29] reported that the detection of abnormal microvascular structures in the diseased liver by SMI reflects the degree of inflammation, the severity of vasculitis, or lobular rearrangement due to fibrotic changes. In the present study, a significant positive correlation was found between liver inflammation and the vascular score. In the multiple regression model, both fibrosis and inflammation were found to be significantly associated with the vascular score. In the logistic regression model for predicting inflammatory grades, the models of SWE only, SMI only, and both SWE and SMI explained 31%, 34%, and 37.7% of variance in inflammatory grades, respectively. When significant predictors were added to the final multivariate model, SWE values and SMI scores still significantly predicted inflammatory grades, and the final model explained 40.5% of variance in inflammatory grades. The high reproducibility of SMI is essential for its clinical use. To the best of the authors’ knowledge, the present study provides the first assessment of the intraobserver and interobserver agreement for vascular pattern on SMI and fibrosis staging in chronic hepatitis B patients. In this regard, the κw coefficient with linear weights was calculated to evaluate interobserver and intraobserver agreement. The present study found good to excellent interobserver repeatability (κw=0.83; 95% CI, 0.76 to 0.90) and good to excellent intraobserver repeatability (κw=0.81; 95% CI, 0.74 to 0.89) when using SMI. This points to the potential of this technique for wide clinical application.
There are several limitations in the present study. First, it was a single-center study and the number of analyzed patients studied was relatively limited. Second, all examinations were done by the same radiologist, but the images were recorded and stored in the PACS system. Thus, images could be re-evaluated by the same radiologist and a different radiologist. Interobserver and intraobserver variability were evaluated for SMI only. Previous studies of US elastography reported that interobserver variability had little effect on the results [30]. Due to the retrospective nature of this study, elastography measurements were evaluated based on the measurements recorded by a single radiologist. Although SMI shows advantages in the evaluation of microvessels and enables a detailed assessment of vessel distribution, the lack of validated standards for normal perfusion patterns in SMI is a limitation of this modality. SMI is difficult to perform in obese individuals or patients with fatty liver because of the presence of a thick layer of subcutaneous fat. For deeply located organs, increasing the distance between the probe and the organ negatively affects the image clarity of hepatic vascular structures.
In conclusion, SWE and SMI models significantly predicted fibrosis stages, with SMI scores alone showing better predictive power than SWE values alone. Considering these results, the authors suggest that SMI, like SWE, can be widely used in the evaluation of liver fibrosis in patients with chronic liver disease. These techniques can improve the diagnostic performance of conventional US and can be useful in the accurate assessment of liver fibrosis stages; therefore, they may be able to contribute to follow-up of these patients in daily practice.
Notes
Author Contributions
Conceptualization: Tosun M. Data acquisition: Tosun M, Uslu H. Data analysis or interpretation: Tosun M, Uslu H. Drafting of the manuscript: Tosun M. Critical revision of the manuscript: Tosun M, Uslu H. Approval of the final version of the manuscript: all authors.
No potential conflict of interest relevant to this article was reported.
Acknowledgements
The authors are grateful to MD Tugay Önal and Assistant Professor Ahmet Anıl Sezer for their assistance in editing the English used herein and for their help and advice concerning the content of this manuscript.
References
Article information Continued
Notes
Key point
Superb microvascular imaging (SMI), like shear wave elastography, can be widely used to evaluate liver fibrosis in patients with chronic liver disease. The SMI vascular score also significantly predicted the degree of liver inflammation.