Scale-attentional U-Net for the segmentation of the median nerve in ultrasound images
Article information

Abstract
Purpose
The aim of this study was to develop a neural network that accurately and effectively segments the median nerve in ultrasound (US) images.
Methods
In total, 1,305 images of the median nerve of 123 normal subjects were used to train and evaluate the model. Four datasets from two measurement regions (wrist and forearm) of the nerve and two US machines were used. The neural network was designed for high accuracy by combining information at multiple scales, as well as for high efficiency to prevent overfitting. The model was designed in two parts (cascaded and factorized convolutions), followed by self-attention over scale and channel features. The precision, recall, dice similarity coefficient (DSC), and Hausdorff distance (HD) were used as performance metrics. The area under the receiver operating characteristic curve (AUC) was also assessed.
Results
In the wrist datasets, the proposed network achieved 92.7% and 90.3% precision, 92.4% and 89.8% recall, DSCs of 92.3% and 89.7%, HDs of 5.158 and 4.966, and AUCs of 0.9755 and 0.9399 on two machines. In the forearm datasets, 79.3% and 87.8% precision, 76.0% and 85.0% recall, DSCs of 76.1% and 85.8%, HDs of 5.206 and 4.527, and AUCs of 0.8846 and 0.9150 were achieved. In all datasets, the model developed herein achieved better performance in terms of DSC than previous U-Net-based systems.
Conclusion
The proposed neural network yields accurate segmentation results to assist clinicians in identifying the median nerve.
Introduction
High-resolution ultrasonography (US) has evolved as a crucial tool for diagnosis, treatment, and prognostication in the field of neuromuscular medicine. From the perspective of the peripheral nerves, US not only enables the identification of anatomic structures and measurements of nerve parameters, but also provides real-time guidance for therapeutic purposes [1,2]. Despite the clinical utility of US, several limitations have been pointed out. First, annotation and measurement tasks are time-consuming and labor-intensive, and they require a relatively long learning curve to be successfully implemented. In addition, in actual clinical settings, it is often difficult to identify peripheral nerves because the morphology and echotexture of the nerves vary among individuals and often present similar US features to those of other anatomic structures (especially tendons) [3-5]. Since US parameters are annotated and measured manually, there is room for improvement in terms of efficiency and accuracy.
Deep learning can automatically learn high-level features in raw data, and has shown remarkable performance in the field of computer vision. Deep learning has been applied to US imaging of numerous anatomical structures for tasks such as classification, detection, and segmentation [6]. Deep learning-based segmentation can automatically and accurately measure the volume and shape of anatomical structures in US images. The architecture and training methods for deep-learning models for segmentation have been actively studied [7]. The U-Net and its variants are widely used as the neural architecture for base models [8-11]. Recent studies on nerve segmentation focused on adding new components to the U-Net while using standard convolutions [12-14]. However, these approaches have limitations in that they do not reflect the process in which clinicians identify peripheral nerves in actual clinical settings. If the echotexture of a nerve is not clearly recognizable, a clinician may locate the nerve based on anatomic landmarks around the nerve [15-17]. For example, when a clinician evaluates the median nerve, a structure inside the carpal tunnel, below the flexor retinaculum, and superficial to the flexor digitorum superficialis tendons and flexor pollicis longus tendons might be suspected as the nerve [18,19]. In this case, a filter with a large receptive field is required to capture relations between the region of interest and its contextual landmarks for effective segmentation. On the contrary, when a clinician tries to identify a "honeycomb appearance," a typical echotexture of peripheral nerve on axial images [15], a small receptive field is suitable for extracting detailed echotexture features. In light of this process through which clinicians identify peripheral nerves, there is a need to develop a deep learning architecture with receptive fields of various sizes to glean and combine information at multiple scales.
The goal of this study was to design a neural network that effectively captures the spatial US features of a representative peripheral nerve (i.e., the median nerve) at various scales, and to evaluate its performance. The conventional approach of simply adding filters with various receptive field sizes is expected to increase the model complexity, and thus, might increase the risk of overfitting. Moreover, US image datasets typically have limited training samples, which worsens the overfitting problem. Thus, an efficient architecture for convolutional filters was developed in order to process multi-scale features without incurring overfitting and compromising the accuracy of detecting the shape and location of the median nerve.
Materials and Methods
Compliance with Ethical Standards
This retrospective review of medical records and images was approved by the institutional review board (2020GR0389) of the authors’ affiliated institution, with a waiver of the requirement for informed consent.
Study Subjects
A computerized search of electronic medical records and picture archiving and communication systems was performed to identify patients who underwent both electrodiagnostic and US examinations of the upper extremities from March 2019 to February 2021. Among the 312 initially identified subjects, 132 subjects over 20 years of age with normal findings of median nerve conduction studies were included. Nine subjects were then excluded from the study due to a previous surgical history of the wrist and hand. Finally, a total of 123 subjects (64 men and 59 women; mean age±standard deviation [SD], 49±8 years; age range, 28 to 75 years) were included in this study.
Datasets
Although US images were retrospectively analyzed, they were collected with a consistent protocol at the time of evaluation. A rehabilitation medicine physician with more than 10 years of clinical experience in neuromuscular US (B.S.K.) performed all examinations and annotations. Subjects were scanned in a seating position with the elbow flexed to 90°, the forearm fully supinated, and the fingers slightly bent. A pillow was used to support the forearm and hand. For exact identification of the median nerve, the physician performed dynamic US scanning by slowly sweeping the transducer proximally and distally along its course. In the axial view, the cross-sectional area of the median nerve was measured around the wrist and mid-forearm levels.
The median nerve was detected using two machines: HM70A (Samsung Medison, Seoul, Korea) and miniSONO (Alpinion, Seoul, Korea), with 5-12 MHz broadband linear transducers. The HM70A system produces 442×565 images with a resolution of 150 dots per inch (DPI), whereas miniSONO provides 576×864 images with 96 DPI.
The data collection protocol was slightly different depending on which US machine was used. In order to obtain the wrist-to-forearm median nerve area ratio to screen for carpal tunnel syndrome, measurements were performed at various areas of the wrist and forearm [20,21]. Using the HM70A system, US images of the median nerve were taken at five different levels of the wrist and forearm (four around the wrist and one around the forearm): the distal wrist crease (DWC), 1 cm proximal and distal to the DWC (DWC+1 and DWC-1, respectively), 2 cm proximal to the DWC (DWC+2), and 10 cm proximal to the DWC (DWC+10) [22]. Using miniSONO, images were taken at eight different levels (five around the wrist and three around the forearm): DWC-1, DWC, DWC+1, DWC+2, DWC+3, DWC+9, DWC+10, and DWC+11. A total of 803 (162 hands of 81 subjects) using HM70A and 502 images (64 hands of 42 subjects) using miniSONO were acquired.
In total, 641 images acquired by using HM70A were used as training data and 162 images were utilized to evaluate the proposed algorithm. Next, to examine whether the proposed neural network was well adapted to images acquired from another device, 502 additional images acquired by using miniSONO were tested. Of these images, 401 were used as training data and 101 were used for validation. In brief, 1,305 US images obtained from 123 normal subjects were used to train and evaluate the model. Table 1 summarizes the datasets.

Datasets of ultrasound images of the median nerve
Neural Network Architecture for Segmentation
A newly designed neural network is proposed for the segmentation of the median nerve in US images. The proposed network applies scale-attentional convolution (described below) to the U-Net architecture [8], as shown in Fig. 1. U-Net has an encoder-decoder structure, which consists of a hierarchy of stacked convolutional and pooling layers. The convolution layers of U-Net were replaced with the scale-attentional convolution. The network was designed for high accuracy by combining information at multiple scales, as well as for high efficiency to prevent overfitting. To that end, the model was designed in two parts (cascaded and factorized convolutions), followed by self-attention over scale and channel features. Each component is described below, and Fig. 2 shows the overall architecture.
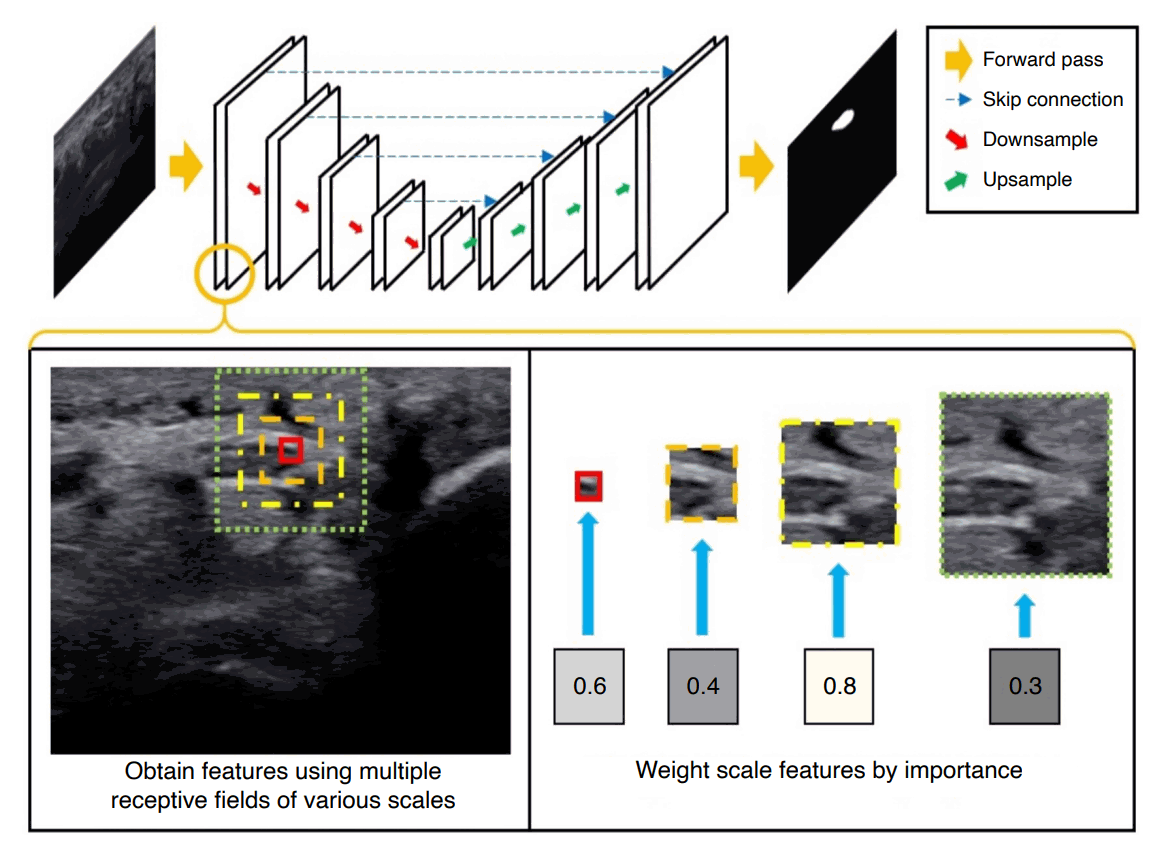
Overview of the proposed method.
The idea is to compute convolutional features over multiple scales, weight features by their importance, and combine and mix scale features to capture contextual information as well as the detailed echotexture, while enhancing the architectural efficiency to prevent overfitting. The proposed convolutional layer is integrated into the U-Net architecture for ultrasonography image segmentation.
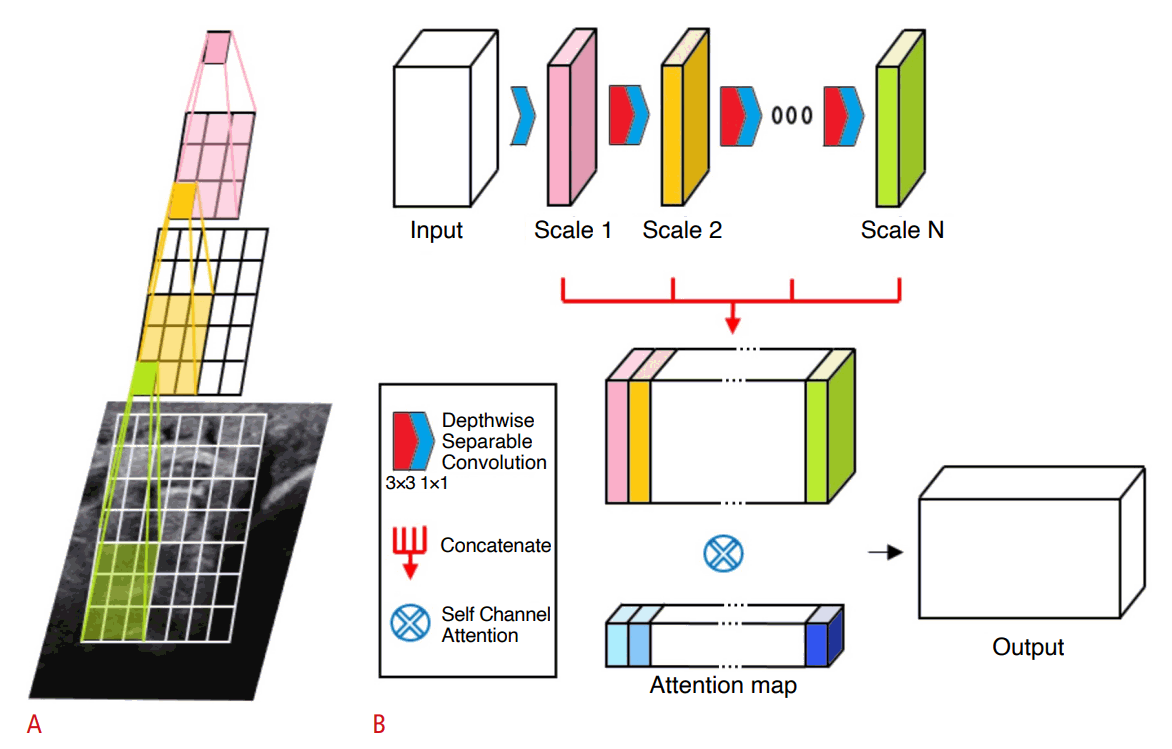
Architecture of scale-attentional convolution.
A. Cascaded convolutions are performed without nonlinearity or pooling in-between, effectively using receptive fields of varying sizes. B. Intermediate convolutional outputs form a concatenated feature map to which self-attention is applied in order to select and mix important scale features.
The decoding layers of U-Net used a combination of nearest neighbor and convolution for up-sampling, instead of transposed convolution [23,24]. A mini-batch size of 4 was used. The model was trained using the Adam optimizer with an initial learning rate of 5×10⁻⁴. Data augmentation was conducted by applying random shearing between -15° and 15° on the x-axis and y-axis, respectively.
Factorized Convolution for Multi-scale Receptive Fields
The proposed convolution layer combines features from receptive fields of multiple scales by applying cascaded convolution to the input. The i-th convolution operation of the cascaded convolutions is denoted by H(i)(·). If the input to the i-th convolution is given by x, its output is given by
where Wi represents the convolutional matrix. H(1), H(2), … are successively applied to the input. The intermediate output at n-th convolution denoted by F(n)(x) is given by
for n=1,…,N where N is the total number of cascaded convolutional operations. It should be noted that
Thus, F(n)(·) is an output of a factorized convolution, and the size of its receptive field is given as follows. Let the filter size of i-th convolutional kernel have spatial dimensions Si×Si where Si denotes the width and height of the kernel of the filter Wi. The following values were set: Si=1 for i=1 and Si=3 for i≥2. Thus, the effective receptive field size seen by F(n) is (2n-1)×(2n-1). Thus, a single layer of the proposed convolution covers and combines multiple receptive fields whose sizes are 1×1, 3×3, …, (2N-1)×(2N-1). In the baseline network, N was fixed at 4.
Weight Importance of Scales with Self-attention
A potential issue with using concatenated features is the overfitting caused by reflecting every scale to the output. A self-attention can be used to weight scale and channel features by their importance. By using attention, the proposed layer effectively "selects" and "mixes" features from various scales.
The intermediate maps F(i)(·) are concatenated to the intermediate output z. Thus, z aggregates convolutional features over various scales and channels. The self-attention is applied to z as follows.
where G denotes the self-attention weights and ⊗ denotes the Hadamard product. For weighting function G(·), efficient channel attention (ECA) was used [28]. Thus,
where CIDkdenotes 1D convolution with kernel size k, σ is a sigmoid function, and g(z) is channel-wise global average pooling. ECA is suitable for the present architecture because it focuses highly on model efficiency while capturing cross-channel dependencies to preserve performance. In summary, the proposed layer can replace the conventional convolutional layers and can be applied to any architecture aimed at balancing efficiency and performance.
Statistical Analysis
The dice similarity coefficient (DSC) was used as the performance metric. The DSC measures similarity between two sets of data [29]. It quantifies how much segmentation results overlap with labels ranging between 0 and 1. Let pi, qi denote the i-th pixel value of target image and ground truth image, respectively. pi takes value from 0 to 1 which is an output of the sigmoid function. qi represents the segmentation label and takes value 0 or 1.
The model was trained using the dice loss function L defined as L=1-DSC. The dice loss can alleviate blurred boundary problems often observed with cross-entropy loss and is effective in dealing with class imbalance (i.e., the fact that the nerves occupy only a small portion of the US images). In order to verify the reliability of the model performance evaluation, the model was tested 20 times, and the mean and SD were calculated for each performance metric.
Another metric to evaluate the accuracy for the location and shape of segmentation results is the Hausdorff distance (HD). The HD between two sets of locations is defined as the greatest of all distances from a point in one set to its closest point in the other set. In these experiments, the HD was measured between segmentation results and the labels of nerves.
Segmentation can be viewed as a binary classification per pixel [29]. That is, each pixel belongs to class 0 (background) or class 1 (median nerve). The output of the neural network for each pixel location, which takes values from 0 to 1, can be regarded as the confidence of the binary classification. Thus, it is possible to derive a receiver operating characteristic curve, or receiver operating characteristic (ROC) curve, averaged over pixels [30]. The performance of the proposed model was assessed by the area under the receiver operating characteristic curve (AUC).
Results
Segmentation Performance
Table 2 summarizes the segmentation performance achieved by the proposed method. The model achieved DSCs of 0.923, 0.761, 0.897, and 0.858 for the HM70A-Wrist, HM70A-Forearm, miniSONO-Wrist, and miniSONO-Forearm datasets, respectively. The average HD was 5.158, 5.206, 4.966, and 4.527 for HM70A-Wrist, HM70A-Forearm, miniSONO-Wrist, and miniSONO-Forearm datasets, respectively.

Segmentation performance of the proposed model
Table 3 shows that the proposed model obtained the highest recall and DSC for all the datasets-from the HM70A-Wrist dataset, which had the largest number of training samples, to the HM70A-Forearm dataset, which had the smallest number of training samples in comparison to previous architectures. The precision of the MultiRes U-Net was slightly higher than that of the proposed network with the HM70A-Wrist dataset; however, its performance on recall was relatively low in all datasets. By contrast, the proposed network achieved a good balance between precision and recall, resulting in the highest DSC in all cases. Overall, the proposed network outperformed previous U-Net models by 2.63%, 1.68%, 4.95%, and 2.01%, respectively.

Comparison of segmentation performance with other U-Net variants
Fig. 3 shows the ROC curves associated with per-pixel classification performance averaged over the test images in the four datasets. The AUCs were 0.9755, 0.8846, 0.9399, and 0.9150 for the HM70A-Wrist, HM70A-Forearm, miniSONO-Wrist, and miniSONO-Forearm datasets, respectively.

Receiver operating characteristic curve of the proposed model in four datasets.
The curves are HM70A-Wrist (A), HM70A-Forearm (B), miniSONO-Wrist (C) and miniSONO-Forearm (D), respectively. TPR, true positive rate; FPR, false positive rate; AUC, area under the receiver operating characteristic curve.
Efficiency Performance
The proposed model not only had good performance, but also was efficient in terms of model size and computational costs. The model used 491K trainable parameters, which is 19.15× more parameter-efficient than the baseline U-Net, which uses 9.4M. A model with a smaller number of parameters (i.e., a simpler model) typically leads to better generalization ability and less overfitting. The mean inference time for segmentation was 9.9 ms per image over all datasets with a single NVIDIA GeForce RTX 3090 GPU card. This would result in 101.98 frames per second if the proposed model were used for segmentation over the successive frames.
Sample Segmentation Results
Fig. 4 shows samples of segmentation results on wrist and forearm nerve images captured by two devices. The ground truth region is annotated by a green contour and the predicted region is red. In Fig. 4, the first two rows were captured by the HM70A, and the others were captured by the miniSONO. Fig. 4A-D and Fig. 4I-L show the results for wrist nerves, while Fig. 4E-H and Fig. 4M-P are the results for forearm nerves.
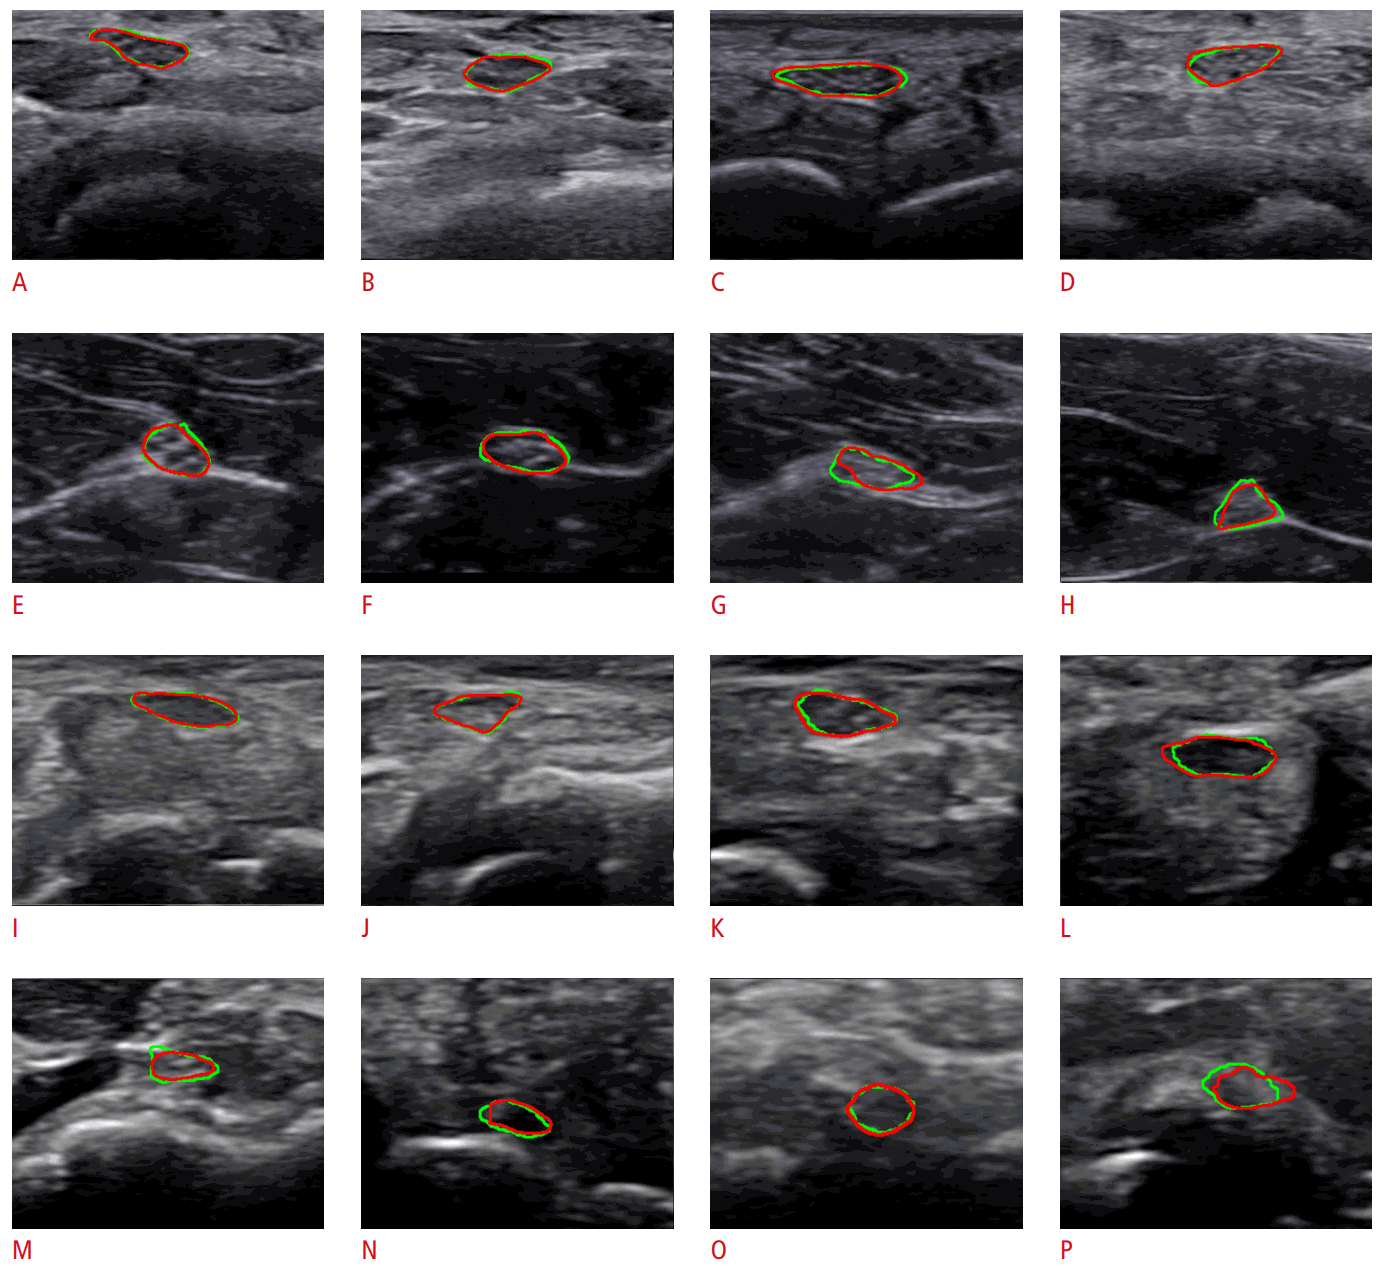
Segmentation results on the wrist with HM70A (A-D), forearm with HM70A (E-H), wrist with miniSONO (I-L), and forearm with miniSONO (M-P).
The green line is the median nerve area annotated by the expert, and the red line is the area predicted by the proposed model.
Discussion
The present study proposes a neural network architecture for the segmentation of median nerves in US images. The proposed network combines features obtained from receptive fields at multiple scales and selects important features to avoid overfitting. In wrist and forearm datasets from two US machines, the model described herein not only had the best segmentation performance compared to previous U-Net-based systems, but also was efficient in terms of model size, showing that it was effective in overcoming overfitting typically caused by limited training samples in US image datasets.
Several studies on US nerve segmentation have been conducted using U-Net. For regional anesthesia, Baby and Jereesh [31] adopted the U-Net architecture to detect the brachial plexus. The DSC was improved by 11% compared to the conventional method using a support vector machine. Kakade and Dumbali [32] used linear Gabor binary patterns for pre-processing, and applied U-Net with principal component analysis for post-processing. Zhao and Sun [12] modified the U-Net structure with the Inception module [25]. They showed that the U-Net structure could be applied to femoral nerve segmentation in a clinically meaningful manner. Wang et al. [13] improved performance in the brachial plexus segmentation by pre-processing, which removed speckle noise in US images, and modifying the U-Net architecture with a residual module [26]. The aforementioned methods showed that performance can be significantly enhanced by adopting the U-Net combined with pre-/post-processing on data. In addition, multiple U-Net variants have been proposed. U-Net++ exploited the idea of dense blocks to add more layers to skip connections [9,33]. The attention U-Net added attention gates to suppress irrelevant regions and highlight salient features [10]. The MultiRes U-Net combined output from three convolution blocks in order to extract spatial features from different scales [11].
The aforementioned architectural studies focused on adding new components to the U-Net structure while using standard convolutions. However, if the goal is to capture information at various scales ranging from structures such as peripheral nerves to contextual anatomical landmarks, the addition of these blocks will potentially increase the model size, and accordingly require more data to train. Instead, the convolution itself and the associated network architecture were redesigned with a focus on efficiency, and the analysis showed that the approach described herein pays off in a context where labeled data are scarce.
The proposed model provided segmentation results deemed to be qualitatively proper for clinical analysis, as shown in Fig. 4. The ground truths annotated by the clinician and the predicted areas mostly coincided. The discrepancies in the predictions were mostly minor and were caused by the boundary shapes. The differences might have been caused partly by limitations of the US images themselves. As nerves travel curved routes in many cases, even with high-resolution US equipment and an effort to position the probe at a right angle to the course of travel, nerves are present atypically on US. In such cases, the clinician recognizes the margin of the nerve in the form of a curve and draws it to be as close to an ellipse as possible, but an exact annotation of nerve boundaries may be difficult. In addition, since the measurement process itself (i.e., annotation along the margin) is performed manually, segmentation labels may contain errors at boundaries even when performed by a specialist. Despite the observed discrepancies between the predicted areas and the ground truths, the nerve segmentation by the proposed system is considered clinically appropriate.
Interestingly, there were several cases where the proposed algorithm identified a rare condition initially unnoticed by the physician. As shown in Fig. 5A and B, the predicted regions were more extensive than what the examiner annotated, and the prediction included adjacent masses. As the differences between the annotated and predicted areas were significant, the examiner enrolled the subjects again and follow-up evaluations were performed after obtaining informed consent. As a result, the subjects were found to have bifid median nerve, a rare anatomic variation that involves a high division of the main nerve proximal to the carpal tunnel. In this case, it is proper to perform extensive annotations including the two masses on US images, as the proposed algorithm did, because the median nerves indeed consisted of two branches. This case shows that the algorithm presented herein can assist clinicians with identifying unexpected or rare conditions.
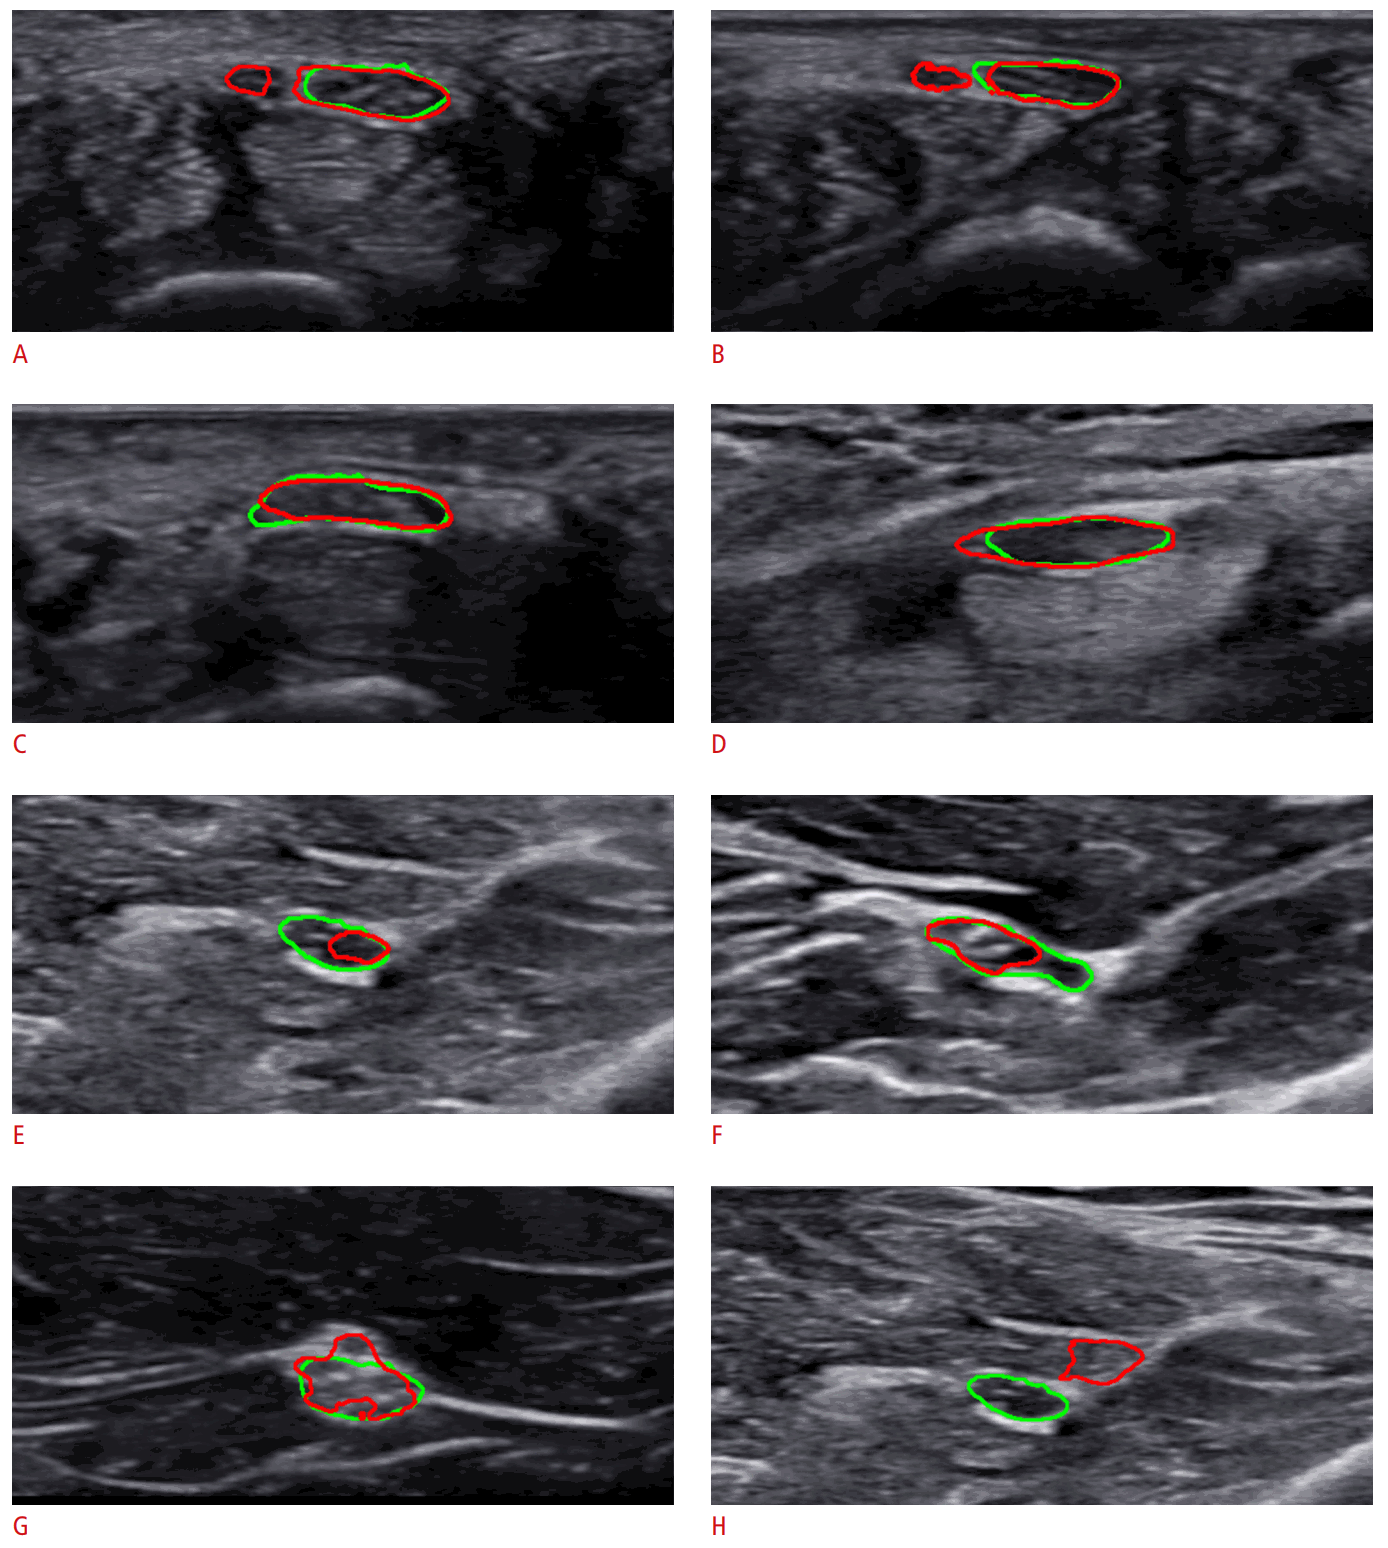
Notable cases.
A, B. Bifid median nerves are found by the proposed model. C, D. Label ambiguity is caused by subjective annotation. E, F. Perineurium is misidentified. G. Non-elliptical shape is detection. H. Nerve is detected incorrectly. The green line is the median nerve area annotated by the expert, and the red line is the area predicted by the proposed model.
There were several cases with subtle differences in the boundaries between the ground truth and prediction, most likely caused by label ambiguity. Fig. 5C and D present ambiguous cases, where it was difficult to judge whether the ground truth or the prediction was correct. When closely observed, the nerve boundaries were not clearly separated from the peripheries. In such cases, clinicians often make subjective decisions, and the examples in Fig. 5C and D are those where the predictions also provided a potentially accurate delineation.
The proposed algorithm also had some limitations, as follows. Fig. 5E and F show cases where the prediction only partially overlapped with the ground truth region. It is suspected that the algorithm mistook a certain structure inside the actual nerve as the perineurium, a sheath surrounding a nerve fascicle that was located inside the epineurium. Thus, the predicted boundary passed across the middle portion of the nerve. Fig. 5G shows a case where the prediction formed a non-elliptical region. Most clinicians recognize the nerve as an ellipse in most cases. If the margin is uneven, it is generally detected as a shape that approximates an ellipse. Instead, the algorithm predicted the nerve to be more extensive, including a small vessel on the top. Thus, the algorithm could be improved by penalizing non-elliptical shapes at the output or post-processing stage. Fig. 5H shows a rare case of a total miss (i.e., there was no overlap between the prediction and the ground truth region). In this case, both the precision and recall were 0. However, the algorithm developed herein had fewer occurrences of zero overlap than other models. The average rate of zero overlap for the proposed network was only 0.82%, whereas the rates of the other algorithms used in the experiment ranged from 1.96% to 2.95%.
Clinical applications of the proposed algorithm are expected in various contexts. Since the present algorithm showed higher accuracy and efficiency than conventional algorithms, it may be a good base model for developing automatic segmentation systems of the median nerve in the future. If a software program can be implemented on the US machine through this, the time-consuming and labor-intensive process of median nerve segmentation and measurement can be easily performed, and the burden on the examiner will be greatly reduced. This will provide a methodological basis for building a large-scale cohort database in the field of peripheral nerve US in the new era of big data. As this algorithm helps clinicians to identify the median nerve, it is expected to increase the accuracy of diagnosis and the safety of the procedure. Furthermore, the algorithm can be applied for educational purposes to shorten the learning curve for beginners of neuromuscular US.
The present study has several limitations. First, since only the median nerve was targeted, it is difficult to generalize the proposed algorith as a segmentation system for the peripheral nerves in general. Further studies on other clinically important nerves should also be conducted. Second, since the subjects of this study were limited to those with normal anatomy, its application to cases of nerve pathology (e.g., carpal tunnel syndrome) is still limited. Future studies using data from patients with neuropathy need to be conducted. Third, only data performed by one examiner were included. Further research on whether this algorithm is well suited for images collected by other examiners will be needed.
This paper proposes a new convolutional layer, which is a lightweight architecture for the segmentation of US images. Similar to how clinicians diagnose nerves, the network was able to capture and select information from multi-scale convolutional features and self-attention, as well as significantly reducing the model size and computation. The efficiency of the proposed model led to substantial performance improvements with limited training samples as compared to baseline models. Thus, the proposed network can be a useful tool to assist clinicians in diagnosis and treatment.
Notes
Author Contributions
Conceptualization: Yu M, Kim S, Baek S. Data acquisition: Kim BS, Yoon JS. Data analysis or interpretation: Kim BS, Yu M, Kim S, Yoon JS, Baek S. Drafting of the manuscript: Kim BS, Yu M, Kim S, Baek S. Critical revision of the manuscript: Kim BS, Yu M, Kim S, Yoon JS, Baek S. Approval of the final version of the manuscript: all authors.
No potential conflict of interest relevant to this article was reported.
Acknowledgements
This research was supported by Basic Science Research Program through the National Research Foundation of Korea (NRF) funded by the Ministry of Education (2020R1I1A1A01074880), the MSIT (Ministry of Science and ICT), Korea, under the ICT Creative Consilience program (IITP-2021-0-01819) supervised by the IITP (Institute for Information & Communications Technology Planning & Evaluation), and by a National Research Foundation of Korea (NRF) grant funded by the Korean government (MSIT) (No. NRF-2021R1A2C1007215).
References
Article information Continued
Notes
Key point
The proposed neural network system using deep learning showed good segmentation performance of the median nerve in ultrasound images. The proposed neural network was more efficient in terms of model size and computational costs than previous U-Net-based systems. The proposed neural network can be a useful assistive tool to assist clinicians in identifying the median nerve in ultrasound images.