Brain contrast-enhanced ultrasonography and elastography in infants
Article information
Abstract
Advanced ultrasound techniques, including brain contrast-enhanced ultrasonography and elastography, are increasingly being explored to better understand infant brain health. While conventional brain ultrasonography provides a convenient, noninvasive means of assessing major intracranial pathologies, its value in revealing functional and physiologic insights into the brain lags behind advanced imaging techniques such as magnetic resonance imaging. In this regard, contrast-enhanced ultrasonography provides highly precise functional information on macrovascular and microvascular perfusion, while brain elastography offers information on brain stiffness that may be associated with relevant physiological factors of diagnostic, therapeutic, and/or prognostic utility. This review details the technical background, current understanding and utility, and future directions of these two emerging advanced ultrasound techniques for neonatal brain applications.
Introduction
Brain ultrasonography is routinely used for neuromonitoring in infants with suspected or diagnosed brain injury. Although it offers many practical advantages, the technique is unable to provide functional insights into the brain. The integration of color and spectral Doppler ultrasonography can elucidate macrovascular flow dynamics, but changes in macrovascular flow do not always equate with those of microvascular flow and tissue health [1,2]. Alterations in cerebral microvasculature precede macrovascular flow and tissue changes in a variety of neurologic diseases. However, when enhanced with a contrast agent, ultrasonography can in fact reveal important functional insights into the brain. This emerging technique is known as brain contrast-enhanced ultrasonography (CEUS) [3,4]. CEUS uses an intravascular ultrasound contrast agent in the form of microbubbles, which at 2-3 microns in size are smaller than red blood cells, to assess tissue perfusion. Due to the small size of the microbubbles, tissue perfusion can be evaluated at the macrovascular and microvascular levels.
In the infant brain, CEUS has been used to evaluate a variety of neurologic disorders [4-6] and offers advantages over grayscale and color Doppler ultrasonography and other conventional imaging techniques. CEUS can better delineate focal and/or diffuse abnormalities than grayscale and color Doppler, and it facilitates longitudinal tracking of cerebral perfusion changes following a medical or surgical intervention or neurologic insult [3,7,8]. Further research is needed to validate the clinical utility of infant brain CEUS. In addition to its diagnostic advantages, the advantages of brain CEUS over other forms of cross-sectional imaging include portability, lack of radiation, and cost-effectiveness.
Brain elastography is another advanced ultrasonographic tool with the potential to reveal additional functional insights into the neonatal brain. This technique measures mechanical stiffness using external stress, physiologic stress, or an acoustic impulse to deform a tissue [9]. Strain elastography uses external stress from manual compression or internal physiologic motion such as respiration or the heartbeat to detect axial displacements of deforming tissue for semi-quantitative tissue stiffness measurements. Shear wave elastography (SWE) uses an acoustic radiation force, or high-intensity ultrasound pulses, to deform a tissue and generate laterally propagating shear waves in the region of interest. The speed of these propagating waves can be used to quantify tissue stiffness. A similar technique is acoustic radiation force impulse (ARFI) imaging with virtual touch quantification (VTQ), which similarly utilizes acoustic force but quantifies tissue stiffness on the basis of tissue displacement along the axis of the ultrasound beam.
In the infant brain, brain elastography has been utilized to evaluate brain stiffness in the context of normal neurodevelopment and disease diagnostics [6,10,11]. Various elastography techniques, including strain elastography and SWE, have been applied. The wide variability in scan protocols for measuring brain elasticity using SWE is one of the challenges in understanding the physiological implications of the data and advancing the clinical integration of brain elastography for diagnostics and medical management. It is important to review prior publications in the context of these technical differences to improve our knowledge base and build a standardized protocol for clinical use.
This review details the current protocols and emerging applications of brain CEUS and elastography in neonates. These two advanced ultrasound techniques, which can be readily integrated into routine brain ultrasound exams, offer distinct functional insights into the brain that can complement the anatomic information gained from conventional grayscale and color Doppler ultrasonography.
Neonatal Brain CEUS
Protocol
The brain CEUS protocol in infants has been previously described and should be tailored to each clinical question [3,4]. For instance, the presence of focal lesions necessitates targeted imaging of the region of interest during the wash-in and wash-out of contrast to assess the dynamic enhancement characteristics. On the other hand, suspicion of stroke necessitates screening the entire brain during peak enhancement, as the area of abnormality may not be known prior to scanning. The basic scan settings for brain CEUS are similar to those of abdominal applications. First, low acoustic power or mechanical index (MI) is used to prevent microbubble cavitation or destruction. Specifically, the MI is preferably maintained below <0.2 to minimize potential bioeffects in the brain [3,12]. Second, the focal zone is placed low in the field of view to prevent microbubble destruction. Third, gain should be adjusted prior to contrast injection to ensure that background noise is minimized. The injection dose depends on the patient’s weight, ultrasound transducer frequency, and the injection set-up. Large body habitus, linear or higher-frequency transducers, and smaller gauge needles with higher microbubble destruction necessitate a higher injection dose [12,13]. A bolus-based injection is used more often than an infusion-based injection, as the former is more convenient to perform and offers a better visual representation of tissue perfusion due to higher contrast concentration. The latter, however, ensures that the rate of injection is better controlled for the assessment of tissue perfusion at a steady state of flow. The number of contrast injections depends on the clinical scenario and diagnostic goals. In order to validate reproducibility of the perfusion findings obtained from the first injection, a second injection may be performed.
Hypoxic-Ischemic Injury
Hypoxic-ischemic injury affects the neonatal brain in a spatially heterogeneous manner, affecting the cortex, deep gray matter, or both. Imaging is therefore tailored to detecting both deep gray matter and cortical injuries [3,5]. The initial cine clip at the level of the basal ganglia can be used to detect basal ganglia injury, which is most prognostic of adverse neurologic outcomes in infants [14,15]. In normal infants, the basal ganglia enhances more avidly than the remainder of the brain due to the high metabolic rate (Fig. 1) [3]. Hwang et al. have shown that in the setting of hypoxic-ischemic injury, alterations in the basal ganglia to cortex perfusion ratio can be appreciated both qualitatively and quantitatively using CEUS [5,7,16]. In cases where both the cortex and basal ganglia are affected in a symmetric or diffuse manner, familiarity with normal brain perfusion in infants will be important for an accurate diagnosis (Fig. 2). A quantitative assessment of tissue perfusion can be done using either the standard time-intensity curve or advanced post-processing methods for super-resolution mapping of microvascular flow dynamics [17,18]. An age-specific normative database of cerebral perfusion in infants would be helpful for diagnosing various patterns of injuries. Since the acquisition of a large normal brain CEUS database may be challenging, normative data based on other perfusion-based imaging techniques, such as arterial spin labeling magnetic resonance imaging (MRI), may help advance CEUS-based diagnostics.

Brain contrast-enhanced ultrasonography in a normal 1-month-old boy.
A-E. Dynamic microbubble wash-in through the mid-coronal slice of the brain on a contrast-specific mode from the time of injection (A) to 20 seconds is demonstrated. B. Note that the microbubbles flow into the partially visualized circle of Willis by 6 seconds. C. By 9 seconds, relatively more avid enhancement to the basal ganglia with respect to the remainder of the brain is seen. D. Further enhancement of the cortex but with relative hyperenhancement of the basal ganglia is noted at 15 seconds. E. Wash-out of contrast from both the basal ganglia and cortex begins prior to 20 seconds. The images were obtained with an EPIQ scanner (Philips Healthcare, Bothell, WA, USA) and C5-1 transducer with settings of 12 Hz and a mechanical index of 0.06. Figure and legend adapted from Hwang M. Pediatr Radiol 2019;49:254-262, with permission of Springer Nature [3].
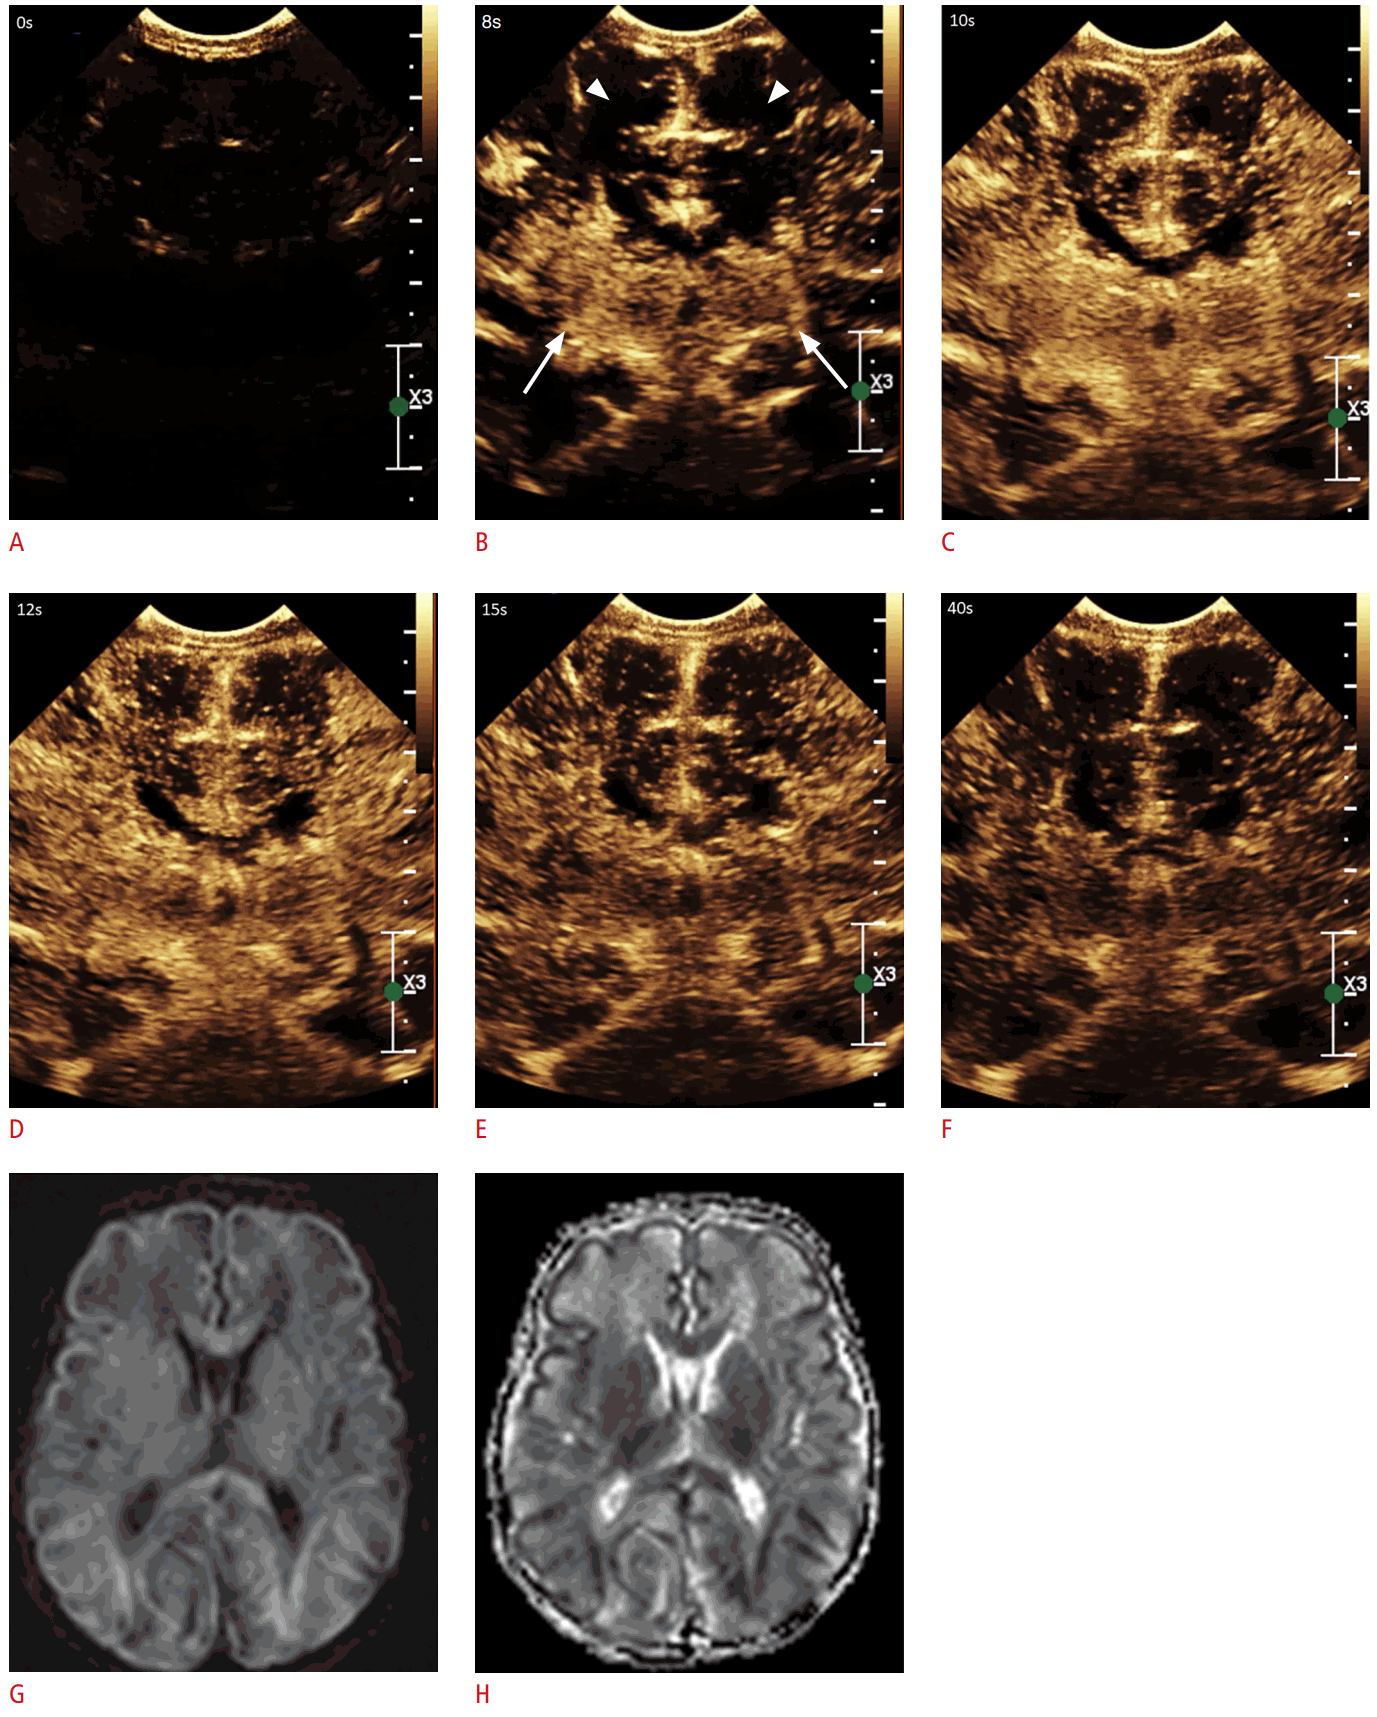
Brain contrast-enhanced ultrasonography (CEUS) in a 21-day-old male with hypoxic-ischemic injury.
A. Mid-coronal brain CEUS scan prior to contrast administration, noting few residual microbubbles from the first injection. B. The same plane at 8 seconds post-contrast administration demonstrates non-homogeneous enhancement in the basal ganglia (arrows) with a paucity of microbubbles in the cortex (arrowheads). C. The same plane at 10 seconds post-contrast administration demonstrates progressive non-homogeneous enhancement in the basal ganglia and minimal fill-in of contrast in the cortex. Note more avid enhancement of the cortical sulci/leptomeninges as compared to the cortex. D. The same plane at 12 seconds post-contrast administration demonstrates subtle wash-out of contrast in the basal ganglia, while minimal progressive fill-in of contrast in the cortical gyri more than in the cortex is observed. E. The same plane at 15 seconds post-contrast administration demonstrates progressive wash-out of contrast from both the cortex and the basal ganglia. F. The same plane at 40 seconds shows moderate wash-out of contrast from the cortex and the basal ganglia. G. Diffusion-weighted imaging (DWI) of the mid-axial brain magnetic resonance imaging shows diffuse signal abnormalities in the cortical ribbon, white matter, and basal ganglia. H. The corresponding apparent diffusion coefficient map demonstrates a low signal in the regions affected in the DWI map.
Evaluation of brain perfusion is also important for monitoring post-injury reperfusion, which can be beneficial or harmful depending on its extent and duration [7,8,19,20]. Sustained hypo- or hyper-perfusion after a hypoxic-ischemic injury is associated with permanent brain damage. While therapeutic hypothermia is the standard of care treatment for term infants with hypoxic-ischemic injury, its efficacy has not yet been validated in preterm infants [21,22]. Personalized approaches to implementing combined therapeutic hypothermia and promising adjunctive therapies are lacking in both preterm and term infants. In this regard, assessing the spatiotemporal evolution of brain perfusion on CEUS in correlation with reference standard measures of brain injury (MRI) and clinical outcomes may lead to the validation of novel diagnostic and prognostic biomarkers for improved management of preterm infants with hypoxic-ischemic injury.
Brain Death
The reference standard tests for diagnosing brain death are radionuclide cerebral blood flow studies and four-vessel cerebral angiography, which require transporting the patient out of the intensive care unit during a critical time [23,24]. Brain CEUS, instead, can be rapidly and conveniently performed at the bedside in a cost-effective manner. As with the reference standard tests, brain death would result in the absence of cerebral blood flow, but the exact timing of flow cessation, likely in a spatially heterogeneous manner, necessitates a prospective investigation comparing brain CEUS to the gold-standard tests. A prior report of an infant near brain death scanned with brain CEUS demonstrated that aside from pulsatile flow in the extracranial neck vessels, there was near absence of cerebral blood flow intracranially (Fig. 3) [23]. Microbubbles are smaller than red blood cells, measuring on average 2-3 µm in size as compared to 7-8 µm of red blood cells, and have different electrophysiological properties [25]. Although their flow velocities have been equated to those of red blood cells in vivo [26], it is unclear whether their distinct composition and properties result in similar or different spatiotemporal evolution in brain death.

Brain contrast - enhanced ultrasonography (CEUS) in a 6-month-old male after cardiac arrest.
A. Mid-coronal brain CEUS plane is shown prior to contrast administration. B. The same plane at 17 seconds post-contrast administration demonstrates flow limited to extracranial vasculature. C. The same plane at 30 seconds post-contrast administration demonstrates progressive fill-in of flow in the extracranial vessels without flow into the brain. D. The same plane at 49 seconds demonstrates progressive fill-in of flow in the extracranial vasculature with visualization of flow in a single midline intracranial vessel and faint visualization of flow in the left parasagittal brain. E. The same plane at 2 minutes and 23 seconds post-contrast administration demonstrates minimal but visible flow in the parasagittal brain and absence of flow in the remainder of the brain. There is avid but minimal wash-out of contrast in the extracranial vessels noted. Figure and legend adapted from Hwang M et al. Neuroradiol J 2018;31:578-580, with permission of SAGE Publications [23].
Hydrocephalus
Hydrocephalus is a process of excess cerebrospinal fluid buildup in the brain, potentially leading to intracranial pressure elevation. Timely shunting of cerebrospinal fluid is desired prior to irreversible brain damage. Diagnosis and neuromonitoring of hydrocephalus in infants are performed using conventional brain ultrasonography. Brain ultrasonography is sufficient for the diagnosis of ventricular dilatation, which guides ventricular shunt placement for cerebrospinal fluid diversion [27]. The timing of shunting is a practical challenge when using brain ultrasonography as the sole tool for guidance, as the degree of ventricular dilatation does not necessarily correlate with intracranial pressure or brain ischemia [28]. Clinical symptoms may be occult in preterm and term infants, posing an additional challenge to shunt guidance. Emerging preclinical and clinical efforts are underway to investigate the utility of optical-based techniques and CEUS in enhancing insights into brain health in the setting of hydrocephalus [28,29]. Due to its ability to characterize brain perfusion, brain CEUS can be used to indirectly infer information about intracranial pressure and brain ischemia (Fig. 4). Mechanical compression of the brain parenchyma due to elevated intracranial pressure results in compression of the vasculature and reduced, delayed wash-in of cerebral blood flow (Fig. 5). These differences in perfusion kinetics at the microvascular level, if quantified using advanced microbubble tracking analysis, have been shown to correlate significantly with intracranial pressure [30]. It has been shown with MRI perfusion that shunting alleviates reductions in cerebral blood flow, although the extent to which restoration is achieved depends on the etiology and duration of hydrocephalus [31]. Further work exploring the utility of brain CEUS as a tool for the diagnosis of elevated intracranial pressure and brain ischemia is needed.
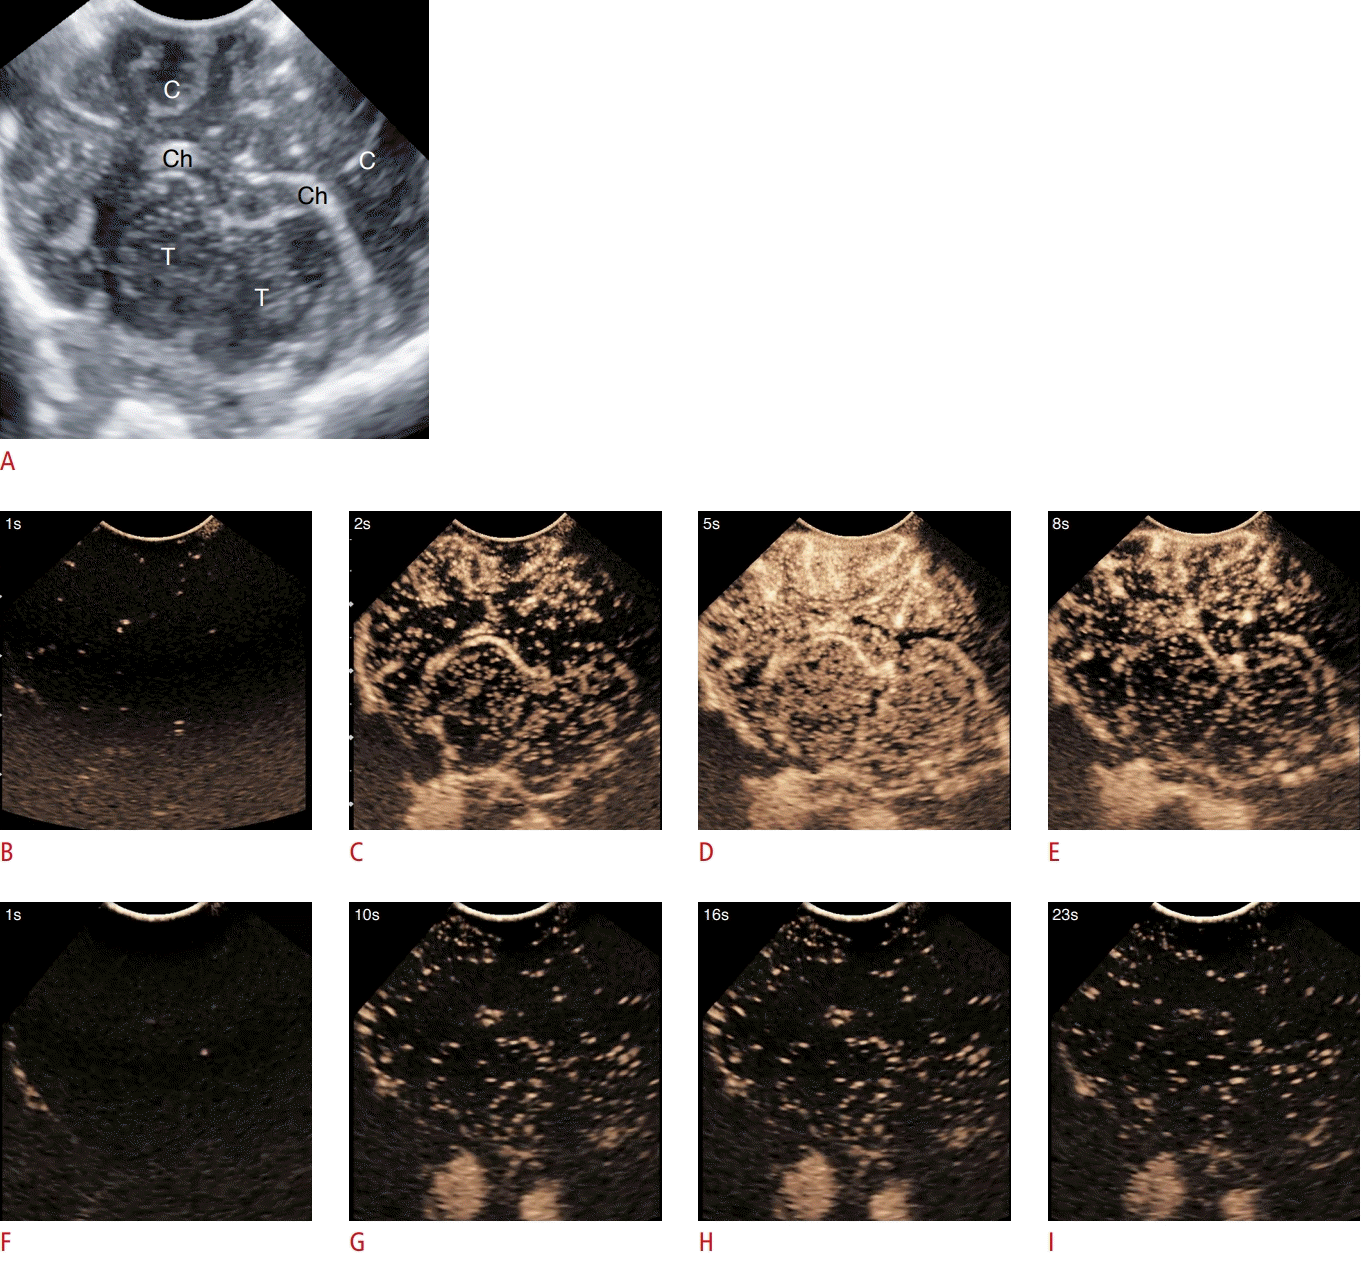
Brain contrast-enhanced ultrasonography (CEUS) in normal and hydrocephalus pigs.
A. An obliquely oriented coronal CEUS plane in the porcine brain at the level of the bilateral thalami is shown (C, cortex; Ch, choroid plexus; T, thalamus). Normal pig: B. Mid-coronal brain CEUS obtained 1 second after contrast injection. C. The same plane at 2 seconds after contrast injection shows fill-in of microbubbles in the basal ganglia and cortex. D. The same plane at 5 seconds demonstrates avid enhancement of both the basal ganglia and cortex. E. The same plane at 8 seconds demonstrates partial wash-out of contrast in both the basal ganglia and cortex. Hydrocephalus pig: F. Mid-coronal brain CEUS obtained 1 second after contrast injection. G. The same plane at 10 seconds post-contrast injection demonstrates minimal, delayed wash-in of contrast into the brain. H. The same plane at 16 seconds postcontrast injection demonstrates minimal to no progression of contrast wash-in. I. The same plane at 23 seconds demonstrates minimal to no delayed wash-out of contrast. Reduced, delayed wash-in of contrast is observed in the hydrocephalus pig as above.
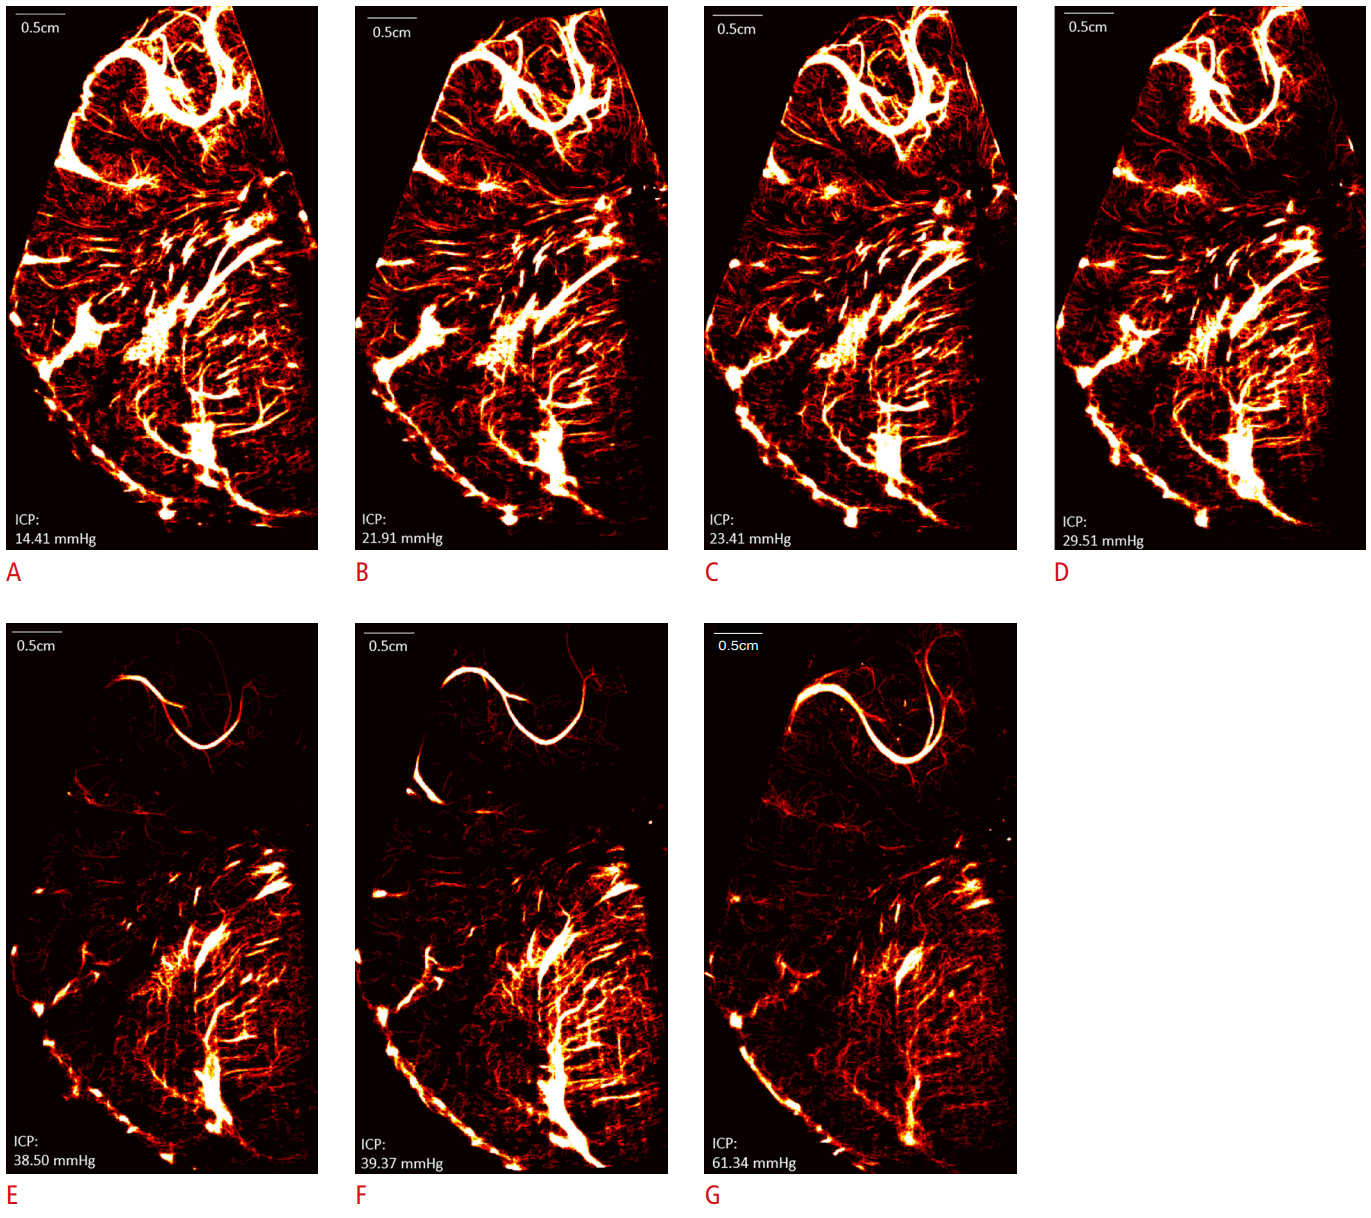
Microbubble tracking-based super-resolution brain maps in a neonatal hydrocephalus porcine model.
A-G. Series of images of the right coronal porcine brain created based on a superimposition of all the microbubble trajectories that can be tracked for more than four frames, namely indicating flow. The resulting heat maps visualize the macrovessels and microvessels, with the bright areas showing large vessels and the thinner, dimmer traces showing microvessels. Incremental intracranial pressure (ICP) elevation is performed with each image corresponding to ICP level, in increasing order from left to right. As evident on the heat maps, a progressive reduction in cerebral microvessels is noted, most evident at ICP of 38.50 mmHg (E), when the cortical microvascular flow is drastically reduced as compared to that of the thalamus.
Congenital Heart Disease
The effects of congenital heart disease and associated surgical interventions on the vulnerable developing infant brain are not fully understood. Brain MRI has been adopted to assess brain injury, which is prevalent in this population. Multimodal approaches incorporating ultrasonography, near-infrared spectroscopy, and electroencephalography are also being explored in terms of their clinical utility in assessing brain health and predicting outcomes [32,33]. Brain CEUS, despite being relatively new, has been applied to infants with congenital heart disease for intraoperative monitoring of brain perfusion during cardiac surgery (Fig. 6) [34]. The advantage of brain CEUS is the ability to examine brain perfusion at the global level such that spatially heterogeneous brain perfusion and brain ischemia can be inferred in real time at the bedside. Cerebral blood flow in the setting of congenital heart disease and surgical intervention is affected by the cardiovascular anatomy, anesthesia, co-morbidities, cerebral autoregulation, and external factors including extracorporeal membrane oxygenation support, ventilation, and medications. Understanding the pathophysiological implications of cerebral blood flow alterations in patients with congenital heart disease will undoubtedly advance researchers’ knowledge of novel imaging biomarkers with diagnostic and/or prognostic utility.
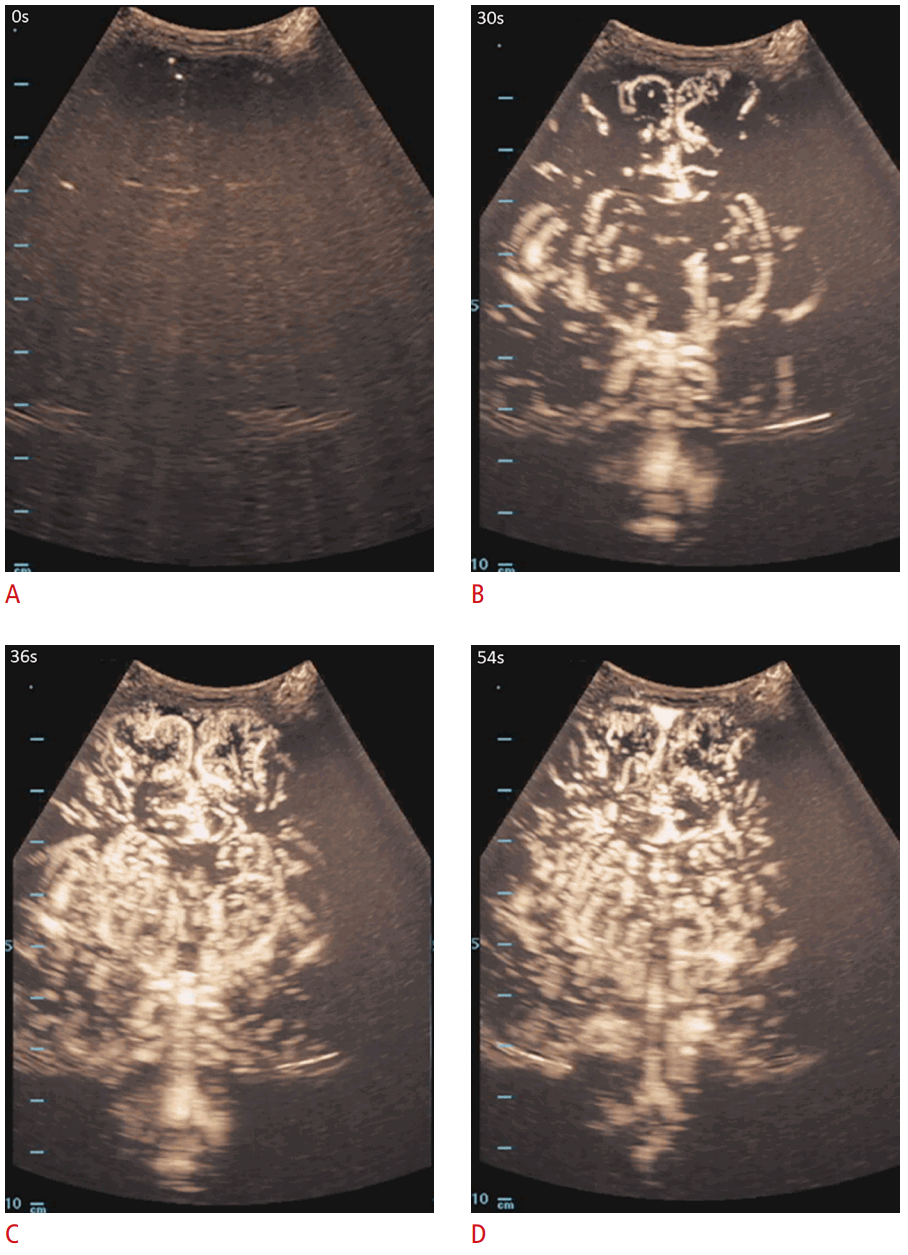
Maximum-intensity projection images of the cerebral vasculature in a 31-day-old female with transposition of the great arteries.
Mid-coronal brain contrast-enhanced ultrasonography (CEUS) images obtained during the arterial phase depict normal progressive arterial arrival of the ultrasound contrast agent. A. Mid-coronal brain CEUS obtained at 0 seconds. B. The same plane at 30 seconds demonstrates partial delineation of the deep gray nuclei more than the cortical vessels. C. The same plane at 36 seconds demonstrates interval contrast opacification of the cerebral macrovessels and microvessels in the deep gray nuclei and cortex. D. The same plane at 54 seconds demonstrates minimally decreased conspicuity of cerebral vasculature during the wash-out phase. Figure and legend adapted from Hwang M et al. Pediatr Radiol 2021;51:2270-2283, with permission of Springer Nature [4].
Extracorporeal Membrane Oxygenation Support
Extracorporeal membrane oxygenation support is used to bypass the failing heart and/or lungs in providing blood flow to the body and brain. While blood gas measurements and/or the patient’s weight may be used to determine the rate of pump and systemic blood flow, such an approach may not result in optimal cerebral blood flow and oxygenation [35]. To this end, brain CEUS may be performed during extracorporeal membrane oxygenation support to assess the spatiotemporal evolution of cerebral blood flow, detect brain injury, and/or predict intracranial catastrophes such as massive intracranial hemorrhage or brain herniation (Fig. 7). Indeed, cerebral monitoring using optical-based techniques in extracorporeal membrane oxygenation support has been applied to gain insights into cerebral autoregulation and flow-metabolism alterations with pathophysiologic implications [35]. There is a paucity of studies using CEUS, but this is mainly due to the uncertainties of microbubble stability and safety while performing brain CEUS in infants who are on extracorporeal membrane oxygenation support. In this regard, the extent to which microbubble concentration and persistence within the circuit affect the diagnostic accuracy and utility of brain CEUS necessitates further studies. Initial preclinical and clinical evidence suggests that the use of CEUS in humans is safe, without adverse effects on hemodynamics or oxygenator function [36,37].
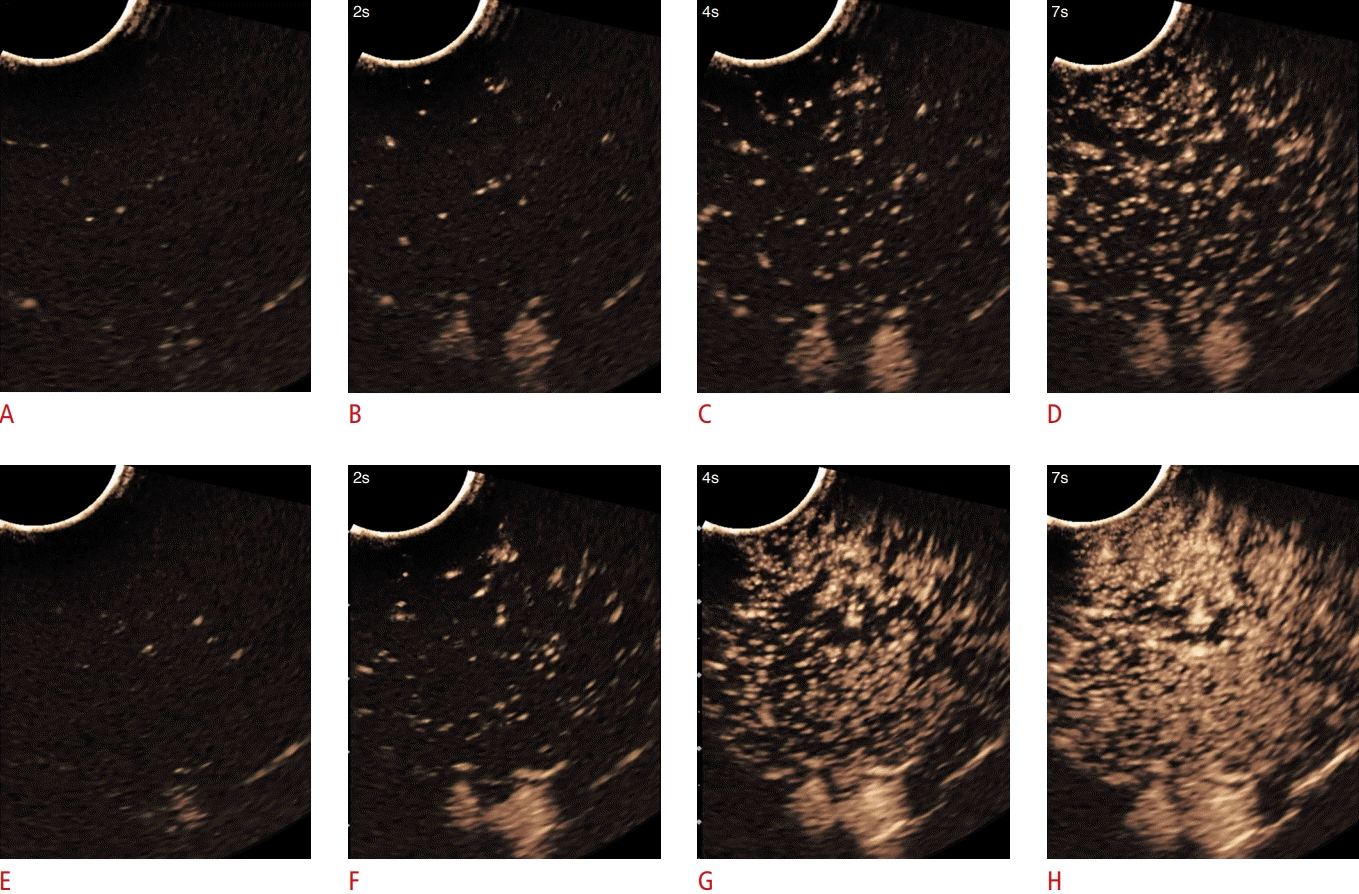
Cerebral blood flow evolution in a neonatal porcine model of extracorporeal membrane oxygenation support (ECMO).
Successive mid-coronal brain contrast-enhanced ultrasonography (CEUS) images during contrast wash-in in a neonatal porcine ECMO model maintained at the flow rate of 80 mL/kg/min. Series A through D were obtained prior to ECMO cannulation, and series E through H were obtained after ECMO cannulation. Pre-cannulation: A. Mid-coronal brain CEUS obtained immediately after contrast injection. B. The same plane obtained at 2 seconds after contrast injection shows few microbubbles in the brain. C. The same plane obtained at 4 seconds after contrast injection shows further wash-in of contrast, with much of the brain regions yet unopacified. D. The same plane obtained at 7 seconds demonstrates progressive wash-in of contrast but without opacifying the entire brain. Post-cannulation: E. The same plane obtained post-cannulation, immediately after contrast injection. F. The same plane obtained 2 seconds after contrast injection shows few microbubbles in the brain, more than the pre-cannulation period. G. The same plane obtained at 4 seconds after contrast injection shows moderate wash-in of contrast in the brain, more than the pre-cannulation period. H. The same plane obtained at 7 seconds after contrast injection shows near-complete wash-in of contrast, more than the pre-cannulation period.
Vascular Malformations
Brain MRI is routinely used to diagnose vascular malformations and monitor therapeutic efficacy. While the initial diagnosis of vascular malformations should be made with brain MRI, brain CEUS may be used for serial monitoring and assessment of therapeutic efficacy [4,38] (Fig. 8). Beyond its practical advantages, CEUS can also visualize and quantify perfusion at the macrovascular and microvascular levels. Thus, residual flow in lesion(s) and surrounding brain parenchyma post-intervention (e.g., coil embolization) can be delineated and quantified. Conventional brain ultrasonography and color Doppler ultrasonography are not sufficient for this purpose. The use of gadolinium contrast for MRI is not routine in infants. While flow in macrovessels can be inferred from conventional MRI sequences, in the absence of intravenous contrast the precision with which flow rates can be quantified is limited. In this regard, brain CEUS may be a useful adjunct tool to enhance the medical and/or surgical management of vascular malformations in infants.
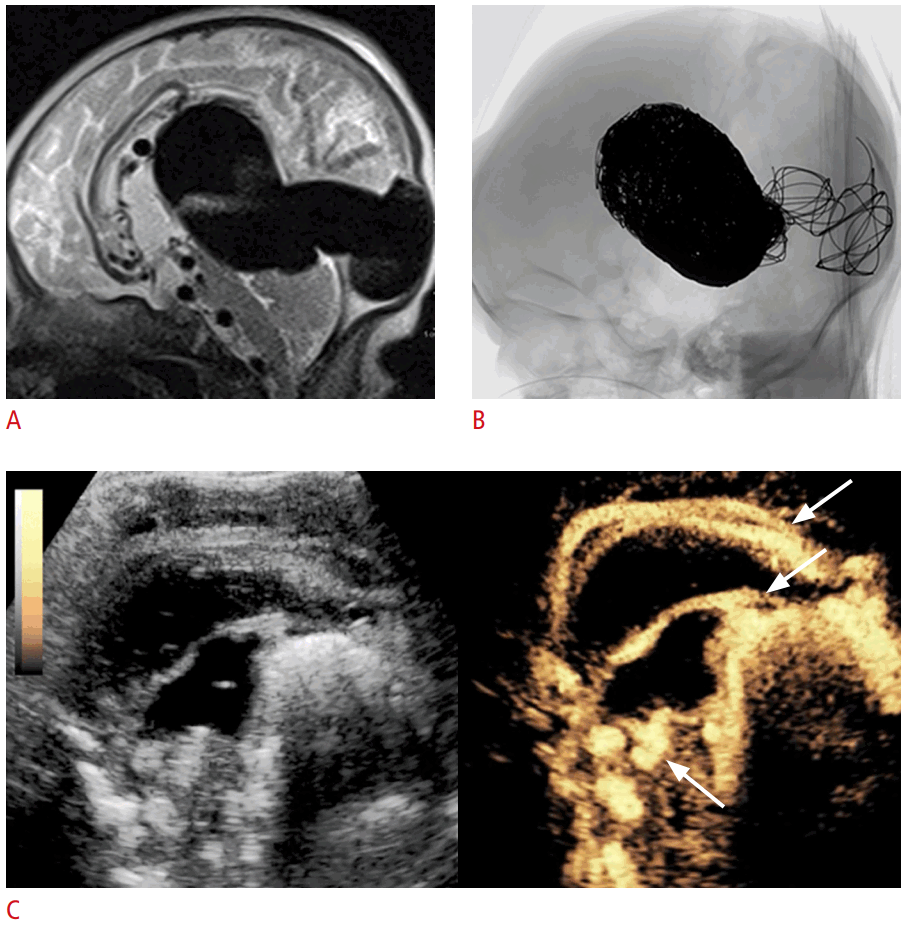
Brain contrast-enhanced ultrasonography (CEUS) evaluation of a vein of Galen malformation post-endovascular coiling in a 2-month-old male.
A. Sagittal T2-weighted magnetic resonance imaging brain sequence shows dark flow voids in a large arteriovenous malformation. B. Fluoroscopic lateral image of the brain post-endovascular coiling of the malformation is shown. C. Post-coiling sagittal CEUS with dual display of the grayscale (left) and contrast-enhanced (right) modes was obtained using the anterior fontanelle as the acoustic window to assess residual flow in the coiled arteriovenous malformation. There is small-volume residual flow within the coiled malformation, with mildly prominent parasagittal vessels (arrows, right). Figure and legend adapted from Hwang M et al. Pediatr Radiol 2021;51:2270-2283, with permission of Springer Nature [4].
Tumors
The utility of brain CEUS has been shown for diagnosis, lesional border delineation, therapeutic response monitoring, biopsy guidance, and functional characterization of tumors [39-45] (Fig. 9). Prior reports have shown the utility of brain CEUS in characterizing the border between tumors and unaffected brain parenchyma [41,45-47]. It is important to recognize, however, that the differences in perfusion do not necessarily signify the tumoral border, as perilesional edema can also result in altered perfusion. In terms of therapeutic response, serial changes in lesional perfusion, which potentially correlate with histopathological tumoral response to therapy, can be monitored. For instance, the area under the curve in time-intensity curve analysis has been correlated to tumor microvascular density [48]. Time-intensity curve analysis is a well-accepted quantification approach in which microbubble intensity in a region of interest can be quantified over time. The area under the curve denotes the total area under the time-intensity curve. More advanced quantitative approaches including super-resolution imaging, wherein microbubbles can be tracked with high spatiotemporal resolution, may also offer structural and functional insights into tumor biology for diagnostic, therapeutic, and/or prognostic purposes [49-52].
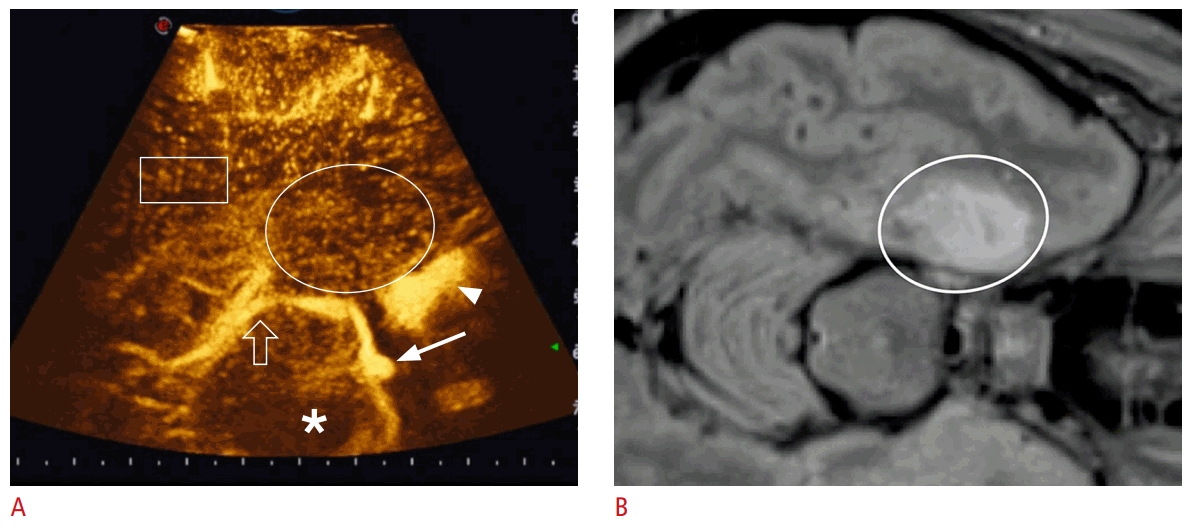
Preoperative magnetic resonancd imaging (MRI) and real-time contrast-enhanced ultrasound (CEUS), which was performed through a temporal craniotomy in a 15-year-old boy with dysembrioplastic neuroepithelial tumor (DNET).
A. Axial intraoperative CEUS image is shown (near-field: right temporal lobe). B. Co-planar axial fluid-attenuated inversion recovery MRI in the same region is shown. The DNET in the medial right temporal lobe shows high intensity (oval in B). The two imaging modalities are linked and the preoperative MRI follows the real-time CEUS as the ultrasound probe is tracked in the three-dimensional space. On CEUS, the tumor shows a similar vascularization (oval) compared to the surrounding parenchyma (rectangle). Other anatomical structures visible on CEUS: the mesencephalon (asterisk), the cavernous sinus (arrowhead) and the basilar artery (solid arrow), and the posterior cerebral arteries (open arrow). Figure and legend adapted from Hwang M et al. Pediatr Radiol 2021;51:2270-2283, with permission of Springer Nature [4].
Neonatal Brain Elastography
Protocol
The brain elastography protocol in infants is not yet standardized. There is a need to better understand the relationship between spatially heterogeneous brain elasticity and brain health during infancy. Moreover, vendor differences in semi-quantitative or quantitative brain elasticity calculations make comparisons between studies difficult. The design of a future protocol will need to take these factors into consideration, in addition to tailoring the protocol to the clinical question. For instance, the interrogation of the normative brain elasticity will differ in approach from that of intracranial pressure elevation. The former would target the geographic region of interest (i.e., white matter versus cortical development), whereas the latter would target the brain region(s) most sensitive to early intracranial pressure changes. Prior studies have utilized coronal and sagittal planes to obtain brain elasticity values, but the methods and results remain heterogeneous [53-56]. Variations in methods include differences in scanner/transducer choice, scan settings, and protocol. Further work will be needed to understand the potential impact of technical variability on the diagnostic utility of brain elastography and the biological and histopathological correlates of brain elasticity measures. When initiating prospective clinical studies using this technique, the same scan settings should be maintained if a comparison is made across patients or in the same patient longitudinally.
Brain Elasticity in Normal Development
Several studies have documented the age-dependent evolution of brain stiffness in preterm and term infants [11,54-56]. Su et al. [56] used ARFI with VTQ to demonstrate higher brain stiffness in term than preterm infants in cortical, subcortical, and white matter structures. Similar results, according to which term infants had higher brain stiffness than preterm infants, were shown by Albayrak and Kasap using SWE [54]. While further mechanistic explorations are needed to understand the temporal evolution of brain stiffness in the context of physiologic growth, the higher stiffness in term infants is attributed to greater myelination [56-58] and the possible higher water content of preterm compared to term brains. Interestingly, conflicting results have been shown with biomechanical testing or magnetic resonance elastography [59-61], wherein myelinated brain structures have demonstrated lower stiffness than non-myelinated structures. Since anisotropy, or the direction of white matter tracts, alters the elasticity results, it will be important to first understand the direction of white matter tracts in a region of interest. Evidence also suggests spatial heterogeneity in brain elasticity in both preterm and term brains [11,53-55]. Kim et al. [55] used strain elastography to evaluate stiffness in several brain regions including the caudate, subcortical, and periventricular white matter and cortical gray matter. In this study, the cortical gray matter was found to be the least stiff brain region.
Hypoxic-Ischemic Injury
Both preclinical and clinical investigations have been explored brain stiffness in response to hypoxic-ischemic injury (Fig. 10). In the preclinical setting, Martin et al. [62] showed decreased brain stiffness in the ipsilateral hemisphere after 2-hour occlusion of the middle cerebral artery [10], potentially related to liquefactive necrosis and edema [62,63]. The same study showed increased stiffness on the contralateral side, possibly the result of ipsilateral reduction in cerebral blood flow and mechanical sequelae of edema/compensatory cerebral blood flow to the contralateral side [63]. Neonatal rats that had been subjected to either ligated carotid or hypoxia for 2 hours (asphyxia) had increased brain stiffness from 3 hours after surgery until 72 hours [64] from decreased blood flow following ligation. Discrepancies may be due to differences in ischemia severity, reperfusion response, and other factors influencing brain stiffness measures. In neonates undergoing hypothermia and/or adjunctive neuroprotective therapies, there may also be confounding effects of medical interventions affecting brain elasticity values. In future evaluations, it will be important to remember that brain elasticity may be altered by a variety of intra- and extra-vascular compartmental factors in a spatiotemporally dynamic fashion.
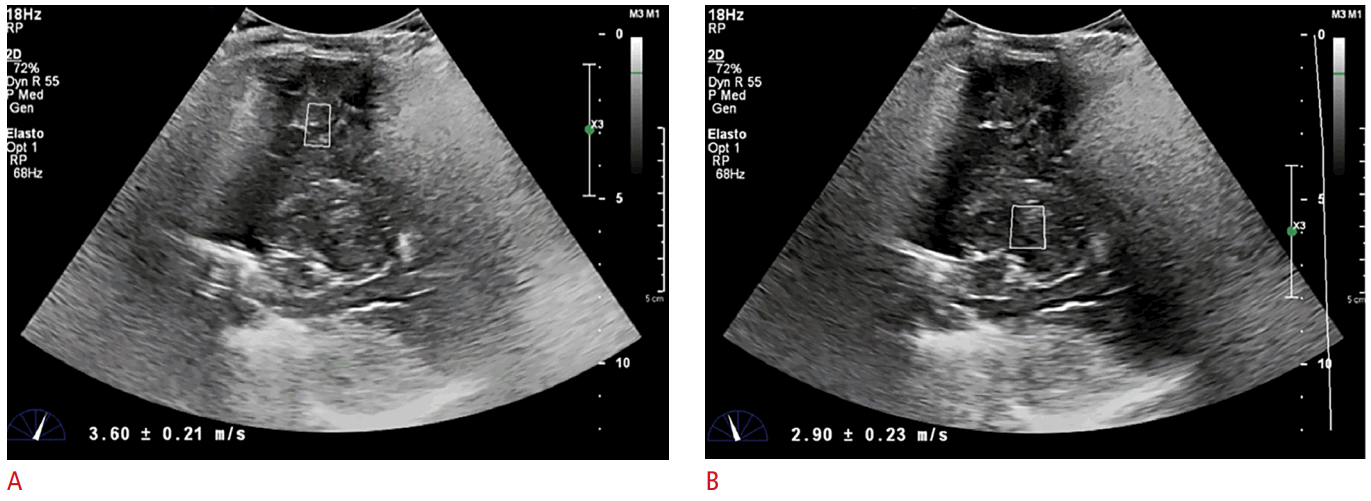
Ultrasound elastography of a 6-month former 37-week gestational infant after cardiac arrest and severe anoxia.
Brain elastography was performed 30 minutes after return of spontaneous circulation. A. Sagittal brain ultrasonography at the level of the thalamus shows a cortical gray/white matter elasticity value of 3.6±0.21 m/s. B. Sagittal brain ultrasonography at the level of the thalamus shows a deep gray nuclei elasticity value of 2.9±0.23 m/s. Figure and legend adapted from deCampo D and Hwang M. Pediatr Neurol 2018;86:19-26, with permission of Elsevier [10].
Hydrocephalus
While there is a paucity of data exploring the clinical utility of brain elastography in neonatal hydrocephalus, the adult and preclinical literature demonstrate the potential value of this technique in the clinical management of this disease. Disease-related alterations in brain stiffness have been shown in acute obstructive hydrocephalus, normal-pressure hydrocephalus, and low-pressure hydrocephalus, alluding to its role in early diagnosis or disease monitoring [65-69]. Limited information is available regarding the role of brain elastography in studying the effects of ventricular shunting or guiding the timing of shunting [70]. Since hydrocephalus involves excess cerebrospinal fluid buildup, resulting in mechanical deformation of the brain tissue and subsequent elevation in intracranial pressure, brain elastography may reveal important insights into the brain in hydrocephalus (Fig. 11). While further work is needed, the etiology of hydrocephalus and the timing of brain elastography measurement in the context of disease evolution will likely alter the results obtained.
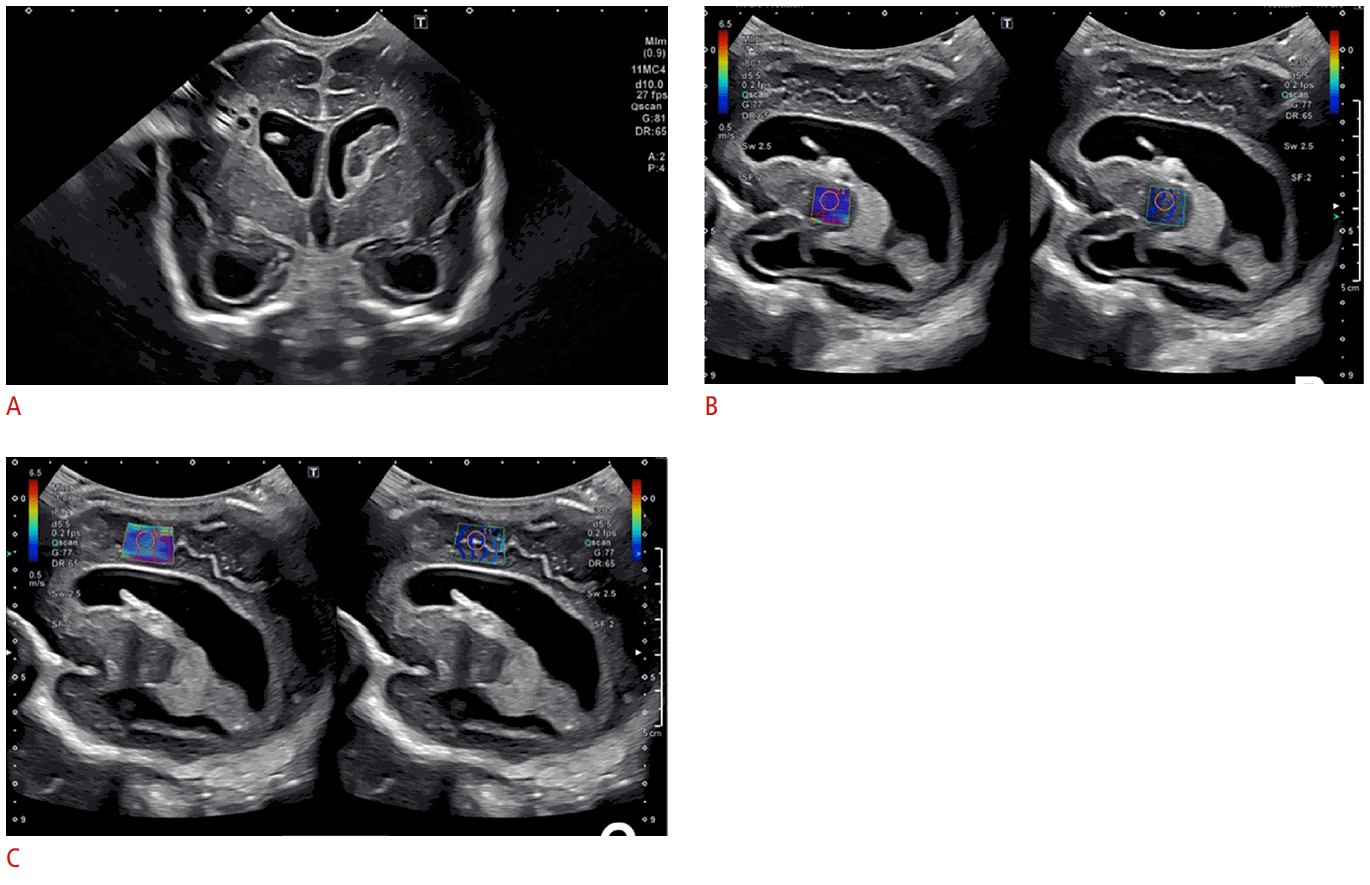
Ultrasound elastography of a 2-month-old, former 28-week and 4-day-old male infant following shunt placement for treatment of post-hemorrhagic hydrocephalus.
A. Ultrasound image shows right shunt catheter placement in the right frontal horn. Cystic changes can also be seen from the right frontal periventricular infarct. Initial head ultrasonography at 29 days of life showed dilated ventricles. Over the next several days, his head circumference increased. A subsequent ultrasound examination 14 days later showed moderate ventriculomegaly. He underwent a shunt placement at 44 days of life. Measurements were made over (B) the right basal ganglia, with a value of 1.55 m/s and (C) the periventricular white matter with a value of 2.18 m/s (C). Figure and legend adapted from deCamp and Hwang. Pediatr Neurol 2018;86:19-26, with permission of Elsevier [10].
Biosafety
At present, ultrasound elastography is approved by the U.S. Food and Drug Administration for the evaluation of abdominal organs, but is not yet approved for brain applications. The safety concerns are similar to those for conventional grayscale and Doppler ultrasonography, with the goal of minimizing the potential thermal and mechanical effects of the acoustic beam, as measured using the thermal index (TI) and MI [71], respectively. The TI and MI settings used in neonatal brain elastography are within the safety guidelines of ultrasound societies and the U.S. Food and Drug Administration [72,73], but careful consideration of the potential bioeffects in the vulnerable neonatal brain is warranted nonetheless. Biosafety considerations should be taken into account in designing the scan duration and parameters for brain elastography protocols. A previous study examined the bioeffects of various scan durations (10, 20, and 30 minutes) of brain elastography in neonatal mice [74]. In this study, no histologic evidence of injury was observed when specimens were obtained at 24 hours and 3 months after scanning. However, changes in the expression of select proteins involved in the mTOR pathway and neuronal development were observed 24 hours, but not 3 months after scanning. No behavioral alterations as measured by the Morris water maze test in these mice were observed. Further work will be needed to reproduce the clinical scan conditions, which likely consist of a scan duration of seconds to less than a few minutes, and in larger animal models mimicking the gyral morphology and size of an infant brain. In another study, transient elevations in the expression of genes involved in synaptic function in the hippocampus were observed in mice subjected to 10 minutes of elastography scanning [75]. However, those effects were transient, without observable changes in expression levels or behavior at 24 hours. Although this is a relatively safe technique, the preliminary finding from the neonatal mouse model raises the important consideration of imaging gently and necessitates obtaining further knowledge of the acoustic settings and parameters that avoid bioeffects in the vulnerable brain.
Conclusion
Brain CEUS and elastography permit the bedside evaluation of cerebral function in neonates with brain injuries. The exact means by which these two techniques can inform clinicians about neurodevelopment and brain health will be elucidated by carefully designed prospective preclinical and clinical studies. Preliminary evidence is promising toward advancing these tools for diagnostic use in the clinical setting. With the incorporation of biosafety considerations, these techniques may prove to be a useful adjunct to existing modalities for improving shared understanding of neonatal brain health.
Notes
Author Contributions
Conceptualization: Hwang M. Data acquisition: Hwang M, Zhang Z, Freeman C, Kilbaugh T. Data analysis or interpretation: Hwang M, Zhang Z, Katz J, Kilbaugh T. Drafting of the manuscript: Hwang M. Critical revision of the manuscript: Hwang M, Zhang Z, Katz J, Freeman C, Kilbaugh T. Approval of the final version of the manuscript: all authors.
No potential conflict of interest relevant to this article was reported.
References
Article information Continued
Notes
Key point
Brain contrast-enhanced ultrasound enables characterization of cerebral macro- and microvascular flow, thereby revealing functional and physiologic insights into the infant brain. Brain elastography assesses tissue stiffness which is correlated with normal and abnormal neurodevelopment in infants.
