The reproducibility of shear wave and strain elastography in epidermal cysts
Article information

Abstract
Purpose
This study evaluated epidermal cyst elasticity using multiple parameters of strain elastography (SE) and shear wave elastography (SWE) and assessed the reproducibility of each parameter.
Methods
This retrospective study included 73 patients with epidermal cysts who underwent SE and SWE. SE scores were classified as 1-4 according to elasticity. The strain ratio was evaluated using the elasticity ratio of lesions and adjacent subcutaneous fat tissue. For SWE, the shear wave velocity (m/s), elasticity (kPa) according to the Young modulus, velocity ratio, and elasticity ratio were evaluated. All values were measured twice. The reproducibility of SE and SWE measurements was assessed. The relationships among SE and SWE measurements were evaluated.
Results
The strain ratio on SE images showed good reproducibility (intra-class correlation coefficient [ICC]=0.789), and SE scores showed substantial reproducibility (kappa=0.753 and kappa=0.758 for readers 1 and 2, respectively). Moderate reproducibility was found for shear wave velocity and elasticity (ICC=0.750 and ICC=0.648, respectively), as well as for the shear wave velocity of the reference tissue and velocity ratio (ICC=0.747 and ICC=0.713, respectively). All SE scores were positively correlated with the strain ratio (P<0.001). The strain ratio in the second SE session was significantly correlated with the elasticity ratio and velocity ratio in the first SWE session (r=0.245, P=0.037; r=0.243, P=0.038, respectively). Other variables were not correlated.
Conclusion
SE and SWE parameters of epidermal cysts showed moderate to good reproducibility. The strain ratio on SE showed good reproducibility and could provide relatively objective and consistent measurements of epidermal cyst elasticity.
Introduction
Epidermal cysts are one of the most common and benign cutaneous tumor-like lesions. Although most epidermal cysts remain asymptomatic, some lesions may grow large enough to compress surrounding structures, become inflamed or rupture, and thus become painful with ulceration of the epithelial lining [1]. The cosmetic outcome after excisional biopsy of an epidermal cyst is less favorable in inflamed or ruptured cases because of indistinct margins, more friable walls, and the difficulty of achieving complete removal with inflammation and fibrosis of the surrounding tissue [2,3]. In these cases, excision is the treatment of choice.
Epidermal cysts usually have a superficial location, and ultrasonography (US) can show these lesions with high resolution [4]. The US features of epidermal cysts have been described in previous reports [5-7], and several recent studies have explored epidermal cysts with ultrasound elastography (EUS), which provides additional information [2,4,8-10]. EUS is a noninvasive method that provides information on tissue elasticity or stiffness [11,12]. It is divided into strain elastography (SE) and shear wave elastography (SWE). SE is based on low-frequency compression of tissue during the application of a manual compression-release force; thus, it is operator-dependent. To overcome this shortcoming, SE can measure the relative strain ratio of the target and reference tissues [11-13]. In SWE, a push pulse is generated by the ultrasound probe, which travels through the tissue, and shear waves propagate perpendicular to the axial displacement caused by the ultrasound pulse. This technique can be presented in both qualitative color-coded maps and quantitative maps of either shear wave velocity (cm/s) or elasticity (kPa) [12,14]. Therefore, EUS allows qualitative and quantitative measurements of mechanical tissue properties.
Previous studies suggesting that EUS may be useful for evaluating epidermal cysts only used SE or SWE [2,4,8-10,15], and research on the reproducibility of each EUS method for epidermal cysts is insufficient. Thus, the aim of this study was to evaluate the elasticity of epidermal cysts using each parameter of SE and SWE and to assess the reproducibility of each parameter. The relationships among the parameters on SE and SWE were also evaluated.
Materials and Methods
Compliance with Ethical Standards
This study was approved by the institutional ethics review board of the authors’ affiliated hospital, and the requirement for informed consent was waived because of Kangbuk Samsung Hospital (IRB KBSMC 2021-11-034) the retrospective nature of the study.
Case Selection
The US images of 95 surgically confirmed epidermal cysts between February 2021 and July 2021 were retrospectively evaluated. Among them, 22 cases were excluded due to a lack of SE and SWE data, and 73 cases (male:female=49:24; mean age, 47.32±17.21 years; range, 13 to 84 years) were finally included in this study.
US Examination
Two musculoskeletal radiologists with 17 years and 10 years of experience, respectively, in musculoskeletal sections performed US examinations using a LOGIQ E10 imaging device (GE Medical System, Milwaukee, WI, USA) equipped with linear 6-15 MHz probes. Both radiologists were trained in SE and SWE with the US applicator to minimize motion artifacts on SWE and applied standardized compression on SE for 1 month before case enrollment. Subsequently, US examinations were performed by one of two radiologists. Gray-scale, SE, and SWE images were obtained at the same time. The gray-scale images were obtained in the longitudinal and transverse planes. The largest length and height of the lesion were measured, and the height-to-length ratio was calculated. For SE images, the force transmitted to the lesions was adjusted appropriately according to a pressure graph or box with a series of light vertical pressures applied to the lesion, followed by decompression. A visual indicator on the right lower corner of the US screen qualitatively displayed the degree of compression. The relative stiffness of the lesion was displayed as a color-coded representation, ranging from blue (high elasticity) to red (low elasticity) in a continuous spectrum. The color scales of SE images were classified into four grades (1-4) according to elasticity [10]: a score of 1 (high elasticity), predominantly blue with a few small areas of green (>70% of the total lesion area); a score of 2 (moderately high elasticity), more blue than green but not predominant with a few small areas of blue in the region of interest (ROI) (between 50% and 70% in the ROI); a score of 3 (moderately low elasticity), more green than blue but not predominant; and a score of 4 (low elasticity), predominantly green to red in the ROI. To assess the strain ratio on SE images, a circular ROI with an area of 0.2-3 cm2 was placed within the most representative portion of the lesion, using the adjacent subcutaneous fat tissue as reference tissue. In SWE, the transducer was placed on the skin without compressing the tissue. All patients were instructed to hold their breath for 5-10 seconds. The rectangular color box was positioned at the area covered by the lesion. Blue and red colors signified the softness and hardness of the lesion, respectively. A circular ROI with an area of 0.2-3 cm2 was placed within the most representative portion of the lesion and adjacent subcutaneous fat tissue, similarly to the SE images. The shear wave velocity and elasticity according to the Young modulus for each ROI were measured automatically. The SWE values were presented as mean velocity in meters per second (m/s) and elasticity in kilopascals (kPa) of the ROI. SE and SWE images were obtained at least twice for each lesion to collect reproducible images, and after the US examination, a pair of the best-fit B-mode elastogram images with a satisfactory degree of compression was selected [16]. SE and SWE images were obtained sequentially with a short break.
Statistical Analysis
Differences in SE and SWE values according to lesion locations were evaluated using one-way analysis of variance and the Scheffé post-hoc test. SE scores were evaluated by two radiologists independently. The inter-reader agreement and reproducibility of SE scores (color map) were analyzed using weighted kappa statistics. Kappa values of 0.00-0.01 indicated poor agreement; 0.01-0.20, slight; 0.21-0.40, fair; 0.41-0.60, moderate; 0.61-0.80, substantial; and 0.81-1.0, almost perfect agreement [17]. The strain ratio of SE and SWE values was evaluated from the images acquired by one radiologist. The intra-class correlation coefficient (ICC) from a two-way random-effects model was used to measure the reproducibility of the strain ratio, shear wave velocity, elasticity, velocity ratio, and elasticity ratio of SWE images. ICC values <0.5 were indicative of poor reproducibility; ICC values 0.5-0.75 indicated moderate reproducibility, ICC values 0.75-0.9 indicated good reproducibility, and ICC values >0.9 indicated excellent reproducibility [18]. The correlations among SE scores, strain ratio, shear wave velocity ratio, and elasticity ratio were analyzed using the Spearman rank correlation coefficient. Data analyses were performed using SPSS version 24.0 (IBM Corp., Armonk, NY, USA), and P-values ≤0.05 were considered statistically significant.
Results
The mean height and length of the epidermal cysts were 9.00±8.05 mm and 17.74±11.05 mm, respectively. The mean height-to-length ratio was 0.54±0.19 (range, 0.15 to 1.00). The locations of the epidermal cysts are shown in Table 1. There were no significant differences between the SE and SWE findings of epidermal cysts according to location (P>0.05). The mean SE scores of the epidermal cysts are presented in Table 2. The inter-reader agreement for the SE score in each session and the inter-session reproducibility of SE score for both readers were substantial (Table 2). The reproducibility of the strain ratio on SE images, shear wave velocity, elasticity on SWE images, and the elasticity ratio are shown in Table 3. The mean values of elasticity of epidermal cysts were 118.95±125.88 kPa and 135.57±147.25 kPa (sessions 1 and 2, respectively) (Table 3). The strain ratio on SE images showed good reproducibility (Fig. 1). Moderate reproducibility was found for the shear wave velocity and elasticity of epidermal cysts, as well as the shear wave velocity for the reference tissue and velocity ratio. The reproducibility of the elasticity of the reference tissue was good, and the elasticity ratio was moderately reproducible. All SE scores were positively correlated with the strain ratio (reader 1, first session, r=0.568; reader 1, second session, r=0.566; reader 2, first session, r=0.476; reader 2, second session, r=0.648; P<0.001, respectively) (Fig. 2). The strain ratio in the second session was significantly correlated with the elasticity ratio and velocity ratio in the first session of SWE (r=0.245, P=0.037; r=0.243, P=0.038, respectively). The other combinations of the strain ratio and SWE values were not significantly correlated with each other (P>0.05) (Table 4).

SE and SWE findings according to epidermal cyst location
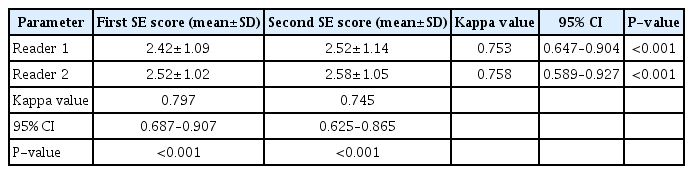
SE score reproducibility for each reader

Reproducibility of strain ratio and SWE
A 28-year-old woman presented with an epidermal cyst in the left lateral neck.
A partially irregular hypoechoic lesion is seen in the subcutaneous tissue and dermis. The first session of strain elastography (SE) yielded a score of grade 3 with a strain ratio of 1.8 (A). The second session showed an SE score of 3 and a strain ratio of 1.6 (B). The first session of shear wave elastography resulted in values of 14.36 kPa and 2.19 m/s (C) and the second session yielded values of 19.69 kPa and 2.56 m/s in the lesion (D).
Relationship between strain elastography (SE) scores and strain ratio.
The SE score was positively correlated with strain ratio in both the first (A) and second (B) sessions.

Correlations between the strain ratio and SWE value
Discussion
SE is the most common technique allowing real-time visualization of images for evaluating tissue stiffness in the musculoskeletal system [9,12,19]. SE has been more commonly used than SWE in EUS studies of epidermal cysts. SE can detect differences in tissue elasticity between ruptured and unruptured epidermal cysts [2]. The SE score may be useful for distinguishing ruptured epidermal cysts from superficial abscesses [8], and SE scores revealed the softer nature of epidermal cysts compared with malignant soft-tissue tumors [10]. In a study using SWE, epidermal cysts showed greater median shear moduli than ganglion cysts and lipomatous tumors [4].
In this study, the SE scores of epidermal cysts showed similar distributions between grades 1-2 and 3-4 (reader 1, 52.5% vs. 50.8%; reader 2, 50.8% vs. 49.2%, respectively). This finding is similar to the results reported by Park et al. [10], which were 48% versus 52% for reader 1 and 56% versus 44% for reader 2. In this study, the median strain ratios of epidermal cysts compared with the adjacent subcutaneous tissue were 1 and 0.8 (session 1 and 2, respectively), and 58.9% and 57.5% of cases (session 1 and 2, respectively) showed a value of 1 or less, which means that more than 50% of cysts were softer than the reference tissue. On SWE, the median velocities of epidermal cysts on SWE images were 5.25 m/s and 4.64 m/s (sessions 1 and 2, respectively), and the median Young moduli were 64.22 kPa and 64.46 kPa (sessions 1 and 2, respectively), which were comparable to the median shear modulus of 23.7 kPa reported by Yeoh et al. [4]. There were no significant differences in SE score, strain ratio, and SWE measurements according to the cyst location. Epidermal cysts are among the most common superficial tumors of the musculoskeletal system. Obtaining basic information on the elasticity of epidermal cysts on SE and SWE may help achieve accurate diagnoses, including the identification of complications and clarification of the differential diagnosis [2,8-10].
Previous studies have compared the diagnostic performance of SE and SWE. In a phantom study, Carlsen et al. [20] reported that the strain ratio and SWE showed equivalent diagnostic accuracy at intermediate elasticity levels, whereas the strain ratio was better than SWE at hard and soft levels. Chang et al. [21] reported that the diagnostic performances of elasticity scores from SE and SWE were similar for the differentiation of benign and malignant breast lesions. However, no study has used both SE and SWE to measure epidermal cysts. In this study, the strain ratio of epidermal cysts showed good inter-session reproducibility, and its reproducibility was better than that of SE scores and SWE values (Tables 2, 3).
Therefore, the strain ratio could provide a relatively consistent value for evaluating epidermal cysts. Furthermore, the SE score also showed substantial reproducibility and was significantly correlated with the strain ratio (Fig. 2), implying that SE could be used alone to assess the elasticity of epidermal cysts.
In the present study, the range of elasticity of epidermal cysts was 1.8 to 507.0 kPa (session 1) and 1.3 to 575.2 kPa (session 2), and the SWE values of epidermal cysts shower lower reproducibility than those of the reference tissue. Alrashed and Alfuraih [22] reported that shallow (1.5 cm) inclusions showed lower variability in SWE measurements than deep (5 cm) inclusions. They also reported that the high percentage of disagreement for deep inclusions could have been due to the failure of the GE machine to accurately measure deep inclusions. However, in the present study, the mean depth was 9 mm, corresponding to a more superficial location than in the previous study, and this discrepancy makes it difficult to directly compare these results between studies. US and EUS of musculoskeletal system require the use of a large amount of gel to create a uniform surface and to reduce pressure on the tissue [12]. Most epidermal cysts are located in the subcutaneous tissue and partially in the dermal layer, and SWE images of epidermal cysts empirically seem to be more influenced by a sufficient gel-filled space and uniformity of the contact area of the probe than SE [20,22]. Furthermore, the area covered by the elastogram box is important, and care must be taken not to include the gel in the elastogram box, as the ROI appears quite stiff compared to the get in EUS [12]. There was no significant difference in the overall SWE values according to the cyst location; however, the SWE values were quite different between more superficial locations with a curved or pointed surface (e.g., the face) and deeper locations (e.g., the buttock). The reference tissue was the adjacent subcutaneous fat tissue, but the proportion of epidermal cyst content could be variable. These differences may have led to the lower reproducibility of SWE values of epidermal cysts.
The reproducibility of the shear wave velocity was superior to that of elasticity, which is expressed by the Young modulus. In soft tissue, two modes of wave propagation occur: longitudinal waves, in which the particles oscillate in the direction of wave propagation, and transverse waves, where the particles oscillate in the direction transverse to wave propagation. The transverse wave propagation seed is called the shear wave speed (cs, m/s). The shear modulus is defined as the ratio of stress to strain, which is given by
In evaluating the relationships among strain ratio on SE, shear wave velocity ratio, and elasticity ratio on SWE, only one of the four combinations showed a significant association (Table 4). The strain ratio on SE and the shear wave velocity ratio on SWE were not always related. Furthermore, the elasticity ratio on SWE had the lowest reproducibility. Previous studies used the shear wave velocity or elasticity rather than their ratio to evaluate tissue stiffness on SWE [14,22,23]. Therefore, obtaining the velocity ratio or elasticity ratio on SWE of epidermal cysts may not always be necessary to assess tissue stiffness because of inconsistencies. Although the exact reason is unknown, an explanation may be the lower reproducibility of SWE values than the strain ratio. Furthermore, as mentioned above, SWE values of epidermal cysts seem to be more affected by probe contact and the ROI of elastogram box.
This study has some limitations. First, this was a retrospective study with a small sample size. Second, using the ROI may have influenced the values of the strain ratio and SWE. However, an attempt was made to select the most representative portions of the lesion. To draw an ROI with a similar area in the reference tissue, the entire lesion could not be covered. Third, the two radiologists could not evaluate the elasticity of epidermal cysts simultaneously; instead, they respectively evaluated the obtained images. However, there was a training period for EUS to reach a consensus, and the inter-reader reproducibility was also good.
In conclusion, the SE and SWE parameters of epidermal cysts showed moderate to good reproducibility. In particular, the strain ratio on SE showed good reproducibility. To evaluate the elasticity of epidermal cyst, using the strain ratio on SE images could provide relatively objective and consistent values.
Notes
Author Contributions
Conceptualization: Park HJ. Data acquisition: Kim JN, Park HJ, Song E, Kim M. Data analysis or interpretation: Park HJ, Kim MS, Won SY, Shin H. Drafting of the manuscript: Kim JN, Park HJ. Critical revision of the manuscript: Park HJ, Kim MS, Won SY, Song E, Kim M, Shin H. Approval of the final version of the manuscript: all authors.
No potential conflict of interest relevant to this article was reported.
References
Article information Continued
Notes
Key point
The strain ratio of epidermal cysts showed good reproducibility that was superior to strain elastography (SE) score and shear wave elastography values. To evaluate the elasticity of epidermal cysts, SE including strain ratio can be used with a relatively objective and constant value.