Combined use of shear-wave elastography and Doppler ultrasonography in equivocal fibroepithelial lesions of the breast diagnosed by core needle biopsy
Article information

Abstract
Purpose
The aim of this study was to evaluate the diagnostic value of shear-wave elastography (SWE) combined with Doppler ultrasonography (US) in selecting equivocal breast fibroepithelial lesions (FELs) for follow-up without further excision.
Methods
A retrospective analysis was conducted of 88 patients with equivocal breast FELs (FELs with the possibility of both fibroadenoma [FA] and phyllodes tumor [PT]) diagnosed by core needle biopsy (CNB). For post-CNB treatment, surgical or vacuum-assisted excision was performed on 88 equivocal FELs, of which 56 were diagnosed as FAs and 32 as PTs on histopathology. Mean elasticity (Emean) and vascularity were determined using SWE and Doppler US. The diagnostic performances of B-mode US, SWE, and Doppler US were calculated to differentiate FAs and PTs in the excised equivocal FELs.
Results
In the excised equivocal FELs diagnosed by CNB, FAs showed significantly lower median Emean values (36.4 vs. 66.7 kPa, P=0.005) and more frequent low vascularity (0–1 vessel flow signal) (P<0.001) than PTs. For the differentiation of FAs and PTs, the combination of Emean of >60.9 kPa and high vascularity (≥2 vessel flows) showed a sensitivity and negative predictive value of 100%, as well as better performance in other diagnostic values than B-mode US alone (Breast Imaging Reporting and Data System ≥4A) (all P<0.05).
Conclusion
Equivocal breast FELs showing both low elasticity and low vascularity were not upgraded to PTs upon further excision. Therefore, the combination of SWE and color Doppler US mode might help select patients with equivocal FELs for whom further excision is unnecessary.
Introduction
Fibroepithelial lesions (FELs) of the breast are biphasic tumors with both epithelial and stromal components, including fibroadenomas (FAs) and phyllodes tumors (PTs) [1]. Ultrasound (US)-guided core needle biopsy (CNB) is commonly used to accurately diagnose FELs because B-mode US cannot sufficiently differentiate PTs from FAs due to their overlapping imaging features [2–6]. Most FELs are FAs, which usually remain unchanged and sometimes decrease in size. Therefore, FAs diagnosed by CNB can be managed with only follow-up instead of surgical excision [4,7]. Meanwhile, PTs are classified as benign, borderline, or malignant based on their histological features. Even if PTs are classified as benign or borderline, they can grow continuously and recur if resected incompletely, similar to malignant PTs. As a result, PTs diagnosed by CNB are routinely treated with wide excision [8,9]. Although US-guided CNB is considered an appropriate method for the preoperative diagnosis of PT [10,11], pathological examinations using CNB samples cannot distinguish all FELs as PTs or FAs, because CNB samples include only a fraction of the entire lesion, and pathological findings may overlap between PTs and FAs [3,5,12]. Therefore, if the pathological features of the lesion contained in the CNB sample are not definitive for PT, the pathologist sometimes diagnoses the breast mass as an equivocal FEL with the possibility of both PT and FA (equivocal FEL) [4,13]. Patients who have equivocal FELs diagnosed by CNB may undergo surgical excision because PTs might be underestimated on CNB pathology, but a substantial number of these patients are often diagnosed with FAs on surgical pathology [13,14].
Doppler US and shear wave elastography (SWE) have been used as supplemental imaging techniques to improve the performance of conventional B-mode US in diagnosing breast lesions [15]. Color or power Doppler US shows the vascular characteristics of breast lesions by visualizing blood vessels [16,17]. SWE is an US elastography technique that quantifies the elasticity of breast lesions [18,19]. In particular, the combination of SWE and Doppler US is useful for downgrading Breast Imaging Reporting and Data System (BI-RADS) category 4A lesions to category 3, and consequently reducing unnecessary biopsies [16,18,20]. In a previous study comparing SWE and color Doppler US features of FAs and PTs, seven (7/30, 23.3%) equivocal FELs diagnosed by CNB showed softness, with a mean elasticity (Emean) of <43.9 kPa, and low vascularity (0–1 vessel flow signal), and all these FELs were confirmed as FAs by subsequent excision [13]. While the previous study raised the possibility of using the combination of SWE and Doppler US to distinguish FAs that do not require further excision among equivocal FELs diagnosed by CNB, only 30 cases were included [13].
Therefore, the purpose of this study was to evaluate the diagnostic value of SWE and color Doppler US for preventing unnecessary excision of equivocal breast FELs diagnosed by CNB.
Materials and Methods
Compliance with Ethical Standards
This retrospective study was approved by the Institutional Review Board (2021-01-028) of Samsung Medical Center, which waived the requirement for informed consent.
Study Population
From January 2014 to September 2018, 4,490 patients underwent US-CNB after diagnostic or screening breast US examinations at our institution. Of these patients, 322 patients were diagnosed with FELs (7.2%, 322/4,490; FAs [n=14], PTs [n=72], or FELs with the possibility of both FA and PT [n=236]). Patients who had FELs with the possibility of both FA and PT (equivocal FEL) diagnosed by US-CNB were initially considered eligible for our study [4,13]. The inclusion criteria were as follows: women who had B-mode US, SWE, and color Doppler US images available in the picture archiving and communications system (PACS) prior to US-CNB. Of the patients diagnosed with equivocal FEL, 114 patients for whom B-mode US, SWE, and color Doppler US images were available in the PACS prior to US-CNB met the inclusion criteria. The exclusion criteria were as follows: (1) women without subsequent surgical excision or US-guided vacuum-assisted excision (VAE) of their equivocal FELs diagnosed by US-CNB and (2) women with severe artifacts seen on SWE or color Doppler images. Severe artifacts of SWE images were defined when a red pattern was observed in the near field of the field-of-view (FOV) box or red vertical streaks were observed in the surrounding normal tissue within the FOV box [21,22].
Finally, 88 patients (mean age, 38.6 years; range, 19 to 53 years) with 88 equivocal FELs were consecutively included (Fig. 1). Twenty of these patients were reported in a previous study evaluating the utility of combined SWE and color Doppler US for preoperative differentiation of FA and PT [13]. However, this study is different in that it only targeted equivocal breast FELs diagnosed by CNB.
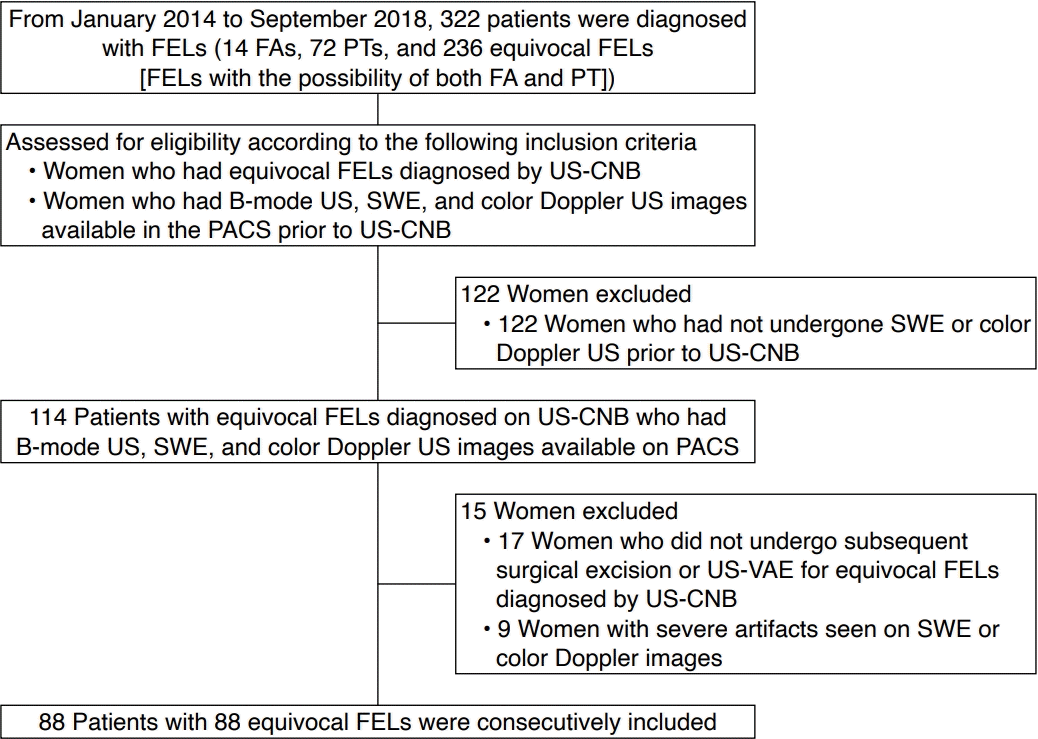
Flowchart of the study population.
FA, fibroadenoma; FEL, fibroepithelial lesion; US-CNB, ultrasound-guided core needle biopsy; US-VAE, ultrasound-guided vacuumassisted excision; PT, phyllodes tumor; PACS, picture archiving and communications system; SWE, shear wave elastography; US, ultrasound.
Of the total 88 patients, 78 underwent surgical excision and 10 underwent US-VAE. The type of post-CNB excision performed on each patient was determined by a clinician, considering the patient’s preferences. However, US-VAE was only recommended for equivocal FELs with a diameter less than 2 cm [23].
US Examination and Image Analysis
One of two board-certified radiologists (J.S.C. and E.Y.K.) with >6 years of experience in breast imaging performed US examinations using the Aixplorer system (SuperSonic Imagine, Aix-en-Provence, France) with a 15-4-MHz linear array transducer. The radiologists performed conventional B-mode US examinations of both breasts and acquired at least two orthogonal images for each breast lesion. They measured lesion size (maximal diameter) and assessed the B-mode US features according to shape (oval, round, or irregular), orientation (parallel or not parallel), margin (circumscribed or not circumscribed), echo pattern (isoechoic, hypoechoic, or heterogeneous), and posterior features (enhancement, shadowing, or no posterior features) based on US BI-RADS [24].
After conventional B-mode US, the same radiologist performed SWE and color Doppler US on lesions scheduled for US-CNB. Two orthogonal views of SWE and color Doppler US images showing the most suspicious features were acquired. For SWE, tissue elasticity was expressed for each pixel in the range of 0 kPa (dark blue; soft) to 180 kPa (red; stiff) using a color-coded map. A 2-mm circular region-of-interest (Q-box) was drawn at the stiffest portion within or immediately adjacent to the lesion [19,20,25,26], and the mean elasticity (Emean) and maximal elasticity (Emax) were automatically calculated. In color Doppler US examinations, Doppler amplification was set to a level at which normal breast parenchyma did not show any noise just below the random noise level. Medium wall filter, pulse repetition frequency of 700 Hz, intermediate persistence, a frame rate of 16 frames per second, and a dynamic range of 50 dB were applied.
Emean and Emax values were acquired from the targeted SWE images. Vascularity on color Doppler US images was scored according to the number of vessels that were depicted within, surrounding, or penetrating the lesions [27] and classified into two categories: low (when 0 or 1 vessel flow signal was observed) and high (when ≥2 vessel flow signals were observed).
Histopathological Analysis
US-CNB acquired at least four samples using a 14-gauge automated biopsy gun (Acecut, TSK Laboratory, Vancouver, BC, USA) or a 14-gauge dual-action semiautomatic core biopsy needle with a 22-mm throw (Stericut cut with coaxial; TSK Laboratory). US-VAE was performed with an 11-gauge or 8-gauge needle (Mammotome; Devicor Medical, Cincinnati, OH, USA). Biopsies were performed on lesions equal to or higher than BI-RADS 4A (n=77), BI-RADS 3 lesions with palpable masses (n=4) or an increase in size (n=2), and category 3 lesions at patient request (n=5).
Histopathological features of US-CNB, US-VAE, and surgical specimens were evaluated for stromal characteristics, including cellularity, mitosis, atypia, tissue fragmentation, and tumor margin, by one of two board-certified pathologists (S.Y.C. and E.Y.C.) with experience >10 years in breast pathology [1,5]. Equivocal FELs were diagnosed when FELs with increased stromal cellularity in CNB specimens showed inconclusive PT features [4,5]. US-VAE and surgical excision pathology results were classified as FA or PT.
Data and Statistical Analyses
Electronic medical records were reviewed to collect clinical, imaging, and pathological data on age, reasons for the US examination, symptoms, B-mode US features (lesion size and BI-RADS category on radiological reports), SWE features (Emean and Emax), vascularity on color Doppler US, and histopathological results of surgery, US-VAE, or US-CNB.
For the 88 equivocal FELs diagnosed using US-CNB, the final diagnosis was based on the histopathological results of surgical excision. All PTs were confirmed by surgery (n=32; 23 benign PTs, 9 borderline PTs). FAs were confirmed by surgery (n=46) or US-VAE (n=10). Age, symptoms, lesion size measured by B-mode US, SWE features (Emean and Emax), and vascularity on color Doppler US were compared between the overall PT and FA groups and between benign PT and borderline PT subgroups. All quantitative data were checked for the normality of distribution using the Kolmogorov-Smirnov goodness-of-fit test. The Wilcoxon rank test was performed when data were not normally distributed. The chi-square test or the Fisher exact test was used for non-numeric data analysis.
In the diagnostic performance analysis to differentiate PTs and FAs, positive test results for PT were defined using a BI-RADS category of ≥4A for B-mode US and high vascularity (≥2 vessel flow signals) for Doppler US. For the SWE features, positive quantitative elasticity values (Emean and Emax) were determined using the cut-off values obtained according to the Youden index of the univariable logistic regression model [28]. The diagnostic performances of different US modes to distinguish FA and PT were calculated based on the pathological diagnoses of the excised specimens.
Multivariable analyses adjusted for clinical variables were performed to determine whether B-mode US, SWE, or Doppler US features were associated with an upgrade to PT after excision. Therefore, each multivariable analysis model included clinical variables and one of four target variables (BI-RADS category ≥4A for B-mode US, Emean for SWE, Emax for SWE, and high vascularity for Doppler US). As a result, four multivariable analysis models were created.
To distinguish PTs and FAs, the sensitivity, specificity, accuracy, positive predictive value (PPV), and negative predictive value (NPV) of B-mode US, SWE features (Emean and Emax), and color Doppler US were calculated. Statistical differences in diagnostic value were analyzed using generalized estimating equations [29]. The area under the curve (AUC) was calculated after constructing the receiver operating characteristic curve. The AUCs for the different US modes were compared using a nonparametric approach [30].
Analyses were performed using SAS version 9.4 (SAS Institute, Cary, NC, USA) and R version 3.2.2 (Vienna, Austria; http://www.R-project.org/). The threshold for statistical significance was a P-value of <0.05.
Results
Of the 88 patients who had equivocal FELs diagnosed by CNB with the possibility of both FA and PT, 56 patients were confirmed as having FAs (63.6%, 56/88) and 32 as having PTs (36.4%, 32/88) by subsequent surgery or US-VAE. Two of these patients were not followed after surgery or US-VAE. The remaining 86 patients were followed with US. The mean follow-up period was 37.1 months (range, 11 to 89 months). Among these patients, one patient whose lesion was diagnosed as equivocal FEL by CNB and upgraded to borderline PT at subsequent surgery developed a recurrence of benign PT 22 months after the initial surgery. The other 85 patients showed no recurrence during the follow-up period.
The clinical and imaging characteristics of the FA and PT subgroups are shown in Table 1. The median age of patients with PTs was significantly higher than that of patients with FAs (41.5 years vs. 38.0 years, P=0.012). The median lesion size measured by B-mode US was significantly higher in PTs than in FAs (23.5 mm vs. 15.0 mm, P<0.001). B-mode US features according to the BI-RADS lexicon and BI-RADS categories did not differ significantly between the FA and PT subgroups. Both Emean and Emax were significantly higher in PTs than in FAs (Emean, 66.7 kPa vs. 36.4 kPa, P=0.005; Emax, 76.7 kPa vs. 45.2 kPa, P=0.013) (Fig. 2). Conversely, high vascularity (≥2 vessels) on color Doppler US was more frequent in PTs than in FAs (P<0.001).
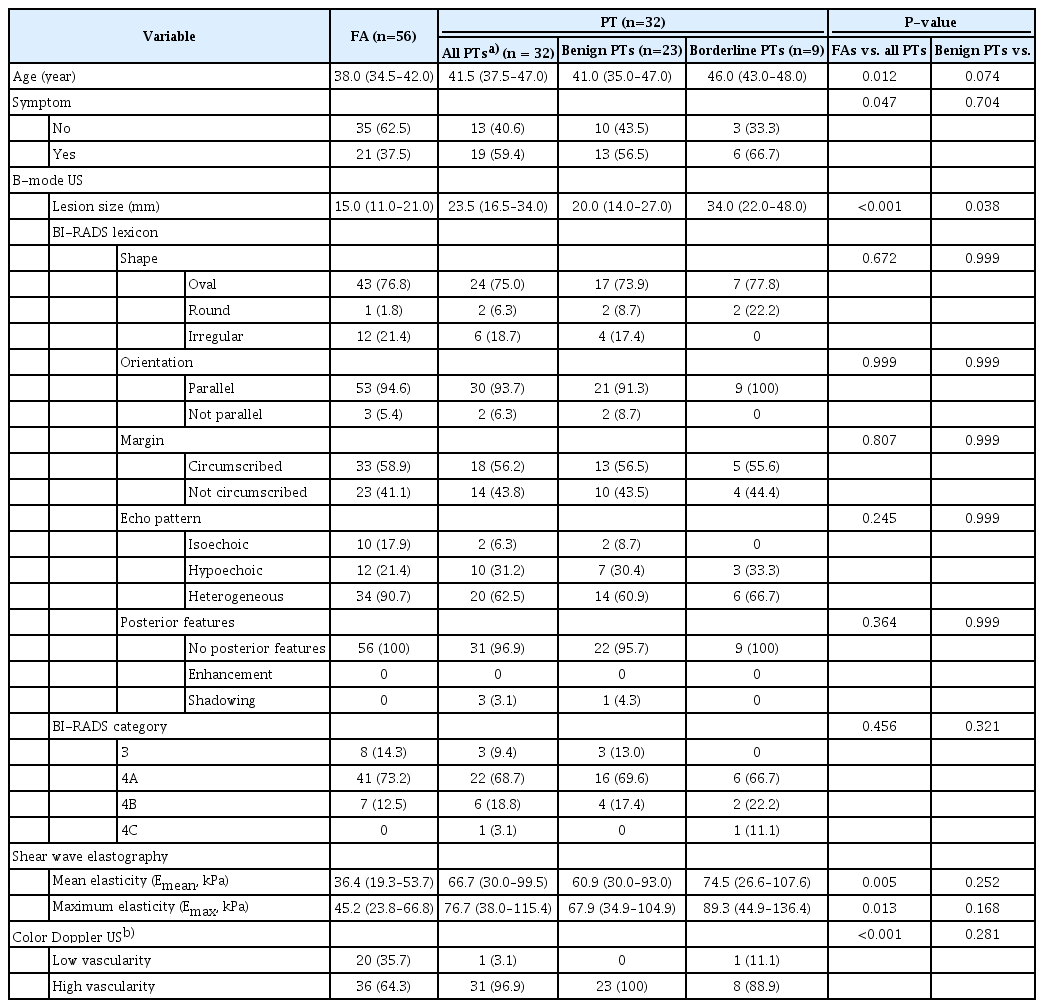
Characteristics of the 88 lesions confirmed by additional excision after diagnosis as equivocal fibroepithelial lesions by core needle biopsy
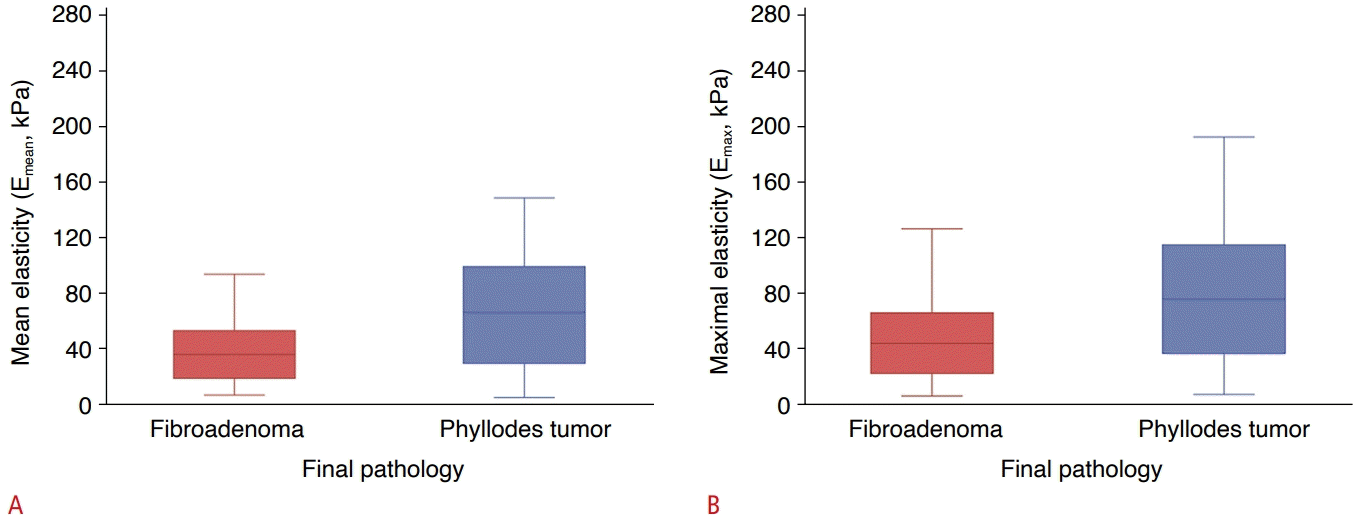
Box plots of tissue stiffness by shear wave elastography.
A, B. Both Emean (mean elasticity) (A) and Emax (maximal elasticity) (B) were significantly higher in phyllodes tumors than in fibroadenomas.
Among 32 PTs, 23 were benign, nine were borderline, and none were malignant. Borderline PTs were larger than benign PTs (34.0 mm vs. 20.0 mm, P=0.038). However, other variables were not significantly different between the borderline and benign PT subgroups (P>0.05).
Multivariable analyses adjusted for clinical variables were performed to determine whether B-mode US, SWE, or Doppler US features were associated with an upgrade to PT after excision (Table 2). Age (range of odds ratios [ORs], 1.07 to 1.08) and lesion size (ORs, 1.11 to 1.56) were significantly associated with PTs in all models (all P<0.05). SWE features, defined as values above the cut-off Emean of 60.9 kPa (OR, 3.73; P=0.019) and the cut-off Emax of 67.9 kPa (OR, 3.05; P=0.043) were associated with an upgrade to PT. High vascularity on color Doppler US (OR, 19.52; P=0.013) was also associated with an upgrade to PT. However, a BI-RADS category ≥4A for B-mode US was not associated with PT (P=0.784).

Association between each imaging variable and upgrade to phyllodes tumor after adjustment for clinical variables
When differentiating FAs and PTs in the excised equivocal FEL group (Table 3), the AUCs of SWE features found with cut-off values for Emean of 60.9 kPa (0.692) and Emax of 67.9 kPa (0.665) and color Doppler US (0.663) were significantly higher than the AUC of B-mode US (0.525) (all P<0.05). Both Emean and Emax showed significantly higher specificity (SWE vs. B-mode: 76.8%–82.1% vs. 14.3%), accuracy (69.3%–72.7% vs. 42.1%), and PPV (58.1%–64.3% vs. 37.7%) (all P<0.05), but significantly lower sensitivity (56.3% vs. 90.6%, P<0.001) and similar NPV (75.4%–76.7% vs. 72.7%, P>0.05) compared to B-mode US. Color Doppler US showed higher values for all diagnostic performance values than B-mode US; however, significant differences were observed in specificity (Doppler vs. B-mode: 35.7% vs. 14.3%), accuracy (57.9% vs. 42.1%), and PPV (46.3% vs. 37.7%) (all P<0.05), but not in sensitivity (96.9% vs. 90.6%) and NPV (95.2% vs. 72.7%) (all P>0.05).
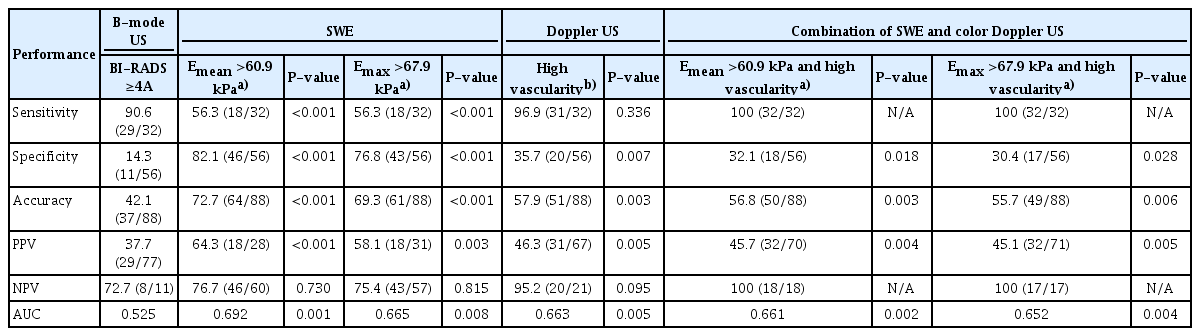
Diagnostic performances of B-mode US, SWE, and color Doppler US in differentiating phyllodes tumors from fibroadenomas among equivocal fibroepithelial lesions diagnosed by core needle biopsy
The combined modes of SWE and Doppler US with an Emean of >60.9 kPa and high vascularity or an Emax of >67.9 kPa and high vascularity increased both sensitivity and NPV to 100% compared with SWE or Doppler US alone (Table 3, Fig. 3). In addition, the combined mode showed significantly higher values of sensitivity, specificity, accuracy, PPV, NPV, and AUC than B-mode US (all P<0.05) (Table 3, Fig. 4).
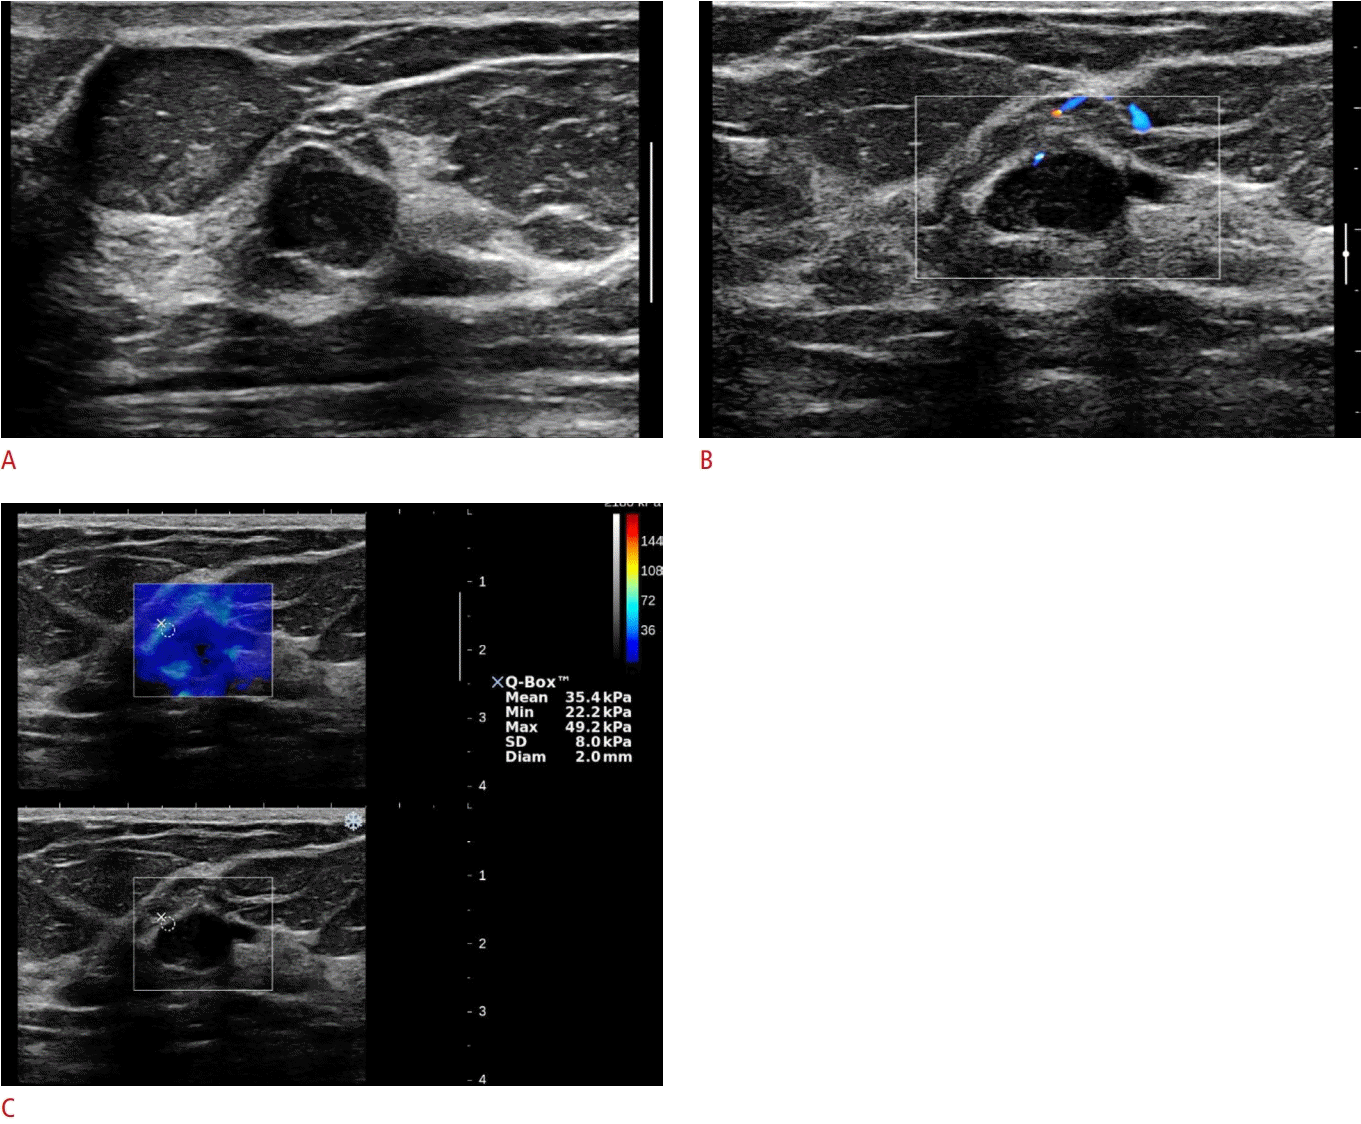
A 44-year-old woman with an equivocal fibroepithelial lesion diagnosed through core needle biopsy.
A. A B-mode ultrasonography (US) image shows a 1.3-cm breast mass with Breast Imaging Reporting and Data System category 4A. B. The color Doppler US image shows low vascularity (1 vessel flow signal). C. The shear wave elastography image shows an Emean of 35.4 kPa and an Emax of 49.2 kPa. This mass was finally confirmed as fibroadenoma on vacuum-assisted excision. Emean, mean elasticity; Emax, maximal elasticity.

A 46-year-old woman with an equivocal fibroepithelial lesion diagnosed through core needle biopsy.
A. A B-mode ultrasonography (US) image shows a 1.5-cm breast mass with Breast Imaging Reporting and Data System category 4A. B. The color Doppler US image shows high vascularity (≥2 vessel flow signals). C. The shear wave elastography image shows an Emean of 66.4 kPa and an Emax of 77.7 kPa. This mass was finally confirmed as a benign phyllodes tumor on surgical excision. Emean, mean elasticity; Emax, maximal elasticity.
Discussion
In the excised equivocal FELs diagnosed by CNB in this study, older age and larger lesions were associated with an upgrade to PT after further excision, which is concordant with the results of previous studies [31–33]. However, B-mode US features according to the BI-RADS lexicon and BI-RADS categories did not differ between the FA and PT subgroups. These results reflect that B-mode US features determined based on US BI-RADS are not useful for predicting the possibility of upgrade to PT in equivocal FELs diagnosed by CNB. However, the excised PT group showed significantly higher values of SWE features (Emean and Emax) than the FA group, which indicates that PTs may have higher stiffness values than FAs. PTs are histologically characterized by higher stromal cellularity than FAs; therefore, PTs tend to be stiffer or harder than FAs. In addition, the PT subgroup showed more frequent high vascularity than the FA subgroup. These results are in accordance with the results of a previous study comparing the SWE and Doppler features of FAs and PTs [13].
When distinguishing PTs from FAs among equivocal FELs, SWE features showed higher specificity (76.8%–82.1%) and PPV (58.1%–64.3%) than B-mode US (14.3%) or Doppler US (35.7%); however, the sensitivities of B-mode US (90.6%) and Doppler US (96.9%) were higher than that of SWE (56.3%). The combination of SWE and color Doppler US showed 100% sensitivity and NPV, indicating that equivocal FELs showing both low elasticity values and low vascularity were not upgraded to PTs upon further excision. In addition, the combined mode showed significantly higher values for other diagnostic parameters than the corresponding values of B-mode US. In this study, the upgrade rate to PT in the excised equivocal FELs was 36.4% (32/88), which is similar to those reported in previous studies (range, 18% to 38%) [4,14,32,34]. Meanwhile, the remaining 63.6% of the equivocal FELs (56/88) were confirmed as FAs through subsequent excisions, and these 56 patients with equivocal FELs might be regarded as having undergone unnecessary further excision. Considering that the NPV of the combined SWE and Doppler US mode was 100% in our study, it is suggested that the combined SWE and Doppler US mode will help clinicians distinguish FAs from equivocal FELs diagnosed by CNB without further excision. When a criterion of Emean of ≤60.9 kPa and low vascularity was used to distinguish FAs from equivocal FELs, 20.5% (18/88) of the excised equivocal FELs were diagnosed as FAs, suggesting that unnecessary additional excision could have been avoided. Our results indicate that the combination of SWE and color Doppler US will help select patients with equivocal FELs diagnosed by CNB for whom further excision is not needed.
This study has several limitations. First, it was a retrospective study that included equivocal FELs diagnosed by CNB that had available SWE and color Doppler US imaging data. A point to note is that age and lesion size are already known as potential predictors of PT. These factors may have influenced the clinician's decision of whether to perform further resection. In addition, lesion size may impact the quality of SWE and Doppler US, because it is not easy to apply SWE or Doppler US to larger tumors without manual compression. In particular, manual compression can degrade the image quality and introduce artifacts on SWE. PTs tend to be larger than FAs, which creates difficulties when attempting to obtain appropriate SWE images, and PTs may have been excluded from this study due to SWE images of insufficient quality with artifacts. These elements could have led to selection bias in this study. However, in the multivariable analyses adjusted for lesion size, SWE and Doppler US features of equivocal FEL diagnosed by CNB were associated with upgrade to PT after excision. Therefore, we believe that even for equivocal FELs that are relatively large, SWE and Doppler US features can be used to predict the upgrade of these lesions to PT after further excision, provided that the image quality of SWE and Doppler US is adequate. Third, B-mode US, SWE, and color Doppler in this study were performed by two radiologists, which means that inter-observer variability might have been presented. However, the radiologists were instructed on the techniques needed to obtain appropriate SWE images prior to the study.
In conclusion, equivocal breast FELs showing both low elasticity and low vascularity were not upgraded to PTs upon further excision. Therefore, the combination of SWE and the color Doppler US mode might help select patients with equivocal FELs diagnosed by CNB for whom further excision is unnecessary.
Notes
Author Contributions
Conceptualization: Choi JS, Han BK. Data acquisition: Choi JS, Ko EY, Ko ES. Data analysis or interpretation: Kim MJ. Drafting of the manuscript: Choi JS, Ko EY, Kim MJ, Ko ES, Han BK. Critical revision of the manuscript: Choi JS. Approval of the final version of the manuscript: all authors.
No potential conflict of interest relevant to this article was reported.
References
Article information Continued
Notes
Key point
Equivocal fibroepithelial lesions (FELs) of the breast diagnosed by core needle biopsy (CNB) showing both low elasticity values and low vascularity were not upgraded to phyllodes tumors after further excision. The combination of shear-wave elastography and color Doppler ultrasonography might help select patients with equivocal FELs diagnosed by CNB for whom further excision is not needed.