Intra-individual comparison of liver stiffness measurements by magnetic resonance elastography and two-dimensional shear-wave elastography in 888 patients
Article information

Abstract
Purpose
Quantitative elastography methods, such as ultrasound two-dimensional shear-wave elastography (2D-SWE) and magnetic resonance elastography (MRE), are used to diagnose liver fibrosis. The present study compared liver stiffness determined by 2D-SWE and MRE within individuals and analyzed the degree of agreement between the two techniques.
Methods
In total, 888 patients who underwent 2D-SWE and MRE were analyzed. Bland-Altman analysis was performed after both types of measurements were log-transformed to a normal distribution and converted to a common set of units using linear regression analysis for differing scales. The expected limit of agreement (LoA) was defined as the square root of the sum of the squares of 2D-SWE and MRE precision. The percentage difference was expressed as (2D-SWEMRE)/ mean of the two methods×100.
Results
A Bland-Altman plot showed that the bias and upper and lower LoAs (ULoA and LLoA) were 0.0002 (95% confidence interval [CI], -0.0057 to 0.0061), 0.1747 (95% CI, 0.1646 to 0.1847), and -0.1743 (95% CI, -0.1843 to -0.1642), respectively. In terms of percentage difference, the mean, ULoA, and LLoA were -0.5944%, 19.8950%, and -21.0838%, respectively. The calculated expected LoA was 17.1178% (95% CI, 16.6353% to 17.6002%), and 789 of 888 patients (88.9%) had a percentage difference within the expected LoA. The intraclass correlation coefficient of the two methods indicated an almost perfect correlation (0.8231; 95% CI, 0.8006 to 0.8432; P<0.001).
Conclusion
Bland-Altman analysis demonstrated that 2D-SWE and MRE were interchangeable within a clinically acceptable range.
Introduction
Hepatic fibrosis, a form of scarring that results from repeated liver injury, leads to the accumulation of extracellular matrix components in the liver parenchyma [1]. Fibrosis can progress to cirrhosis and is an important risk factor for hepatocellular carcinoma (HCC) and hepatic failure [2]. An accurate diagnosis of the degree of hepatic fibrosis is essential for patient management, including for predicting the prognosis and monitoring responses to fibrosis therapies.
Liver biopsy is the gold standard for staging hepatic fibrosis. However, it is an invasive procedure and has several disadvantages, including patient reluctance, pain, and hemoperitoneum, and its complications may be life-threatening [3]. These disadvantages limit the role of biopsy for serial monitoring. Furthermore, liver biopsy assesses only about 1/50,000th of the whole liver volume and is thus prone to sampling error and intra- and inter-observer variation [4].
Magnetic resonance elastography (MRE) has emerged as a highly accurate, noninvasive imaging test to measure liver stiffness (LS) and thus quantify liver fibrosis [5]. However, using MRE to test a large number of patients at risk for liver fibrosis is costly and practically difficult. There are also complaints that the MRE examination space is small, the vibrations cause feelings of sickness, and the examination time is too long, all of which limit the feasibility of magnetic resonance imaging (MRI) examinations. Ultrasound-based methods for LS quantification can also assess fibrosis and are quicker to perform. Of these techniques, transient elastography (TE) may be the most widely performed, and it has been extensively investigated [6,7]. Nonetheless, studies comparing MRE and TE have shown that MRE has superior performance [5,8,9].
Two-dimensional shear-wave elastography (2D-SWE) has been introduced as an additional approach for ultrasound-based LS measurement. Unlike TE, 2D-SWE offers real-time simultaneous B-mode visualization of the liver and incorporates flexible placement of larger regions of interest (ROIs), thereby potentially reducing technical failures and providing more robust assessment in challenging cases [10,11]. A relatively limited number of investigations have compared MRE and 2D-SWE [5,9,12], and they yielded heterogeneous results, had limited sample sizes, or did not focus on factors impacting the agreement of measurements obtained by both methods. The aim of this study was thus to perform an intra-individual comparison of LS measurements using MRE and 2D-SWE in a large patient sample, with attention to factors impacting agreement.
Materials and Methods
Compliance with Ethical Standards
This retrospective study was approved by the Institutional Review Board (20200423-5) of Ogaki Municipal Hospital and was carried out in compliance with the Helsinki Declaration. The Institutional Review Board approved this study after the examinations were completed and waived the requirement for further consent.
Study Population
All MRE and 2D-SWE examinations were performed for clinical purposes unrelated to this investigation. At the time of the MRE and 2D-SWE examinations, patients provided written informed consent to use the test results in future clinical research.
At the authors’ institution, both MRE and 2D-SWE were routinely performed in patients with chronic liver disease. Fig. 1 shows a flowchart of patient selection. A retrospective search of patients with suspected liver disease who underwent B-mode ultrasonography identified 2,710 consecutive patients with chronic liver disease who underwent both MRE and 2D-SWE between April 2015 and December 2020. Of these, 1,236 patients underwent MRE and 2D-SWE, performed in either order, within a 3-month window. Additional patients were then excluded for the following reasons: treatment for HCC before MRE or 2D-SWE examination (n=283); presence of liver metastasis (n=20); large-volume ascites (n=18); and severe jaundice (n=10) [6,13]. These exclusions resulted in a study sample of 905 patients (453 women, 452 men; median age, 67 years).
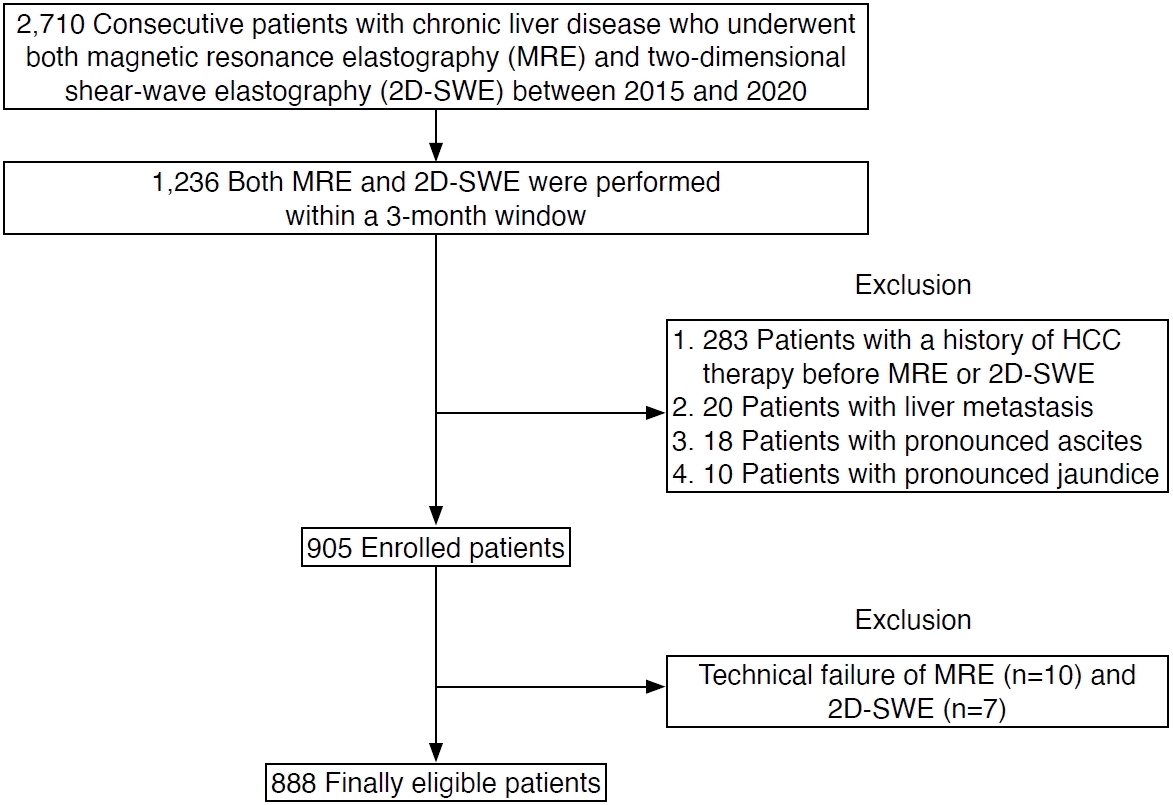
Flowchart of patient selection.
HCC, hepatocellular carcinoma.
Alanine aminotransferase (ALT), aspartate aminotransferase (AST), gamma-glutamyl transpeptidase, platelet count, albumin, and total bilirubin were measured in all patients at the time of 2D-SWE. The fibrosis-4 (FIB-4) score, as a noninvasive simple serum marker, was calculated using the following formula: age (years)×AST (U/L)/[platelet count (109/L)×
LS Measured by MRE
MRE was performed using a 3.0 T MRI system (Discovery 750, GE Healthcare, Waukesha, WI, USA) with a 32-channel phased-array coil [15]. Patients were placed in the supine position, and a cylindrical passive driver was attached to the right chest wall using a rubber belt. Axial wave images were acquired using a 2D spin-echo planar MRE sequence with the following parameters, as previously reported [16]: repetition time/echo time, 1,000/59.3-236 ms; continuous sinusoidal vibration, 60 Hz; field of view, 42 cm; matrix size, 64×64; flip angle, 90°; section thickness, 7 mm; and four evenly spaced phase offsets and four pairs of 60-Hz trapezoidal motion-encoding gradients with zeroth- and first-order moment nulling along the through-plane direction. The processing was automated and yielded confidence maps of tissue shear stiffness measured in kilopascals (kPa). To assess the proton density fat fraction (PDFF), the examinations also included a modified Dixon sequence with advanced processing (IDEAL IQ, GE Healthcare), using previously described acquisition parameters [16].
Each MRI examination was reviewed by one of two radiologists (S.O. and T.G., who specialized in hepatology and had 10 and 7 years of experience in hepatobiliary imaging, respectively) who were blinded to each patient’s clinical data, including 2D-SWE results. The first radiologist to review the examination assessed whether the case demonstrated technical failure of MRE, as defined according to Wagner et al. [13]. If it did, then the reason for failure was recorded. For the remaining cases, the radiologist placed ROIs on each slice of the MRE magnitude images, including only liver parenchyma and avoiding the liver edge and large blood vessels. The ROIs also excluded portions of the liver in which the phase signal-to-noise ratio (i.e., the ratio of wave amplitude to noise in the wave images) was less than 5. One ROI was placed on each of the four slices, and the mean value was recorded to obtain the LS according to MRE (hereafter, LSMRE). Advanced fibrosis (≥F3) was defined as an MRE value ≥4.8 kPa [17].
The radiologist who measured LSMRE also placed ROIs on the in-phase and out-of-phase images to obtain PDFF measures. The steatosis grade was classified as grade 0 for PDFF <5.2%, grade 1 for PDFF ≥5.2% but <11.3%, grade 2 for PDFF ≥11.3% but <17.1%, and grade 3 for PDFF ≥17.1% [17].
In a post hoc consensus review after the completion of the independent LSMRE interpretations, the radiologists assessed the presence of mild to moderate ascites. LS and PDFF measurements were analyzed by the same two radiologists (S.O. and T.G.), who were blinded to each patient’s clinical data.
LS Measured by 2D-SWE
The 2D-SWE scans were performed using a LOGIQ S8, E9, or E10 ultrasound system (GE Healthcare) with a C1–6-D abdominal convex probe at a frequency of 1–4 MHz. Each scan was performed by one of three ultrasound technologists (non-authors, each with 10–15 years of experience in performing clinical abdominal ultrasound examinations and 3–5 years of experience in performing SWE examinations, including over 200 ultrasound elastography examinations). The operators were unaware of the MRE findings in each patient. Patients were required to have been fasting for at least 4 hours. During the examination, each patient lay in a supine position with the right arm in maximum abduction. Color-coded elasticity maps were generated from the right hepatic lobe using an intercostal approach. The machine automatically performed quality assessment by assessing shear wave propagation and excluding pixels on grayscale B-mode images that were judged to be of low quality due to poor probe contact, motion artifacts (secondary to breathing or heartbeats), and other artifacts (acoustic attenuation, reflection, scattering, and rib shadowing). Stiffness measurements were performed by the scanning technologist at the time of the examination; no scans were repeated specifically for the purpose of this investigation. The scanning technologist placed circular ROIs (approximately 15.0 mm in diameter) in the color box, perpendicular to the liver surface at a depth of at least 2.0 cm from the liver surface, and the value was recorded (expressed in kPa). Measurements were recorded from at least five ROIs, and the median value was calculated as the patient’s LS according to 2D-SWE (hereafter, LSSWE) [18]. If the ratio between the interquartile range (IQR) and the median of the five (or more) stiffness measurements was higher than 30%, then the measurements were deemed unreliable, and the 2D-SWE examination was classified as a technical failure. Advanced fibrosis (≥F3) was defined as a 2D-SWE value ≥8.9 kPa [18].
Fig. 2 shows examples of MRE and 2D-SWE images in representative patients without fibrosis (F0), with moderate fibrosis (F2), and with advanced fibrosis (F4) [19].
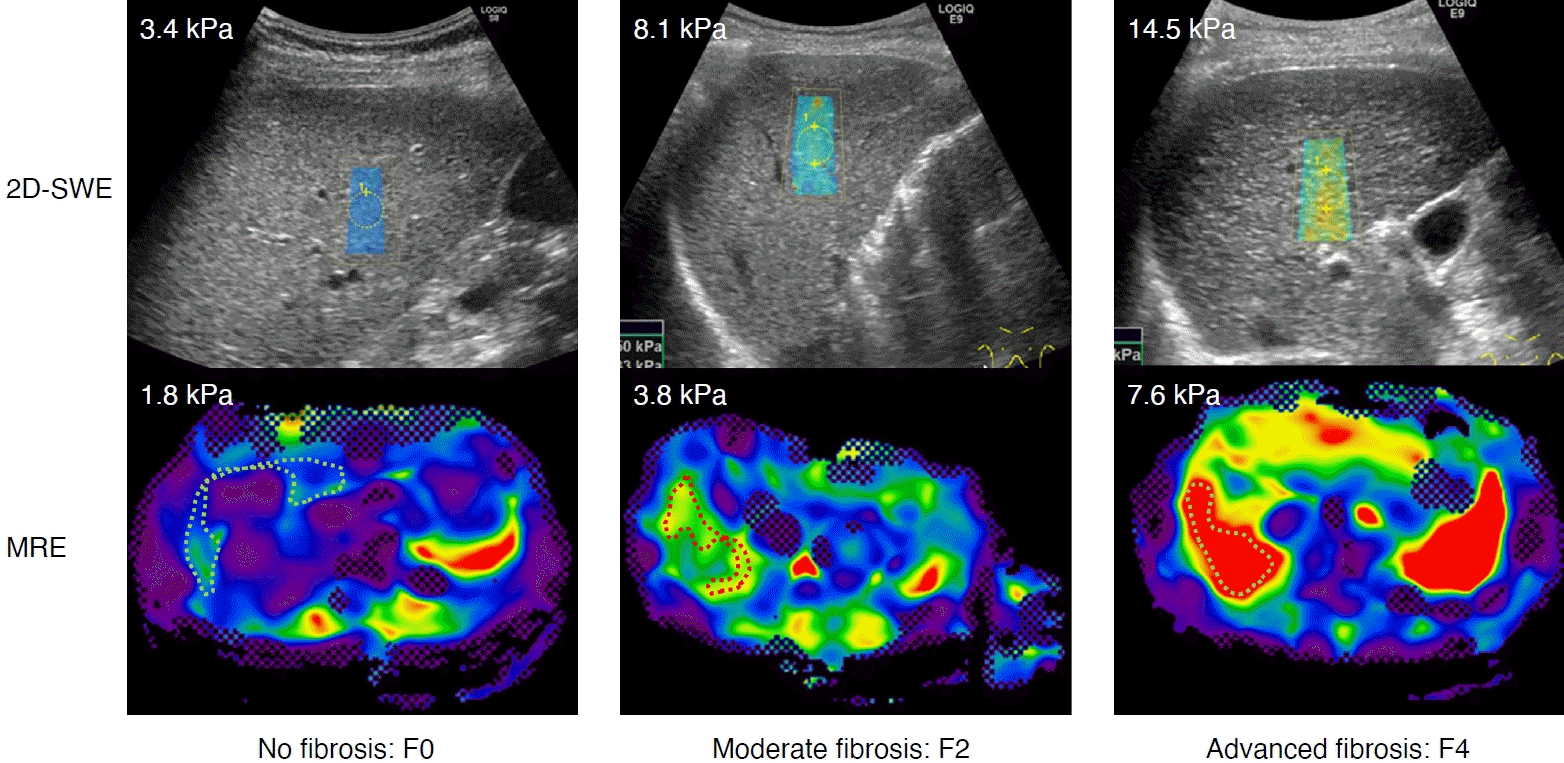
Two-dimensional shear-wave elastography (2D-SWE) and magnetic resonance elastography (MRE) in three representative patients.
The degree of liver stiffness determined by 2D-SWE and MRE increased with the degree of fibrosis progression, defined as the staging of liver fibrosis in chronic hepatitis C by MRE [19]. The left figure shows no fibrosis (F0, 58-year-old, female, hepatitis C virus [HCV] infection), the middle shows moderate fibrosis (F2, 82-year-old, female, HCV infection), and right shows advanced fibrosis (F4, 82-year-old, female, HCV infection).
Statistical Analysis
Each pair of LSMRE and LSSWE values was compared and analyzed with the Bland-Altman method. Before starting the comparison, a normal probability plot was used to verify that the LSMRE and LSSWE values were normally distributed; if not, they were transformed into a normal distribution [20]. In addition, for the subsequent analysis, linear regression was used to convert LSMRE values to the same scale as the modified LSSWE values [21–23]. The agreement between LSMRE and LSSWE was assessed by determining bias and precision [24–28]. Bias was calculated as the mean difference between LSMRE and LSSWE. The precision (P) of each method was defined as two standard deviations of the difference between replicate measurements of method x (2D-SWE and MRE), and given as a percentage:
where n is the number of replicated experiments, and
Linear regression and Bland-Altman analyses were used to determine the agreement between 2D-SWE and MRE. The percentage difference (% difference) was defined as:
The percentage error (PE) for comparing two methods x and y (in this study, 2D-SWE and MRE) was calculated similarly to the precision of replicate measurements. The equation for PE was given as:
where n is the patient number, and
Statistical significance was defined as a P-value <0.05. All statistical analyses were performed with EZR (version 1.53, Saitama Medical Center, Jichi Medical University, Saitama, Japan), which is a graphical user interface for R (R Foundation for Statistical Computing, Vienna, Austria) [30].
Results
Patient Characteristics
Table 1 shows the baseline characteristics of the study patients. The causes of chronic liver disease were as follows: non-alcoholic fatty liver disease (n=226); alcoholic liver disease (n=57); hepatitis B virus infection (n=99); hepatitis C virus infection (n=420); autoimmune hepatitis (n=19); primary biliary cholangitis (n=13); and others (n=71). The median age was 67 years (IQR, 58 to 75 years), and the median BMI was 23.7 kg/m2 (IQR, 21.4 to 26.1 kg/m2). The median LSMRE was 2.7 kPa (IQR, 2.3 to 3.7 kPa), the median LSSWE was 6.2 kPa (IQR, 5.0 to 8.0 kPa), and the median PDFF was 3.9% (IQR, 2.0% to 9.7%).
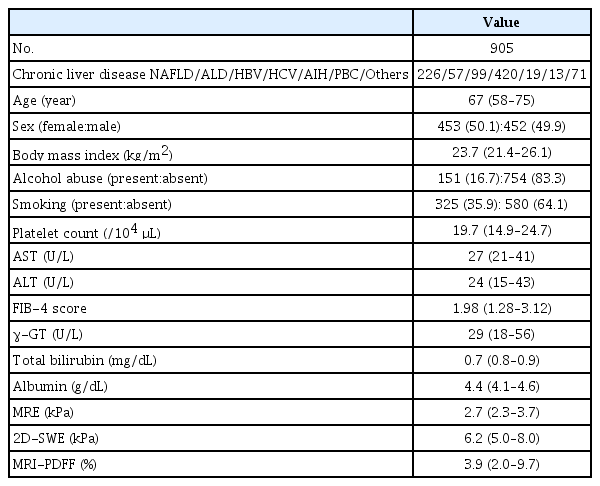
Baseline patient characteristics
The Technical Success Rates of MRE and 2D-SWE
The technical success rate of MRE was 98.9% (895/905). The reasons for MRE technical failure were as follows: no pixel values with a confidence index higher than 95% on the confidence map (n=4), poor breath-holding (n=3), and mild to moderate ascites (n=3). The technical success rate of 2D-SWE was 99.3% (898/905). The LSSWE measurements were deemed unreliable in seven patients because the ratio between the IQR and median measurements was larger than 30%. The technical success rate was not significantly different between MRE and 2D-SWE (P=0.627). The 888 patients for whom both MRE and 2D-SWE were technically successful were included in subsequent analyses (Fig. 1).
Analysis by the Bland-Altman Method
Supplementary Fig. 1 shows the correlation between LSMRE and LSSWE values, indicating substantial agreement (Spearman rank correlation coefficient, 0.786; 95% confidence interval [CI], 0.761 to 0.811; P<0.001) [29]. The normal probabilities of LSMRE and LSSWE values were evaluated using a normal probability plot before starting Bland-Altman analysis. Since neither LSMRE nor LSSWE values showed a normal distribution, both types of values were log-transformed [20]. The log LSMRE was converted into the modified log LSSWE by the following simple linear regression model: modified log LSSWE=0.4176+0.8193×log LSMRE [18,19].
Fig. 3A shows a Bland-Altman plot presenting the difference between modified log LSSWE and log LSSWE, along with the plots of both means. The Bland-Altman plot demonstrated that the bias, upper limit of agreement (ULoA), and lower limit of agreement (LLoA) were 0.0002 (95% CI, -0.0057 to 0.0061), 0.1747 (95% CI, 0.1646 to 0.1847), and -0.1743 (95% CI, -0.1843 to -0.1642), respectively. Fig. 3B shows the differences between modified log LSSWE and log LSSWE as percentages of values (percentage differences). The mean, ULoA, and LLoA were -0.5944%, 19.8950%, and -21.0838%, respectively. The calculated PE was 21.9647%, which was greater than the calculated expected LoA of 17.1177% (95% CI, 16.6353% to 17.6002%). However, 789 of the 888 patients (88.9%) had a percentage difference within 17.1177%. Fig. 3C illustrates the relationship between the modified log LSSWE and log LSSWE values. The ICC was 0.8231, indicating almost perfect agreement (P<0.001) [27]. The various parameters are listed in Supplementary Table 1.

Bland-Altman analysis.
A. Bland-Altman plot where differences are presented as units. The Bland-Altman plot demonstrated that the bias, upper limit of agreement (ULoA), and lower limit of agreement (LLoA) were 0.0002 (95% confidence interval [CI], -0.0057 to 0.0061), 0.1747 (95% CI, 0.1646 to 0.1847), and -0.1743 (95% CI, -0.1843 to -0.1642), respectively. B. Bland-Altman plot shows the difference as a percentage (% difference). The figure shows the difference (% difference) between the adjusted log LSSWE values and the log LSSWE values, where the mean, ULoA, and LLoA were –0.5944%, 19.8950%, and –21.0838%, respectively. C. Intraclass correlation coefficients are as follows: r=0.8231; 95% CI, 0.8006 to 0.8432. The relationship between the modified log LSSWE and log LSSWE values is shown; the intraclass correlation coefficient (ICC) is 0.8231, indicating almost perfect agreement (P<0.001). MRE, magnetic resonance elastography; 2D-SWE, twodimensional shear-wave elastography; LSMRE, liver stiffness according to MRE; LSSWE, liver stiffness according to 2D-SWE; modified log LSSWE=0.4176+0.8193×log LSMRE; % difference=[modified log LSSWElog LSSWE)/(0.5×(modified log LSSWE+log LSSWE]×100%.
In 29 of the 888 patients (3.3%), the correlation between 2D-SWE and MRE fell outside the 95% CI (Supplementary Fig. 1). Twenty-three patients showed an upward divergence (upper group), six showed a downward divergence (lower group), and 859 showed no divergence (non-divergent group). The percentage of patients with poor-quality ultrasound B-mode images was non-significantly higher in the lower group than in the upper group (100.0% for the former, 43.5% for the latter, P=0.068). A color-coded, heterogeneous shear-wave velocity map overlying the grayscale B-mode image within a selected ROI was examined in 27 of these 29 patients (93.1%). The FIB-4 scores in the lower group (n=6), upper group (n=23), and non-divergent group (n=859) were 3.85 (2.20–5.60), 4.19 (2.70–5.88), and 1.95 (1.24–3.00), respectively, indicating a significant difference between the upper and non-divergent groups (Steel-Dwass test, P<0.001). As shown in Supplementary Table 2, the kappa coefficient for advanced fibrosis evaluated by 2D-DWE and MRE was 0.624 (95% CI, 0.550 to 0.702; P<0.001), indicating substantial agreement [29].
Bland-Altman Analysis According to BMI and Hepatic Steatosis
Table 2 shows the Bland-Altman analysis according to BMI. There were no discrepancies in the percentage difference according to BMI category (<25.0 kg/m2, ≥25.0 kg/m2 but <30.0 kg/m2, or ≥30.0 kg/m2). The bias, percentage difference, and expected LoA increased significantly with BMI (Jonckheere-Terpstra test, P<0.001, P<0.001, and P<0.001, respectively). The ICCs gradually decreased as BMI increased, but indicated almost perfect agreement except for the category of BMI ≥30 kg/m2 (Fig. 4).

Bland-Altman analysis in subgroups defined by BMI
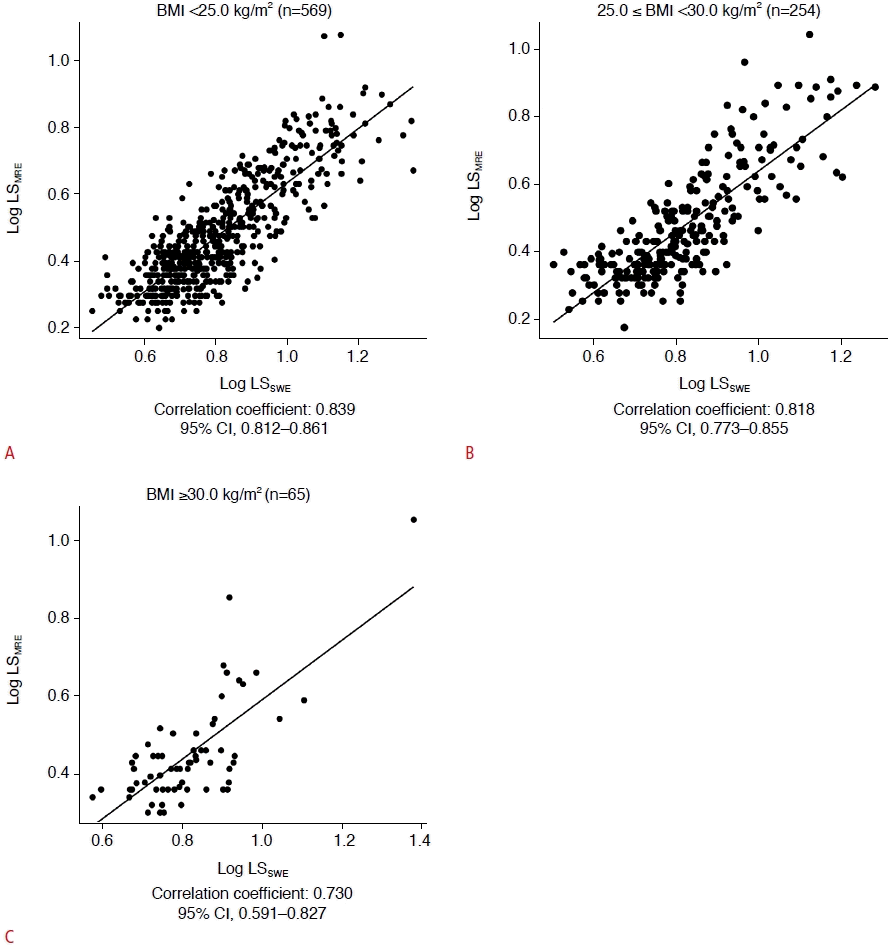
Intraclass correlation coefficients (ICCs) according to body mass index (BMI).
The correlation between different BMI values is shown: BMI <25.0 kg/m2 (n=569) (A); 25.0≤BMI<30.0 kg/m2 (n=254) (B); BMI ≥30.0 kg/m2 (n=65) (C). The ICCs gradually decreased as BMI increased, but indicated almost perfect agreement except for patients with a BMI ≥30 kg/m2. LSMRE, liver stiffness according to magnetic resonance elastography; LSSWE, liver stiffness according to twodimensional shear-wave elastography; CI, confidence interval.
Table 3 shows the Bland-Altman analysis according to hepatic steatosis grade measured by PDFF. The bias, percentage difference, and expected LoA increased significantly with the hepatic steatosis grade (Jonckheere-Terpstra test, P<0.001, P<0.001, and P=0.004, respectively). The ICCs gradually decreased as the steatosis grade increased, but almost perfect agreement in grade 0 and 1 patients (Fig. 5).

Bland-Altman analysis in subgroups defined by hepatic steatosis
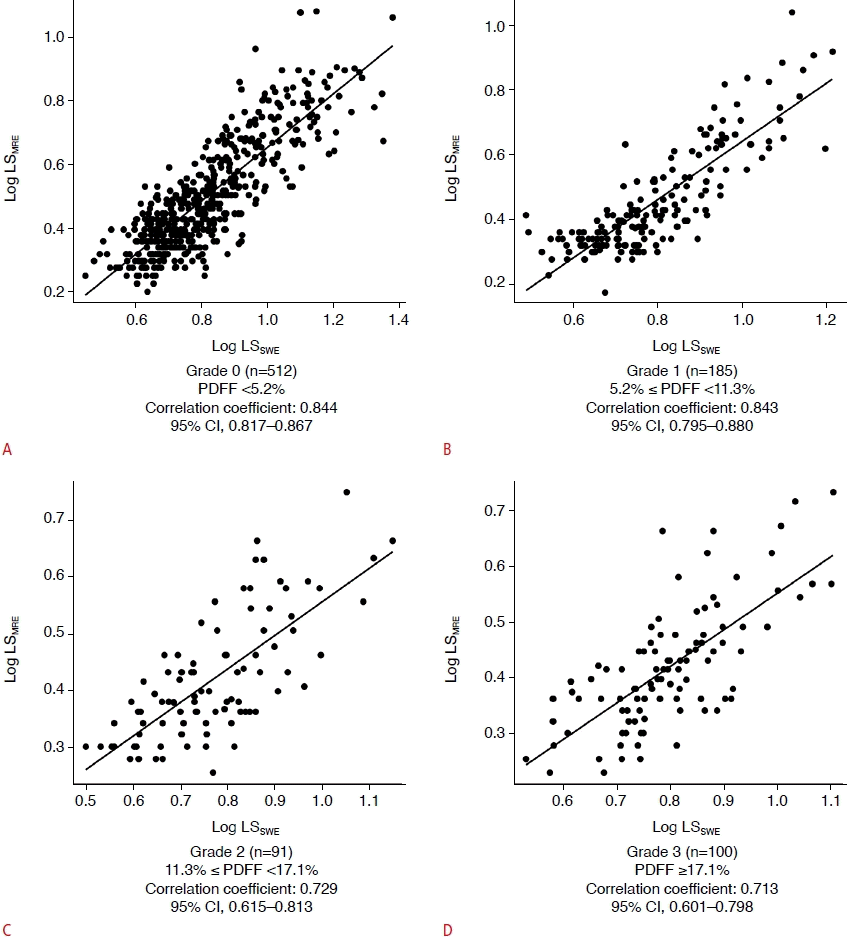
Intraclass correlation coefficients (ICCs) according to steatosis grade.
The correlation between different PDFF is shown: grade 0 (n=512), PDFF <5.2% (A); grade 1 (n=185), 5.2%≤PDFF<11.3% (B); grade 2 (n=91), 11.3%≤PDFF<17.1% (C); grade 3 (n=100), PDFF ≥17.1% (D). LSMRE, liver stiffness according to magnetic resonance elastography; LSSWE, liver stiffness according to twodimensional shear-wave elastography; CI, confidence interval.
Discussion
In this study, Bland-Altman analysis revealed that LSMRE and LSSWE showed good agreement. With the Bland-Altman method, using correlations as a measure of agreement is problematic because this method actually assesses the ordering of the LSSWE and LSMRE values and their relative spacing, rather than whether or not the numbers themselves agree. In this study, the ICC indicated almost perfect agreement (r=0.823). Bland-Altman plots comparing two methods are very useful for assessing agreement. However, if the numbers are incommensurate, it makes no sense to try to determine whether they agree. The two sets of measurements used in Bland-Altman analysis must be normally distributed, and to achieve this, the LSSWE and LSMRE values were log-transformed [20]. In addition, when both measures are continuous and are roughly normally distributed, they can be converted to standardized scores [21–23]. Many studies have demonstrated that this transformation is methodologically acceptable [21-23,26,27]. In general, elasticity properties such as the shear modulus (μ) and Young modulus (E) describe the mechanical responses of a medium under shear stress and longitudinal stress, respectively. The Young modulus is the ratio between longitudinal stress and longitudinal strain, and the shear modulus is the ratio between shear stress and shear strain. Since the Poisson ratio (γ) for most soft tissues is very close to that of an incompressible liquid (γ=0.5), the shear modulus and Young modulus in the liver differ by a scaling factor of 3: E=3μ [31]. In previous studies, LS measured by FibroScan and the Aixplorer ultrasound system showed three-fold greater values than those measured by MRE [5,31–33]. However, LS obtained with a LOGIQ ultrasound system showed lower values than those derived with FibroScan or the Aixplorer ultrasound system [34,35]. Previous reports showed that the ratio of LS-SWE to LS-MRE values ranged from 2.10 to 2.95 for FibroScan [8,9,32,36,37], from 2.54 to 6.09 for Aixplorer [5,12] and from 1.94 to 2.23 for LOGIQ [9,36]. FibroScan and 2D-SWE have different shear-wave frequencies, and their respective excitation methods are mechanical force and the acoustic radiation force impulse. In addition, 2D-SWE values differ depending on the device, but the details of device-specific measurement methods have not been published, and this information remains a black box. Therefore, Iijima et al. [38] examined the measured values among instruments from six companies and reported that the correlation between models was good compared to TE, which is generally considered the gold standard for liver fibrosis, and that the diagnosis of fibrosis was comparable regardless of which instrument was used. Furthermore, a conversion equation from 2D-SWE to TE has been developed and can be applied clinically [38].
The 2D-SWE assessments in the present study were performed using the LOGIQ S8, E9, or E10 system (GE Healthcare), and MRE was evaluated using a 3.0-T MRI system (GE Healthcare). This aligns with the report by Iijima et al. [38], and the authors believe that this methodology yielded acceptable results for daily clinical practice.
In the present study, the mean LSSWE value was 2.197 (±0.479) times higher than the mean LSMRE value. Based on this finding, the two measurements were converted to the same scale using simple linear regression, described above. Critchley and Critchley [25] reported that the precision and acceptability of one technique can then be compared with those of another, usually a reference method, such as thermodilution for cardiac output. In their article, they provided three objective criteria for deciding whether to accept or reject a new method: (1) a limit of agreement of less than 1 L/min, (2) a percentage limit of agreement of less than 20%, and (3) the finding that over 75% of readings vary from the mean by less than 20%. In this study, the calculated expected LoA was 17.118% (95% CI, 16.6353% to 17.6002%). The objective criterion of 20% provided by Critchley and Critchley was replaced with 17.1178% in the present study, and it was found that criteria 1 and 2 were not satisfied, but criterion 3 was. In practice, 789 of the 888 patients (88.9%) showed a percentage difference within 17.1178%, thus meeting objective criterion 3. Therefore, the interchangeability of 2D-SWE and MRE values was demonstrated by Bland-Altman analysis in this study.
The ICCs indicated almost perfect agreement between LSSWE and LSMRE in patients with BMI <30.0 kg/m2 and degree of steatosis <11.3%. The ICCs in patients with BMI ≥30.0 kg/m2 and the degree of steatosis ≥11.3% were lower, but still indicated substantial agreement. Liver fibrosis assessment by LSSWE may be unreliable in obese patients, though the recent development of the XL probe for FibroScan has circumvented this problem to a certain extent [39,40]. A C1-6-D abdominal convex probe at a frequency of 1–4 MHz was used in all patients. The differences in ICCs between LSSWE and LSMRE values for different BMI values and degrees of hepatic steatosis were deemed to be acceptable. This procedure is likely to be less affected by obesity than other approaches.
In this study, 29 patients demonstrated a discrepancy between 2D-SWE and MRE values, specifically 23 in the upper group and six in the lower group. All six patients in the lower group had poor-quality B-mode images (6/6, 100%), while five had a mixture of red and blue colors on color-coded 2D-SWE maps (5/6, 83.3%). The SWE values were considered to be inaccurate because no problems could be found with the MRE measurements. Twenty-three patients in the upper group also had poor-quality B-mode images (13/23, 56.5%), and 22 exhibited a mixture of red and blue colors on color-coded 2D-SWE maps (22/23, 95.7%). In addition, the patients in the upper group had significantly higher FIB-4 scores than those in the non-divergent group. The MRE values most likely correctly reflected the fibrosis state in this group because 2D-MRE values are sometimes inaccurate in the presence of advanced fibrosis [41].
The present study has several limitations. First, the 2D-SWE technique is operator-dependent, and simultaneous measurements in the same patient may vary depending on the operator’s expertise. Compared with LSSWE, LSMRE has higher repeatability and reproducibility and thus provides more reliable LS measurements [42,43]. In this series, three experienced sonographers with at least 10 years of clinical experience in performing abdominal ultrasound examinations performed 2D-SWE, and there were few technical issues. Second, this study was retrospective in nature. However, almost all consecutive patients with chronic liver disease who visited the authors’ institution underwent MRE, and selection bias was unlikely. Third, few liver biopsies were performed in this study. However, the original aim was to directly compare 2D-SWE and MRE to determine if the two methods are interchangeable. Fourth, there are relatively few individuals in Japan with a BMI ≥30 kg/m2, and this study therefore had insufficient power for analyzing this group, in which 2D-SWE is less accurate. Fifth, there were sampling differences between 2D-SWE and MRE. MRE measures a larger area of the liver than 2D-SWE, and this difference should be kept in mind when evaluating the results obtained with both methods.
In conclusion, Bland-Altman analysis demonstrated that LSSWE and LSMRE were interchangeable within a clinically acceptable range.
Notes
Author Contributions
Conceptualization: Ichikawa H, Kumada T, Yasuda E. Data acquisition: Ichikawa H, Yasuda E, Kumada T, Takeshima K, Ogawa S, Tsunekawa A, Goto T, Nakaya K, Akita T, Tanaka J. Data analysis or interpretation: Takeshima K, Ogawa S, Tsunekawa A, Goto T, Nakaya K. Drafting of the manuscript: Ichikawa H, Kumada T, Yasuda E. Critical revision of the manuscript: Ichikawa H, Kumada T, Yasuda E. Approval of the final version of the manuscript: all authors.
No potential conflict of interest relevant to this article was reported.
Supplementary Material
The results of Bland-Altman analysis (n=888) https://doi.org/10.14366/usg.22052).
Correlation of advanced fibrosis defined by 2D-SWE and MRE values https://doi.org/10.14366/usg.22052).
Correlation between two-dimensional shearwave elastography (2D-SWE) and magnetic resonance elastography (MRE). The liver stiffness according to MRE (LSMRE) and liver stiffness according to 2D-SWE (LSSWE) values were correlated, showing substantial agreement. The Spearman rank correlation coefficient is 0.786 (95% confidence interval [CI], 0.761 to 0.811; P<0.001). The dashed line shows the 95% CI. Patients with an upward divergence are classified as the upper group (n=23), those with a downward divergence as the lower group (n=6), and those within the 95% CI, as the non-divergent group (n=859) https://doi.org/10.14366/usg.22052).
References
Article information Continued
Notes
Key point
Many studies have demonstrated that magnetic resonance elastography (MRE) has the same or significantly better diagnostic accuracy than two-dimensional shear-wave elastography (2D-SWE) for detecting fibrosis stages using liver biopsy as a reference. Bland- Altman analysis of 2D-SWE and MRE showed that the mean, upper limit of agreement (LoA), and lower LoA expressed in terms of the percentage difference were -0.5944%, 19.8950%, and -21.0838%, respectively. The calculated expected LoA was 17.1178%, and 789 of 888 patients (88.9%) had a percentage difference within the expected LoA. Bland-Altman analysis demonstrated that 2D-SWE and MRE were interchangeable within a clinically acceptable range.