The efficiency of contrast-enhanced endoscopic ultrasound (EUS) combined with EUS elastography for pancreatic cancer diagnosis: a systematic review and meta-analysis
Article information

Abstract
Purpose
This study aimed to evaluate the performance characteristics of endoscopic ultrasound (EUS) elastography combined with contrast-enhanced EUS (CE-EUS) for the diagnosis of pancreatic malignancy among solid pancreatic lesions (SPLs).
Methods
A comprehensive literature search using MEDLINE, Embase, and the Cochrane Library was performed from January 1991 through December 2020. The pooled performance characteristics, including sensitivity, specificity, positive likelihood ratio (LR+), negative likelihood ratio (LR-), and diagnostic odds ratio (OR), were calculated using Meta-DiSc 1.4.
Results
In total, 430 patients with 282 pancreatic malignancies were included in the metaanalysis. The pooled sensitivity, specificity, LR+, LR-, and diagnostic OR were 84% (95% confidence interval [CI], 80% to 88%), 85% (95% CI, 78% to 90%), 5.31 (95% CI, 2.57 to 10.97), 0.15 (95% CI, 0.07 to 0.34), and 67.72 (95% CI, 12.84 to 357.26) for the combination of CE-EUS and EUS elastography, respectively. In these same studies, the corresponding performance characteristics for EUS elastography were 87% (95% CI, 82% to 90%), 56% (95% CI, 48% to 64%), 2.28 (95% CI, 1.43 to 3.63), 0.12 (95% CI, 0.03 to 0.42), and 22.60 (95% CI, 5.81 to 87.92), respectively. In these same studies, the respective performance characteristics for CE-EUS were 84% (95% CI, 80% to 88%), 78% (95% CI, 70% to 84%), 3.80 (95% CI, 1.92 to 7.53), 0.13 (95% CI, 0.04 to 0.41), and 31.29 (95% CI, 6.12 to 159.87).
Conclusion
CE-EUS and EUS elastography are reliable supplemental techniques for the characterization of SPLs and diagnosis of pancreatic malignancies. However, more studies assessing the combined utilization of both procedures are needed.
Introduction
Endoscopic ultrasonography (EUS) is a widely used diagnostic modality to evaluate pancreaticobiliary diseases, especially solid pancreatic lesions (SPLs), and it has a good ability to detect pancreatic masses. However, EUS has a limited ability to distinguish the diagnoses of lesions, and thus, EUS with fine needle biopsy (EUS-FNB) is the current gold standard for diagnosing pancreatic tumors (largely replacing fine needle aspiration [FNA]), with sensitivity, specificity and accuracy of 54%-96%, 96%-98%, and 83%-95%, respectively [1-4]. EUS has been evolving further, and new techniques–such as EUS elastography and contrast-enhanced EUS (CE-EUS)–have emerged with the goal of increasing the accuracy, sensitivity, and specificity of EUS for the diagnosis of SPLs. EUS elastography can evaluate tissue densities and differentiate the characteristics of various lesions from the surrounding pancreatic tissue. CE-EUS utilizes an intravenous injection of a contrast agent to assess vascular structures to distinguish benign from malignant pancreatic lesions.
CE-EUS is a newer imaging modality utilizing an ultrasonographic contrast agent to visualize blood flow in fine vessels and to evaluate SPLs [5-7]. The two subtypes of CE-EUS are contrast-enhanced Doppler EUS and contrast-enhanced harmonic EUS (CH-EUS). CH-EUS utilizes an air-filled microbubble contrast material that creates signaling intensity in blood vessels compared to the surrounding tissue, allowing the selective detection of vascular lesions and increased sensitivity, specificity, and overall diagnostic accuracy of SPLs compared to conventional EUS [5-7]. Hypoenhancement in CH-EUS was found in a recent meta-analysis to have a pooled diagnostic sensitivity and specificity of 94% and 89%, respectively. with the added benefit of clearly delineating the outlines of ductal carcinomas in settings where conventional EUS is uncertain, which has implications in identifying the target lesion for performing FNA [1,8]. In contrast, EUS elastography is based on the principle of elastography or elasticity, in which tissue compression produces strain, and alterations of strain can be detected and displayed in real time utilizing conventional B-mode images and special software. This technique makes it possible to distinguish different types of tissues and assess different pathologic states within the same tissue by detecting differences in elasticity [5,9-11]. Several meta-analyses have evaluated the diagnostic performance of EUS elastography for identifying malignant pancreatic tumors. The authors reported high sensitivity (92%-98%) but low specificity (67%-76%) [12-18].
The combination of EUS elastography and CE-EUS has not been extensively studied in the evaluation of SPLs. Because of the continued evolution of endosonographic techniques, the aim of the present study was to assess the diagnostic effectiveness of EUS elastography combined with CE-EUS for the diagnosis of SPLs by calculating the pooled sensitivity, specificity, positive likelihood ratio (LR+), negative likelihood ratio (LR-), and diagnostic odds ratio (OR) from studies that compared the two modalities.
Materials and Methods
The systematic review and meta-analysis was prepared and revised according to the Preferred Reporting Items for Systematic Review and Meta-Analyses 2020 (PRISMA 2020) extension for diagnostic test accuracy.
Search Strategy
A comprehensive literature search using the MEDLINE, Embase, and Cochrane Library databases was performed from January 1991 through December 2020. The search formula for all three databases was: (eus OR 'endoscopic ultrasound' OR ultrasonography OR endosonography) AND ('contrast-enhanced' OR 'contrast enhancement' OR 'contrast imaging' OR 'ce eus' OR 'contrast enhanced endosonography' OR 'contrast enhanced endoscopic ultrasound') AND (elastography OR endoelastography OR elasticity) AND (pancreas OR 'pancreatic lesion' OR 'solitary pancreatic lesion' OR 'pancreatic mass' OR 'pancreatic cancer'). There were no language restrictions. This study was limited to articles published after 1991, when elastography was invented.
Selection Criteria
The articles eligible for inclusion were limited to retrospective and prospective manuscripts or abstracts studying the diagnostic accuracy of CE-EUS, EUS elastography, and their combined use for distinguishing pancreatic adenocarcinoma among SPLs. In addition, the studies were required to use histology of EUS-FNB samples and/or surgical specimens to confirm the histopathologic diagnosis and to have a minimum follow-up of 6 months for patients without surgical or EUS-FNB samples to classify as chronic pancreatitis. Furthermore, the studies were required to have used chronic pseudotumoral pancreatitis as a control group and provide contingency tables or adequate data to extrapolate contingency tables based on sensitivity, specificity, and/or accuracy.
The exclusion criteria were the inclusion of cystic pancreatic lesions and/or malignancies other than pancreatic adenocarcinoma with a lack of a subgroup analysis to extrapolate contingency tables for the targeted research aim, overlap within selected studies such as same study group, research institution, and period of inclusion, and lack of confirmatory diagnostic testing with either EUS-FNB, surgical histology, or appropriate follow-up/surveillance intervals. All reviews, editorials, and letters that did not report their own data were excluded from the study, as were case reports or case series. Technical studies that focused on the technology of CE-EUS and EUS elastography and studies including non-pancreatic cancer or either EUS elastography or CE-EUS were excluded.
Statistical Analysis and Quality Assessment
A meta-analysis for CE-EUS, EUS elastography, and their combined use was performed by calculating pooled estimates of diagnostic accuracy indices, including the sensitivity, specificity, LR+, LR-, and diagnostic OR based on provided or extrapolated contingency tables. Summary receiver operating characteristics (SROC) curves were generated, and the area under the curve (AUC) and the Q* index (the point on the SROC curve where sensitivity and specificity are equal) were then calculated. Statistical analysis was conducted using the Meta-DiSc 1.4 software program (Ramóny Cajal Hospital, Madrid, Spain). Pooled results with 95% confidence intervals (CIs) were derived using the DerSimonian-Laird method (a random-effects model) [19], which was used when significant heterogeneity was present with a confidence level of 5.0. The Cochrane Q test was performed to detect heterogeneity among studies, with P-values <0.1 indicating the presence of heterogeneity [20]. Inconsistency (I2) was calculated to describe the variability attributable to heterogeneity rather than sampling errors, with an I2 >25% considered to indicate significant heterogeneity. The threshold effect was measured using Spearman’s correlation coefficient, with significance if the P-value is less than 0.05. The Quality Assessment of Diagnostic Accuracy Studies (QUADAS-2) questionnaire was used to assess the quality of the selected studies [21].
Results
Study Identification
The selection process is illustrated in Fig. 1. In total, 118 studies were found in the literature search. After screening and removal of duplicates, 19 articles were assessed by full text to establish their eligibility for the meta-analysis. Of the full-text articles, six were included for the meta-analysis, and 13 were excluded [22-27]. One study did prospectively assess CE-EUS and EUS elastography [5]. However, one case of pseudopapillary solid tumor was included along with 33 cases of pancreatic adenocarcinoma among the malignant lesions. Because performance outcomes for the EUS techniques could not be extrapolated for the 33 pancreatic adenocarcinoma cases, this study was excluded from the meta-analysis. The studies of Chantarojanasiri et al. [22] and Iordache et al. [25] required further calculation to extrapolate the contingency table of interest from the specificity and sensitivity values reported in the manuscript.
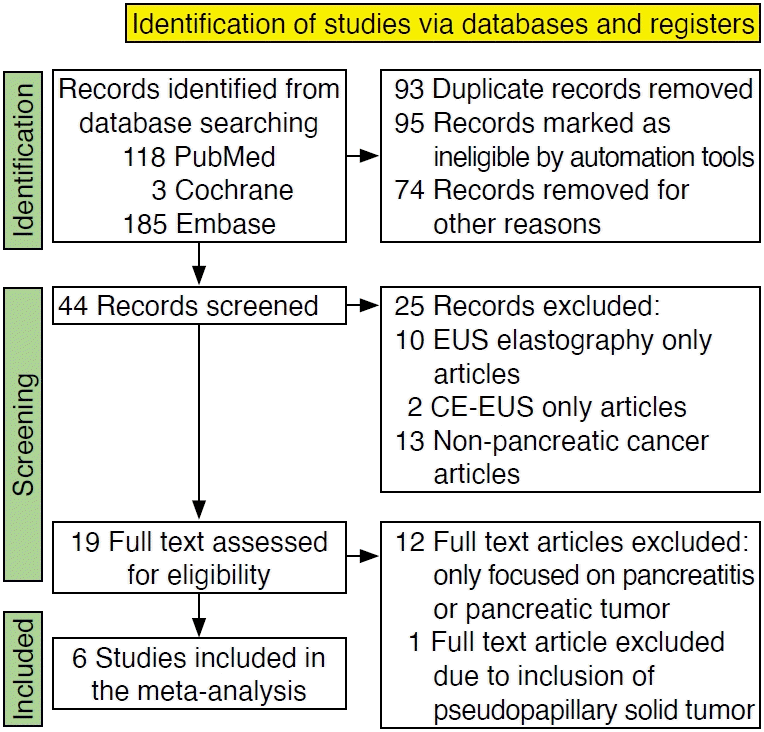
The study flow diagram demonstrating the algorithm for identifying studies to be included in the meta-analysis. EUS, endoscopic ultrasonography; CE, contrast-enhanced.
Study Characteristics
The characteristics of the studies included are summarized in Table 1. The studies were from a wide geographical spectrum including Romania, Germany, Spain, and Japan. Four studies were prospective, and two were retrospective. The CE-EUS contrast mode and agent, the diagnostic standard for CE-EUS and EUS elastography, and the final diagnosis method are summarized in Table 1. All studies except that of Chantarojanasiri et al. [22] used the Sonovue contrast agent and power Doppler. Diagnostic standards varied for elastography, as two studies used a mean hue histogram >175, two studies used a hue color map, one used a combination of a mean hue histogram and the strain ratio, and one used a mean strain histogram <80.
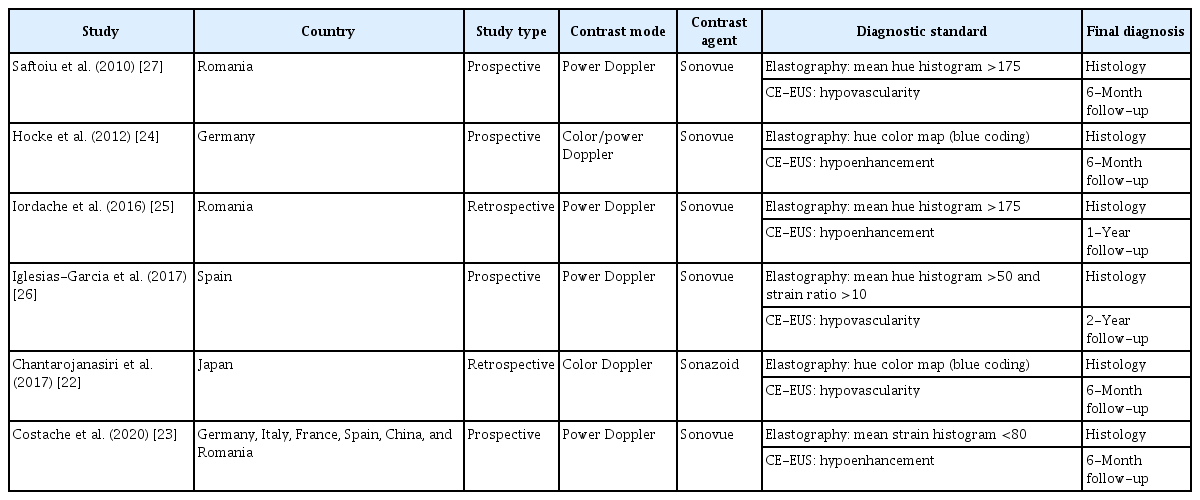
Characteristics of the studies, including country, contrast mode and agent, diagnostic standard, and final diagnosis method
The demographics of patients and characteristics of cancer from each study included in the meta-analysis are described in Table 2. A total of 430 patients met the inclusion criteria, 282 of whom were diagnosed with pancreatic adenocarcinoma. The mean age in the studies ranged from 60 to 69 years. The patients were mostly male (60%-69%). The mean size of cancer was provided in only three studies, and ranged from 25 to 40 mm. The mean hue histogram value and mean strain histogram were only provided in three studies. The location of cancer was provided in four studies, and the location was mostly in the head of the pancreas.
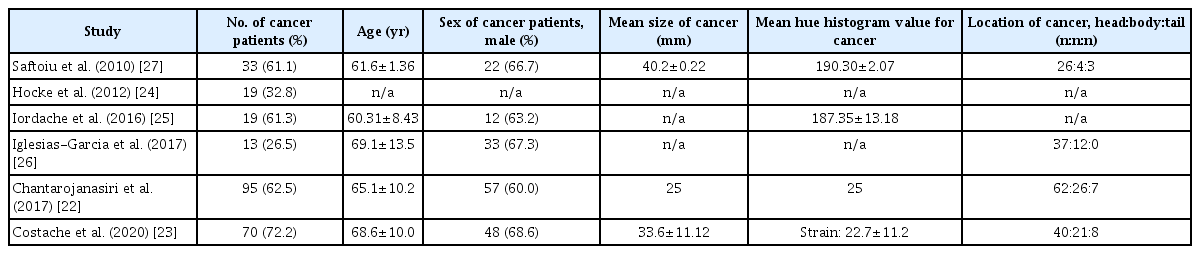
The demographics of patients and characteristics of pancreatic adenocarcinoma from each study included in the meta-analysis
Diagnostic Accuracy Analysis
A true-positive was defined as increased stiffness or a hard lesion by elastography and hypovascular or hypodense lesion on CE-EUS. A true negative was defined as decreased stiffness or soft lesion by elastography and a hypervascular or hyperdense lesion on CE-EUS. When comparing EUS elastography results from all six studies, high heterogeneity was observed for sensitivity (I2=91.6%, P<0.001), specificity (I2=84.7%, P<0.001), LR+ (I2=82.6%, P<0.001), LR-(I2=82.0%, P<0.001), and the diagnostic OR (I2=67.1%, P=0.010). The pooled analysis of diagnostic tests of EUS elastography with regard to the diagnosis of SPLs for pancreatic adenocarcinoma showed a sensitivity of 87% (95% CI, 82% to 90%), specificity of 56% (95% CI, 48% to 64%), LR+ of 2.28 (95% CI, 1.43 to 3.63), LR- of 0.12 (95% CI, 0.03 to 0.42), and diagnostic OR of 22.60 (95% CI, 5.81 to 87.92), as shown in Fig. 2. The SROC curve of EUS elastography is shown in Fig. 2F, with a calculated AUC of 0.8953. There was no threshold effect according to Spearman correlation analysis, with a P-value of 0.827.

Forest plots of the meta-analysis of sensitivity (A), specificity (B), LR+ (C), LR- (D), and diagnostic OR (E), as well as the SROC curve (F) for the differentiation of pancreatic adenocarcinomas with EUS elastography only [22-27]. AUC, area under the curve; CI, confidence interval; EUS, endoscopic ultrasonography; LR+, positive likelihood ratio; LR-, negative likelihood ratio; OR, odds ratio; SROC, summary receiver operating characteristic.
When comparing the CE-EUS results from all six studies, high heterogeneity was observed for sensitivity (I2=87.3%, P<0.001), specificity (I2=66.7%, P=0.010), LR+ (I2=80.0%, P<0.001), LR- (I2=84.7%, P<0.001) and the diagnostic OR (I2=83.8%, P<0.001). The pooled analysis of diagnostic tests of CE-EUS with regard to diagnosis of SPLs for pancreatic adenocarcinoma showed a sensitivity of 84% (95% CI, 80% to 88%), specificity of 78% (95% CI, 70% to 84%), LR+ of 3.80 (95% CI, 1.92 to 7.53), LR- of 0.13 (95% CI, 0.04 to 0.41), and diagnostic OR of 31.29 (95% CI, 6.12 to 159.87), as shown in Fig. 3. The SROC curve of CE-EUS is shown in Fig. 3F, with a calculated AUC of 0.9156. There was no threshold effect according to Spearman correlation analysis, with a P-value of 0.700.

Forest plots of the meta-analysis of sensitivity (A), specificity (B), LR+ (C), LR- (D), and diagnostic OR (E), as well as the SROC curve (F) for differentiation of pancreatic adenocarcinomas with CE-EUS only [22-27]. AUC, area under the curve; CE-EUS, contrast-enhanced endoscopic ultrasonography; CI, confidence interval; LR+, positive likelihood ratio; LR-, negative likelihood ratio; OR, odds ratio; SROC, summary receiver operating characteristic.
When comparing the results of CE-EUS combined with EUS elastography from all six studies, high heterogeneity was observed for sensitivity (I2=84.5%, P<0.001), specificity (I2=77.7%, P<0.001), LR+ (I2=62.2%, P=0.021), LR- (I2=80.3%, P<0.001), and the diagnostic OR (I2=73.5%, P=0.002). The pooled analysis of diagnostic tests of CE-EUS combined with EUS elastography with regard to diagnosis of SPLs for pancreatic adenocarcinoma showed a sensitivity of 84% (95% CI, 80% to 88%), specificity of 85% (95% CI, 78% to 90%), LR+ of 5.31 (95% CI, 2.57 to 10.97), LR- of 0.15 (95% CI, 0.07 to 0.34), and diagnostic OR of 67.72 (95% CI, 12.84 to 357.26), as shown in Fig. 4. The SROC curve of CE-EUS combined with EUS elastography is shown in Fig. 4F, with a calculated AUC of 0.9509. There was no threshold effect according to Spearman correlation analysis, with a P-value of 0.872.
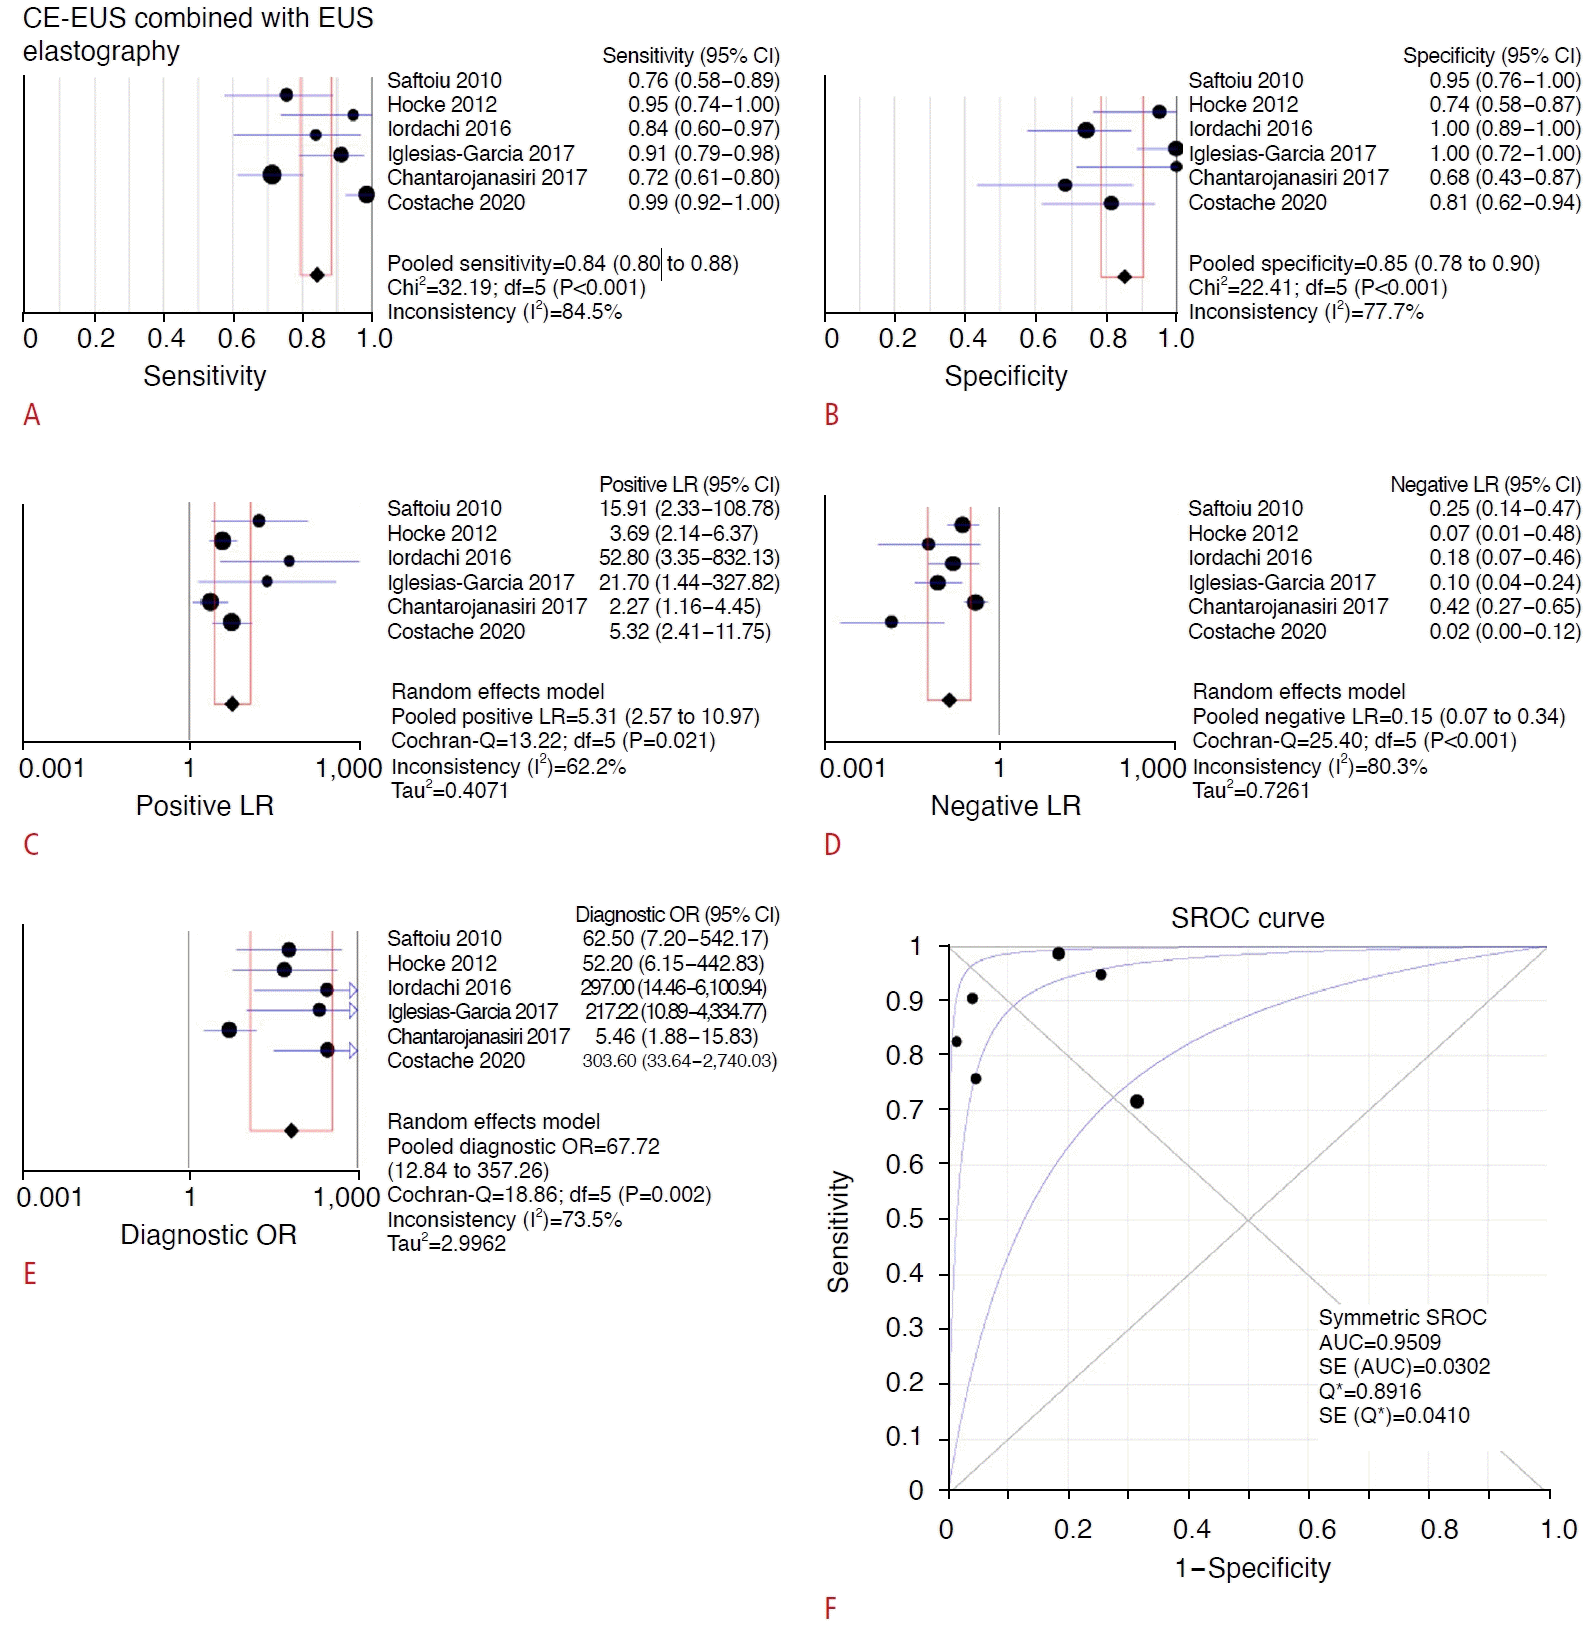
Forest plots of the meta-analysis of sensitivity (A), specificity (B), LR+ (C), LR- (D), and diagnostic OR (E), as well as the SROC curve (F) for differentiation of pancreatic adenocarcinomas with the combination of CE-EUS and EUS elastography [22-27]. AUC, area under the curve; CE-EUS, contrastenhanced endoscopic ultrasonography; CI, confidence interval; EUS, endoscopic ultrasonography; LR+, positive likelihood ratio; LR-, negative likelihood ratio; OR, odds ratio; SROC, summary receiver operating characteristic.
Risk of Bias
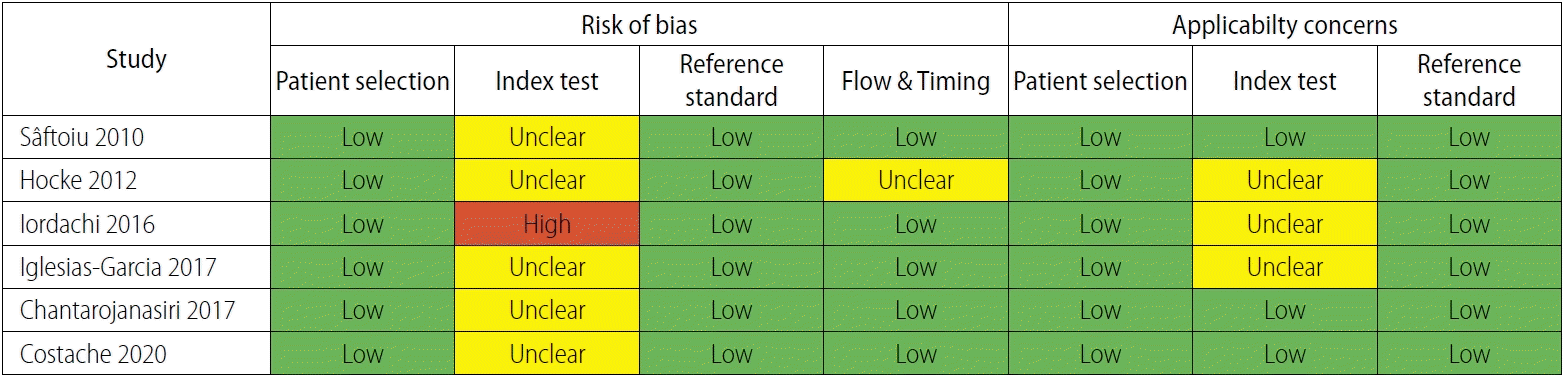
The QUADAS-2 questionnaire for assessment of the quality of the selected studies demonstrated high quality of the studies (Fig. 5). Regarding the "index test clearly described?" question, Hocke et al. [24], Iglesias-Garcia et al. [26], and Chantarojanasiri et al. [22] did not define the mean hue histogram cutoff value. With regard to the "withdrawals explained?" question, the study by Hocke et al. [24] included patients with solitary pancreatic lesions who were secondarily referred by outside centers to the researchers, so there were no withdrawals in that study. With regard to the "index test was performed blinded?" question, the patients all had SPLs that were known to the endosonographers, and in clinical practice, the endosonographer is not typically blinded to this information. The endosonographer was blinded regarding the status of malignancy when performing the procedure. However, Iordachi et al. [25] did not specify whether the endosonographer was blinded or not regarding the status of malignancy of the mass.
Discussion
Several meta-analyses evaluating the diagnostic performance of EUS elastography for diagnosing malignant pancreatic tumors have shown a diagnostic sensitivity of 92%-98% [12-18]. Similarly, in this meta-analysis, EUS elastography had a good diagnostic sensitivity of 87% for the diagnosis of pancreatic adenocarcinoma. However, the present study also demonstrates that this technique has poor specificity and significantly lower specificity compared to CE-EUS or the combined method. In the same review of the literature, the specificity of EUS elastography ranged broadly from 67% to 76%, likely owing to the high number of false-positives [12-18]. The limitations of elastography have been studied and are potential explanations for this observation. For one, operator dependency due to high image selection bias can lead to a lack of reproducibility [9,24]. However, in one study, a qualitative analysis of intra-observer variability revealed a kappa value of 0.72 and singlemeasure intraclass correlation coefficients ranging from 0.86-0.94, suggesting good inter-observer agreement [27]. Furthermore, excessive tissue compression can artificially cause more deformation, potentially rendering a malignant lesion as non-malignant.
Studies that investigated the efficacy of CE-EUS only or elastography were excluded from this meta-analysis. Including data from a single-method study was deemed to be not applicable to the goal of the study, which was to compare a combined method to a single method, and may introduce confounding and bias. Most of the studies included in this meta-analysis used hue histograms. Elasticity can be measured both qualitatively and quantitatively [22,28]. A semi-quantitative analysis utilizes two modalities: a hue histogram and the strain ratio. A hue histogram is generated by converting the elastography images to a graph by a program that further generates the mean histogram value from 0 (softest) to 255 (hardest), and the stain ratio is calculated based on the relative ratio of the elasticity of the target tissue from a reference value. Shear wave elastography, in contrast, estimates stiffness by measuring the propagation speed of the shear wave (the transverse wave, created by acoustic radiation impulses). In qualitative elastography, compression of harder tissues results in less tissue deformation, and the degree of deformation is represented with blue for less, yellow-green for intermediate, and red for greater deformation [29].
Studies have also demonstrated good performance outcomes of CE-EUS, with diagnostic sensitivity of 89%-96% and specificity of 64%-100% across several studies [1,5,8,10,18,30-34]. This study showed similarly excellent performance characteristics of CE-EUS, with a sensitivity of 84% and specificity of 78% for the diagnosis of pancreatic adenocarcinomas. Several limitations of CE-EUS that could explain the high false-positive rate–and, thus, low specificity–demonstrated in some studies have been proposed. These include differences in technique, differences in the contrast agents used, different criteria for defining the vascular patterns of lesions; and the presence of certain tissues, such as vessels, cysts, and bone, which could significantly influence elasticity measurements [5,10].
Significant heterogeneity was observed among the studies, likely owing to the high number of false-positives in the studies of Hocke et al. [24] and Costache et al. [23] for EUS elastography data, the high numbers of false-negatives and false-positives in the study of Chantarojanasiri et al. [22] in CE-EUS data, and the high false-negative rate in the studies of Saftoiu et al. [27] and Chantarojanasiri et al. [22] for CE-EUS combined with EUS elastography. The data of Saftoiu et al. [27], Chantarojanasiri et al. [22], and Costache et al. [23] all included about 10% of the cancers in the tail location, which in theory might have affected the diagnostic capability of CE-EUS and EUS elastography due to the difficulty of assessing pancreatic tail lesions using EUS. However, these lesions are still relatively easy to assess by EUS, especially with updated processors, and are unlikely to affect diagnostic outcomes/ yields. The study of Iglesias-Garcia et al. [26] which had 0 cancers in the tail, had higher diagnostic ORs in all three groups compared to those of Saftoiu et al. [27] and Chantarojanasiri et al. [22]. Currently, no study in the literature has discussed the influence of pancreatic lesion location on the performance of EUS.
Another factor contributing to significant heterogeneity was that the studies by Hocke et al. [24] and Chantarojanasiri et al. [22] did not define the mean hue histogram cutoff for malignancy [22,24]. This difference in technique could affect the diagnostic effectiveness of the EUS modalities. Because the appropriate cutoff values for quantitative elastography remain a matter of debate, there may have been a difference in the mean hue histogram threshold, which could generate different results [11]. The cutoff values for the strain ratio and hue histogram were generated by ROC curve analysis in the study by Iglesias-Garcia et al. [26], yielding a strain ratio >10 and a mean strain histogram value <50, instead of following a reference. It is necessary to standardize the method and establish definitive cutoffs in order to reduce heterogeneity in future studies.
A method to potentially standardize heterogeneity with regard to histogram and strain ratio cutoffs is to generate artificial intelligence–based systems with images and videos generated from the adjunctive EUS techniques of CE-EUS and EUS elastography and the corresponding pathology results. Aside from this potentially exciting application, CE-EUS and EUS elastography do have the potential to serve as clinically useful adjuncts to conventional EUS in the diagnosis of SPLs, but more studies–particularly in the United States–and greater experiences are needed before their role in the diagnostic approach to SPLs can be delineated.
B-mode is the conventional first method used to target a lesion. B-mode makes it possible to find the lesion, and then EUS elastography and CE-EUS are applied. B-mode only enables a characterization of a lesion as hypoechoic, hyperechoic, or heterogeneous, but not whether it is malignant or not. After a lesion is identified using B-mode, FNB of the identified lesion is performed. CE-EUS and EUS elastography for the purposes of this study are used to help further stratify the potential for malignancy. When comparing B-mode EUS to CE-EUS, CE-EUS remains superior for detecting pancreatic cancer [24,35]. Biopsies often result in non-diagnostic results; therefore, repeated EUS with FNB is needed, increasing costs. While this was not directly assessed in the present meta-analysis, this tool might assist in potentially stratifying patients who may need repeat sampling based on a high level of suspicion derived from EUS elastography and the CE-EUS characteristics of a lesion.
EUS-guided FNB is regarded as the technique of choice for diagnosis of focal pancreatic masses. EUS elastography and CE-EUS have emerged as newer techniques to characterize SPLs, with both techniques having excellent accuracy and high sensitivity. Neither technique, however, is currently approved by the Food and Drug Administration in the United States, and while the techniques have been increasingly adopted as adjunctive, supplemental tools for diagnosis of SPLs and pancreatic malignancy, they are still not widely available on the global scale. With regard to future applications of these two modalities, these techniques may bring significant improvement and guidance during clinical procedures by isolating high-yield targets within SPLs that may increase the diagnosis of pancreatic malignancies in questionable lesions, which, in turn, could limit unnecessary surgical resections and reduce postoperative morbidity and mortality, while also reducing the number of needle passes required to obtain good samples [1-5,8,11,18,24,27,30-34,36-39]. However, despite the advances made in these techniques, histologic diagnosis is still the gold standard and neither test is likely to replace sampling of the lesion in question.
This meta-analysis demonstrated that when EUS elastography was combined with CE-EUS, there was a pooled sensitivity of 84% and specificity of 85%. There was no statistically significant difference in measures of diagnostic accuracy compared to the use of each modality alone. The analysis was limited by the low sample sizes of eligible studies and the paucity of true-positives from both diagnostic tests in the same patient. However, EUS elastography combined with CE-EUS had the highest specificity and diagnostic OR among the three comparisons. Most prospective studies assessing EUS elastography and CE-EUS involved investigating each modality without incorporation of the other, which significantly limited the comparison of assessment of the efficacy of the combined techniques. Furthermore, a "true-positive" of the combination was defined as both techniques being separately positive for malignancy instead of having a combined criterion for positivity. This could lead to potential false-negatives, thus decreasing the sensitivity. However, this would not explain the poor specificity, as there was a relatively high number of false-positive results with both techniques combined. Insufficient data were provided to calculate the performance characteristics of the combination of both modalities if at least one of the methods was positive. Presumably, the diagnostic performance would be increased, and this would be of interest for future investigations.
Notes
Author Contributions
Conceptualization: Villa E. Data acquisition: Shin CM. Data analysis or interpretation: Shin CM. Drafting of the manuscript: Shin CM, Villa E. Critical revision of the manuscript: Shin CM, Villa E. Approval of the final version of the manuscript: all authors.
No potential conflict of interest relevant to this article was reported.
References
Article information Continued
Notes
Key point
Previous studies have studied the performance of endoscopic ultrasound (EUS) elastography combined with contrast-enhanced EUS. Currently, the efficacy of the combined modality is unclear. This meta-analysis revealed no statistically significant improvement for the combined method versus each modality used separately. More studies and greater experiences are needed before the role of these modalities in the diagnostic approach to solid pancreatic lesions can be delineated.