How many times should we repeat measurements of the ultrasound-guided attenuation parameter for evaluating hepatic steatosis?
Article information
Abstract
Purpose
This retrospective study aimed to determine the number of times the ultrasound-guided attenuation parameter (UGAP) should be measured during the evaluation of hepatic steatosis.
Methods
Patients with suspected nonalcoholic fatty liver disease who underwent two UGAP repetition protocols (six-repetition [UGAP_6] and 12-repetition [UGAP_12]) and measurement of the controlled attenuation parameter (CAP) using transient elastography between October 2020 and June 2021 were enrolled. The mean attenuation coefficient (AC), interquartile range (IQR)/median, and coefficient of variance (CV) of the two repetition protocols were compared using the paired t test. Moreover, the diagnostic performances of UGAP_6 and UGAP_12 were compared using the area under the receiver operating characteristic (AUROC) curve, considering the CAP value as a reference standard.
Results
The study included 160 patients (100 men; mean age, 50.9 years). There were no significant differences between UGAP_6 and UGAP_12 (0.731±0.116 dB/cm/MHz vs. 0.734±0.113 dB/cm/MHz, P=0.156) and mean CV (7.6±0.3% vs. 8.0±0.3%, P=0.062). However, the mean IQR/median of UGAP_6 was significantly lower than that of UGAP_12 (8.9%±6.0% vs. 9.8%±5.2%, P=0.012). In diagnosing the hepatic steatosis stage, UGAP_6 and UGAP_12 yielded comparable AUROCs (≥S1, 0.908 vs. 0.897, P=0.466; ≥S2, 0.883 vs. 0.897, P=0.126; S3, 0.832 vs. 0.834, P=0.799).
Conclusion
UGAP had high diagnostic performance in diagnosing hepatic steatosis, regardless of the number of repetitions (six repetitions vs. 12 repetitions), with maintained reliability. Therefore, six UGAP measurements seem sufficient for evaluating hepatic steatosis using UGAP.
Key points
Ultrasound-guided attenuation parameter (UGAP) had high diagnostic performance for hepatic steatosis. The six-repetition protocol of UGAP had comparable diagnostic performance in evaluating hepatic steatosis while maintaining reliability. Thus, only six, instead of 12 measurements, seem required when evaluating hepatic steatosis using UGAP.
Introduction
Nonalcoholic fatty liver disease (NAFLD) is an important disease that affects 1 billion people worldwide and can progress to nonalcoholic steatohepatitis (NASH) and cirrhosis in severe cases [1]. Approximately 20% of people with fatty liver will develop NASH [2], which is the most common cause of liver transplantation in women in North America [3]. The severity of NAFLD affects the treatment and survival rate [4,5]. Liver biopsy has been regarded as the gold standard for evaluating hepatic steatosis [6]. However, it has some limitations related to invasiveness and sampling errors [7], making it infeasible as a monitoring tool.
To address the limitations of liver biopsy, several noninvasive imaging-based methods have emerged as alternatives. Magnetic resonance imaging proton density fat fraction (MRI-PDFF) has been used as an accurate and reproducible method; however, it is expensive and less accessible [8]. Ultrasound-based methods are promising tools, and they have the advantage of high accessibility and efficiency despite some disadvantages (e.g., operator dependency and poor accuracy in cases of mild hepatic steatosis) [9]. Among ultrasound-based methods, the most validated tool for hepatic steatosis is the controlled attenuation parameter (CAP), which measures ultrasonic attenuation from transient elastography (TE), which was designed for the evaluation of hepatic fibrosis [10,11]. CAP correlates well with the histological grade of steatosis and enables the staging of hepatic steatosis with good performance [12–14].
The ultrasound-guided attenuation parameter (UGAP) was recently introduced as an ultrasound attenuation examination tool for assessing hepatic steatosis; it measures the attenuation coefficient (AC) (dB/cm/MHz) of B-mode ultrasonography based on the principle that the attenuation ratio of fatty liver is steeper than that of normal liver due to incomplete non-uniform compensation in fatty liver [15]. Previous studies have reported that this method showed excellent diagnostic performance for hepatic steatosis. Another advantage is that it can be used when visualizing the real-time B-mode scan of the region of interest (ROI) of the liver [15]. It also provides a quality map, as with two-dimensional shear wave elastography (2D-SWE). The Society of Radiologists in Ultrasound (SRU) guidelines suggest that five measurement repetitions are sufficient in 2D-SWE with quality maps [16]. Using fewer repetitions shortens the duration of the examination, thereby ultimately increasing cost-effectiveness and patient compliance in daily practice. To date, however, there is no consensus on the standard protocol of measurement, including the number of required repetitions.
Therefore, this study aimed to determine the number of times the UGAP should be measured during the evaluation of hepatic steatosis in patients suspected of having NAFLD.
Materials and Methods
Compliance with Ethical Standards
This retrospective study was approved by the Institutional Review board (2022-03-011) of Hallym University Sacred Heart Hospital. The board waived the requirement for informed consent.
Study Population
The study included eligible patients suspected of having NAFLD who underwent UGAP with B-mode ultrasonography from October 2020 to June 2021. The study included patients aged ≥19 years who underwent CAP via TE within 2 weeks after UGAP. The study excluded patients with (1) a history of alcoholic or chronic hepatitis with a known cause (e.g., hepatitis B virus or hepatitis C virus) and alcohol intake of >30 g (men) or >20 g (women) per day [4]; (2) suspected obstructive biliary tract disease; (3) clinically suspected congestive heart failure; (4) a history of right lobe resection of the liver or transarterial chemoembolization in the right lobe of the liver; and (5) unreliable UGAP and CAP measurements.
Clinical and Laboratory Data
Clinical data were obtained using the patients’ electronic medical records; the data included age, sex, weight, body mass index (BMI), aspartate aminotransferase, and alanine aminotransferase. The BMI was classified as normal (<25.0 kg/m2), overweight (25.0–29.9 kg/m2), or obese (≥30 kg/m2) according to the classification of the World Health Organization [17].
UGAP Measurement
An expert radiologist (with 13 years of experience in performing abdominal ultrasound) performed the UGAP measurements using a LOGIQ E10 ultrasound machine (GE Healthcare, Chicago, IL, USA) equipped with a C1–6 convex probe. All measurements were performed after the patient had fasted for ≥8 hours. The patient was placed in the supine position, and the right liver was measured in an intercostal view. Using the quality map option, which shows reliable measurements as a colored map, the best image was selected. Three ROIs (boxes 65 mm in length) were placed in the blue color-coded box on the quality map, avoiding large blood vessels, bile ducts, and cysts as much as possible (Fig. 1A). Twelve consecutive AC values were obtained from four quality maps with three AC values for each quality map, and the interquartile range (IQR)/median value was derived to evaluate reliability. An IQR/median value of <30% was considered as indicating a reliable measurement. The coefficient of variation (CV) was calculated as the ratio of the standard deviation to the mean value, and it was expressed as a percentage in order to assess repeatability. A lower CV value indicated higher repeatability [18,19]. The median AC value was regarded as the representative value, and it was expressed in dB/cm/MHz. Two median AC values per patient were obtained for the two UGAP repetition protocols (six-repetition [UGAP_6] vs. 12-repetition [UGAP_12]) as follows: UGAP_6 comprising the first six measurements (obtaining six AC values) and UGAP_12 comprising all 12 measurements (obtaining 12 AC values) (Fig. 1B). Additionally, the median AC values of the first three measurements on the first map (UGAP_3) and the first nine measurements from the first-third quality maps (UGAP_9) were obtained for each patient.
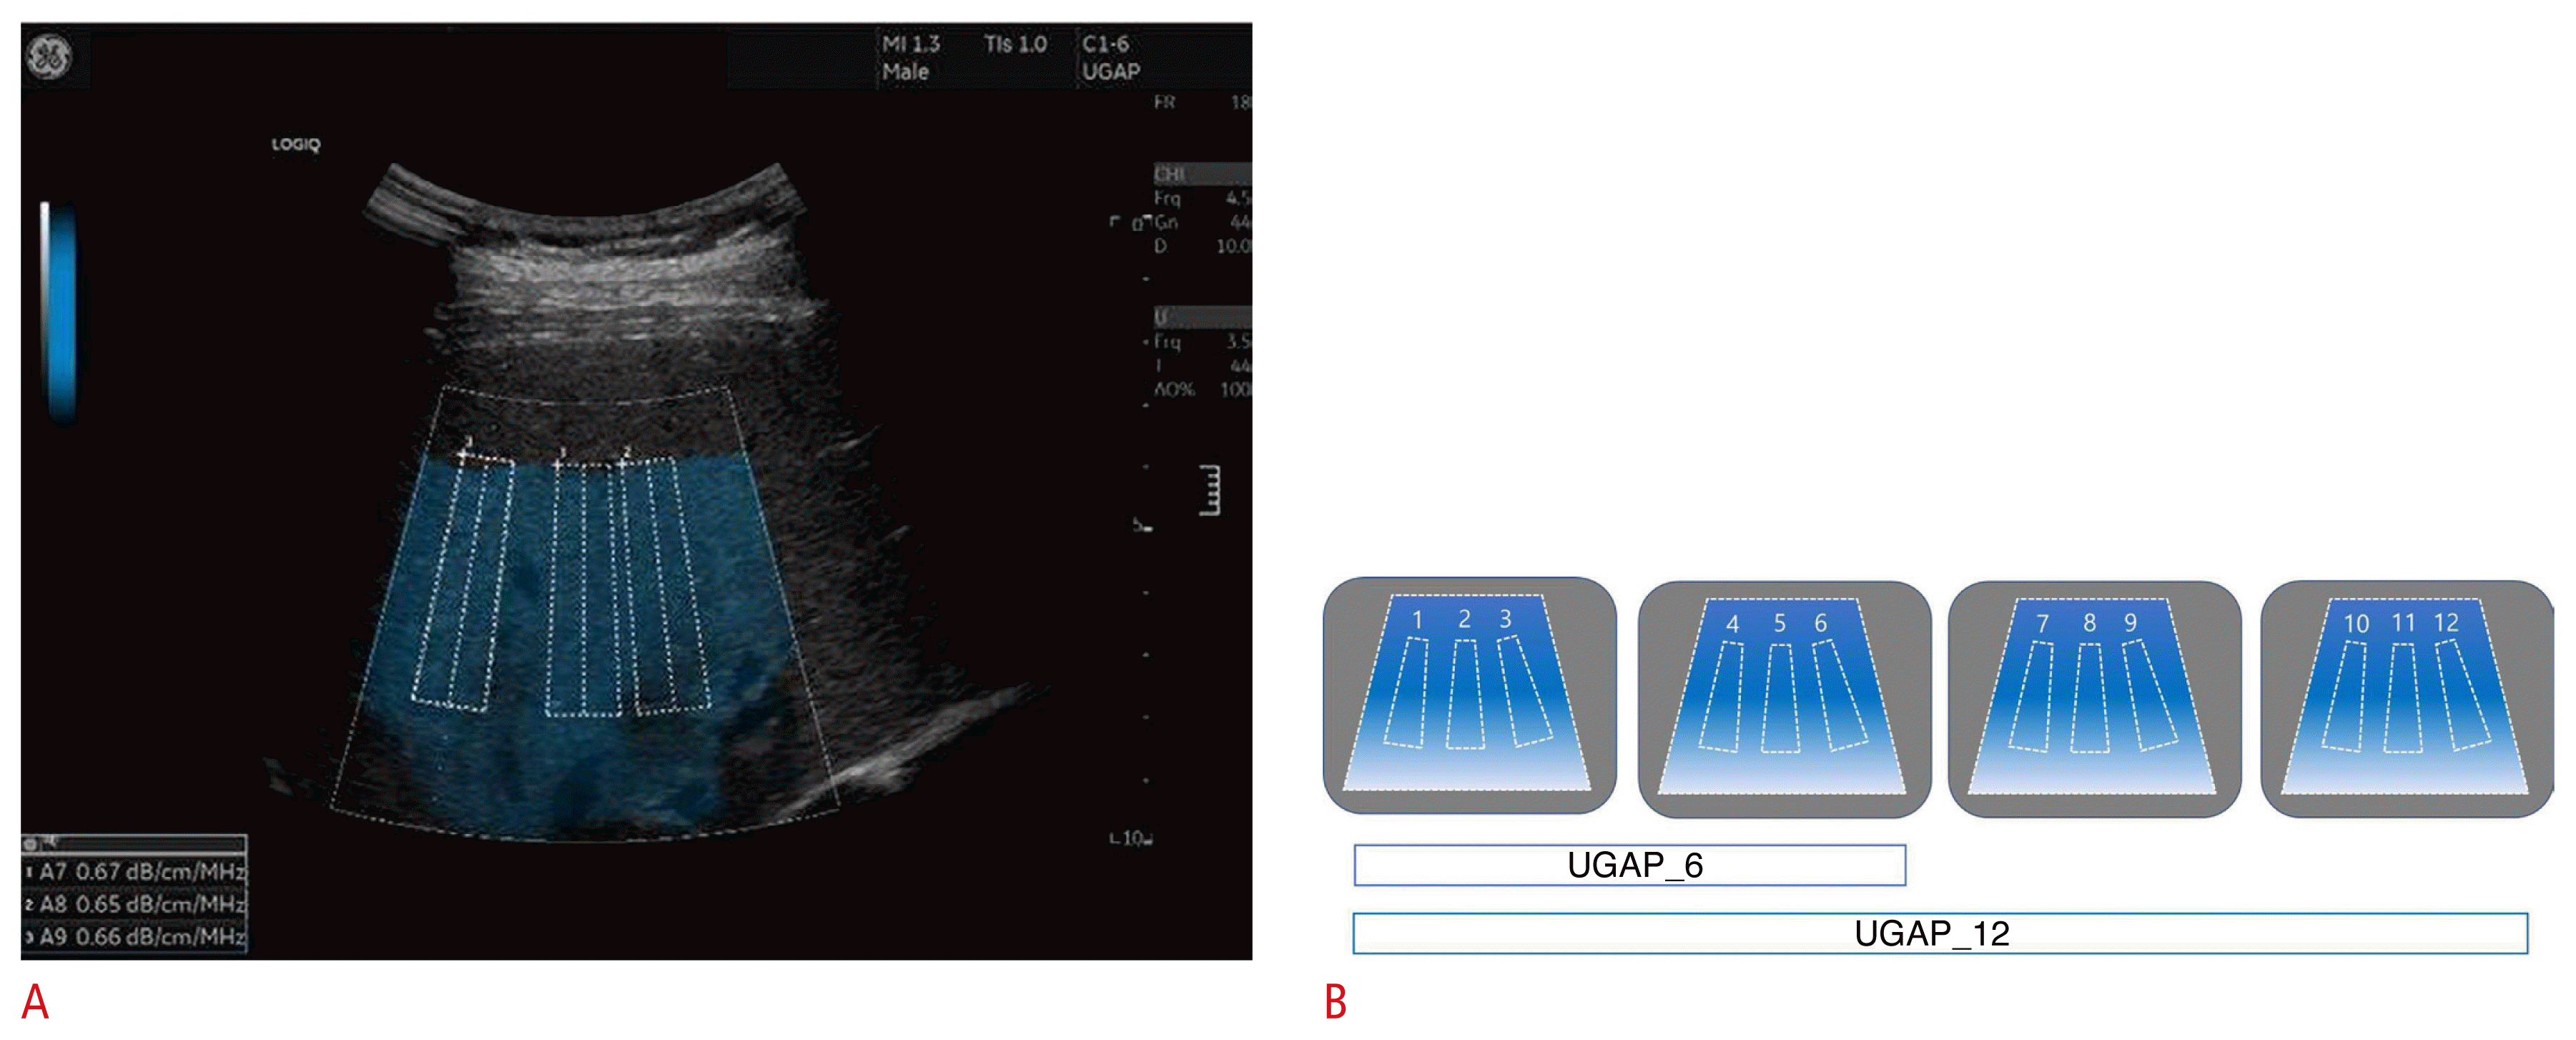
Ultrasound-guided attenuation parameter (UGAP) measurement and two types of repetition protocols.
A. B-mode ultrasonography image shows UGAP measurement. Three region of interest (ROI) boxes were put on the quality map, avoiding hepatic vessels. The attenuation coefficient (AC) value (dB/cm/MHz) was obtained on each ROI. B. A diagram shows two UGAP repetition protocols. After obtaining consecutive 12 AC values from four quality maps, two median AC values for the two UGAP repetition protocols were calculated using the first six AC values (UGAP_6) and all 12 AC values (UGAP_12), respectively.
TE and CAP Measurements
TE was performed using the FibroScan Touch 502 (EchoSens, Paris, France) equipped with the M and XL probes by certified operators with an experience of ≥5 years in performing ≥300 measurements. The probe (M or XL probe) was selected based on the skin-to-capsule distance (SCD) of each patient with the cutoff value of 25 mm using the B-mode scan [20]. All measurements were performed after the patient had fasted for more than 8 hours. The patient was placed in the supine position, and the right liver was measured in an intercostal view. The median liver stiffness (LS) value derived after 10 valid measurements was regarded as the representative value [21]. An IQR/median value of <30% and a success rate of measurement of >60% were considered indicative of a reliable LS measurement for fibrosis staging. The LS values are expressed in kilopascals (kPa). The fibrosis stage was determined using the LS value as follows: F2 (significant fibrosis) ≥7 kPa, F3 (severe fibrosis) ≥9 kPa, and F4 (cirrhosis) ≥11.8 kPa [22]. The median value was also regarded as the representative value of CAP [21]. An IQR of < 40 dB/m was considered indicative of a reliable measurement of CAP [23]. The CAP value was expressed in dB/m, and the steatosis stage was determined using the CAP value as follows: S1 (mild) ≥230 dB/m; S2 (moderate) ≥275 dB/m; and S3 (severe) ≥300 dB/m [24].
Statistical Analyses
Continuous values (e.g., AC and CAP values) were presented as mean with standard deviation, after normality was confirmed using the Kolmogorov–Smirnov test. Categorical values (e.g., frequencies) were presented as percentages, and they were compared using the chi-square test. The paired t test was used to determine if there was a difference in AC, IQR/median, and CV between the two UGAP repetition protocols. The degree of agreement and the correlation between the AC values of UGAP_6 and UGAP_12 were evaluated using the intercorrelation coefficient (ICC) and Pearson correlation coefficient. To evaluate the agreement of AC values between the two UGAP protocols, a Bland-Altman plot was used. The Pearson correlation coefficient was used to determine the relationship between the two UGAP protocols and the CAP value.
The diagnostic performances of UGAP_6 and UGAP_12 were evaluated and compared with the area under the receiver operating characteristic (AUROC) curve using the DeLong method, considering the CAP value as a reference standard [25]. The optimal cutoff AC values were determined for diagnosing S1, S2, and S3 using the Youden index [26]. Moreover, the differences in AC, IQR/median, and CV among UGAP_3, UGAP_6, UGAP_9, and UGAP_12 were compared using repeated-measures analysis of variance, and a post-hoc analysis was performed with the Bonferroni correction. The relationship between the four repetition protocols and CAP value, as well as the diagnostic performances of the four repetition protocols, were evaluated using the Pearson correlation coefficient and AUROC curves, respectively. A P-value of <0.05 was considered statistically significant. MedCalc version 20.015 (MedCalc software, Mariakerke, Belgium) and SPSS version 27 (IBM Corp., Armonk, NY, USA) were used for all statistical analyses.
Results
Characteristics of the Study Population
The study comprised 266 consecutive patients who underwent UGAP and CAP. Of these, 106 were excluded because of patient-related factors and measurement-related problems. The reasons included prior alcoholic or chronic hepatitis due to a known cause (n=33), unavailable CAP with TE within 2 weeks before or after UGAP (n=67), unreliable UGAP measurements (n=1), and unreliable CAP measurements (n=5) (Fig. 2). The main characteristics of the study population are presented in Table 1. The patients included in the final analysis (mean age, 50.9±15.1 years; 100 men and 60 women) consisted of 15 patients (9.4%) with S0, 21 patients (13.1%) with S1, 22 patients (13.8%) with S2, and 102 patients (63.7%) with S3, according to CAP values. The XL probe was used for 46 patients with SCD ≥25 mm, whereas the M probe was used for 114 patients with SCD <25 mm.

Study population.
UGAP, ultrasound-guided attenuation parameter; US, ultrasonography; CAP, controlled attenuation parameter; TE, transient elastography.
Comparison of AC, IQR/median, and CV between UGAP_6 and UGAP_12
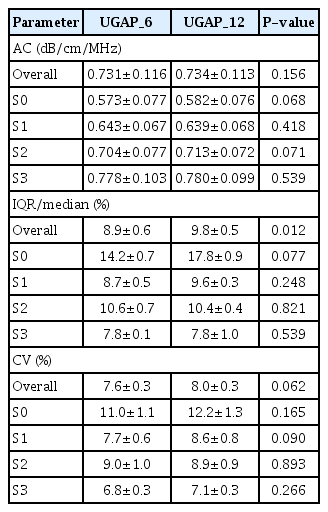
Table 2 shows the results of the comparison of AC, IQR/median, and CV between UGAP_6 and UGAP_12. The mean AC value of UGAP_6 (0.731±0.116 dB/cm/MHz) was not significantly different from that of UGAP_12 (0.734±0.113 dB/cm/MHz, P=0.156). There was a significant difference between UGAP_6 and UGAP_12 in the mean IQR/median value (8.9%±0.6% vs. 9.8%±0.5%, P=0.012). The proportion of IQR/median values <15% was significantly different between UGAP_6 and UGAP_12 (86.9% [139/160] vs. 88.7% [142/160], P<0.001). Of 160 patients, 131 presented an IQR/median value <15% in both the UGAP_6 and UGAP_12 protocols. The mean CV was not significantly different between the UGAP_6 and UGAP_12 protocols (7.6%±0.3% vs. 8.0%±0.3%, P=0.062). The differences in AC, IQR/median, and CV among UGAP_3, UGAP_6, UGAP_9, and UGAP_12 are summarized in Supplementary Table 1. The AC values were not significantly different among the four repetition protocols. However, the IQR/median and CV of UGAP_3 were significantly lower than those of other repetition protocols.
In the subgroups of hepatic steatosis, the AC values were not significantly different between the two repetition protocols regarding each hepatic steatosis stage (Table 2, Fig. 3). In addition, the AC values did not differ significantly between the two repetition protocols in the subgroups of hepatic fibrosis, BMI, and SCD (Supplementary Table 2). The IQR/median and CV values did not significantly differ between the two repetition protocols in each hepatic steatosis stage. However, the IQR/median of UGAP_6 was significantly lower than that of UGAP_12 in the subgroup of patients with significant fibrosis (≥ F2) and those with an SCD of < 25 mm. Moreover, the CV of UGAP_6 was significantly lower than that of UGAP_12 in the subgroup of patients with an SCD of <25 mm.

The attenuation values obtained using UGAP_6 and UGAP_12 in each hepatic steatosis grade.
AC, attenuation coefficient; UGAP, ultrasound-guided attenuation parameter; UGAP_6, 6-repeated measurements obtaining 6 attenuation coefficients using UGAP; UGAP_12, 12-repeated measurements obtaining 12 attenuation coefficients using UGAP. Red dot, outlier.
Relationships among UGAP_6, UGAP_12, and CAP
The ICC and Pearson correlation coefficient (r) of ACs between UGAP_6 and UGAP_12 were 0.990 (95% confidence interval [CI], 0.986 to 0.993) and 0.981 (95% CI, 0.974 to 0.986), respectively (P<0.001); this demonstrates excellent agreement and a very close correlation between UGAP_6 and UGAP_12 (Fig. 4). The 95% Bland-Altman limits of agreement between AC values obtained using UGAP_12 and UGAP_6 showed a mean value of 0.00 (95% limits of agreement, −0.05 to 0.04) (Fig. 5A). The 95% Bland-Altman limits of agreement between AC values obtained using UGAP_12 and UGAP_6 in each hepatic steatosis grade are shown in Fig. 5B–E.
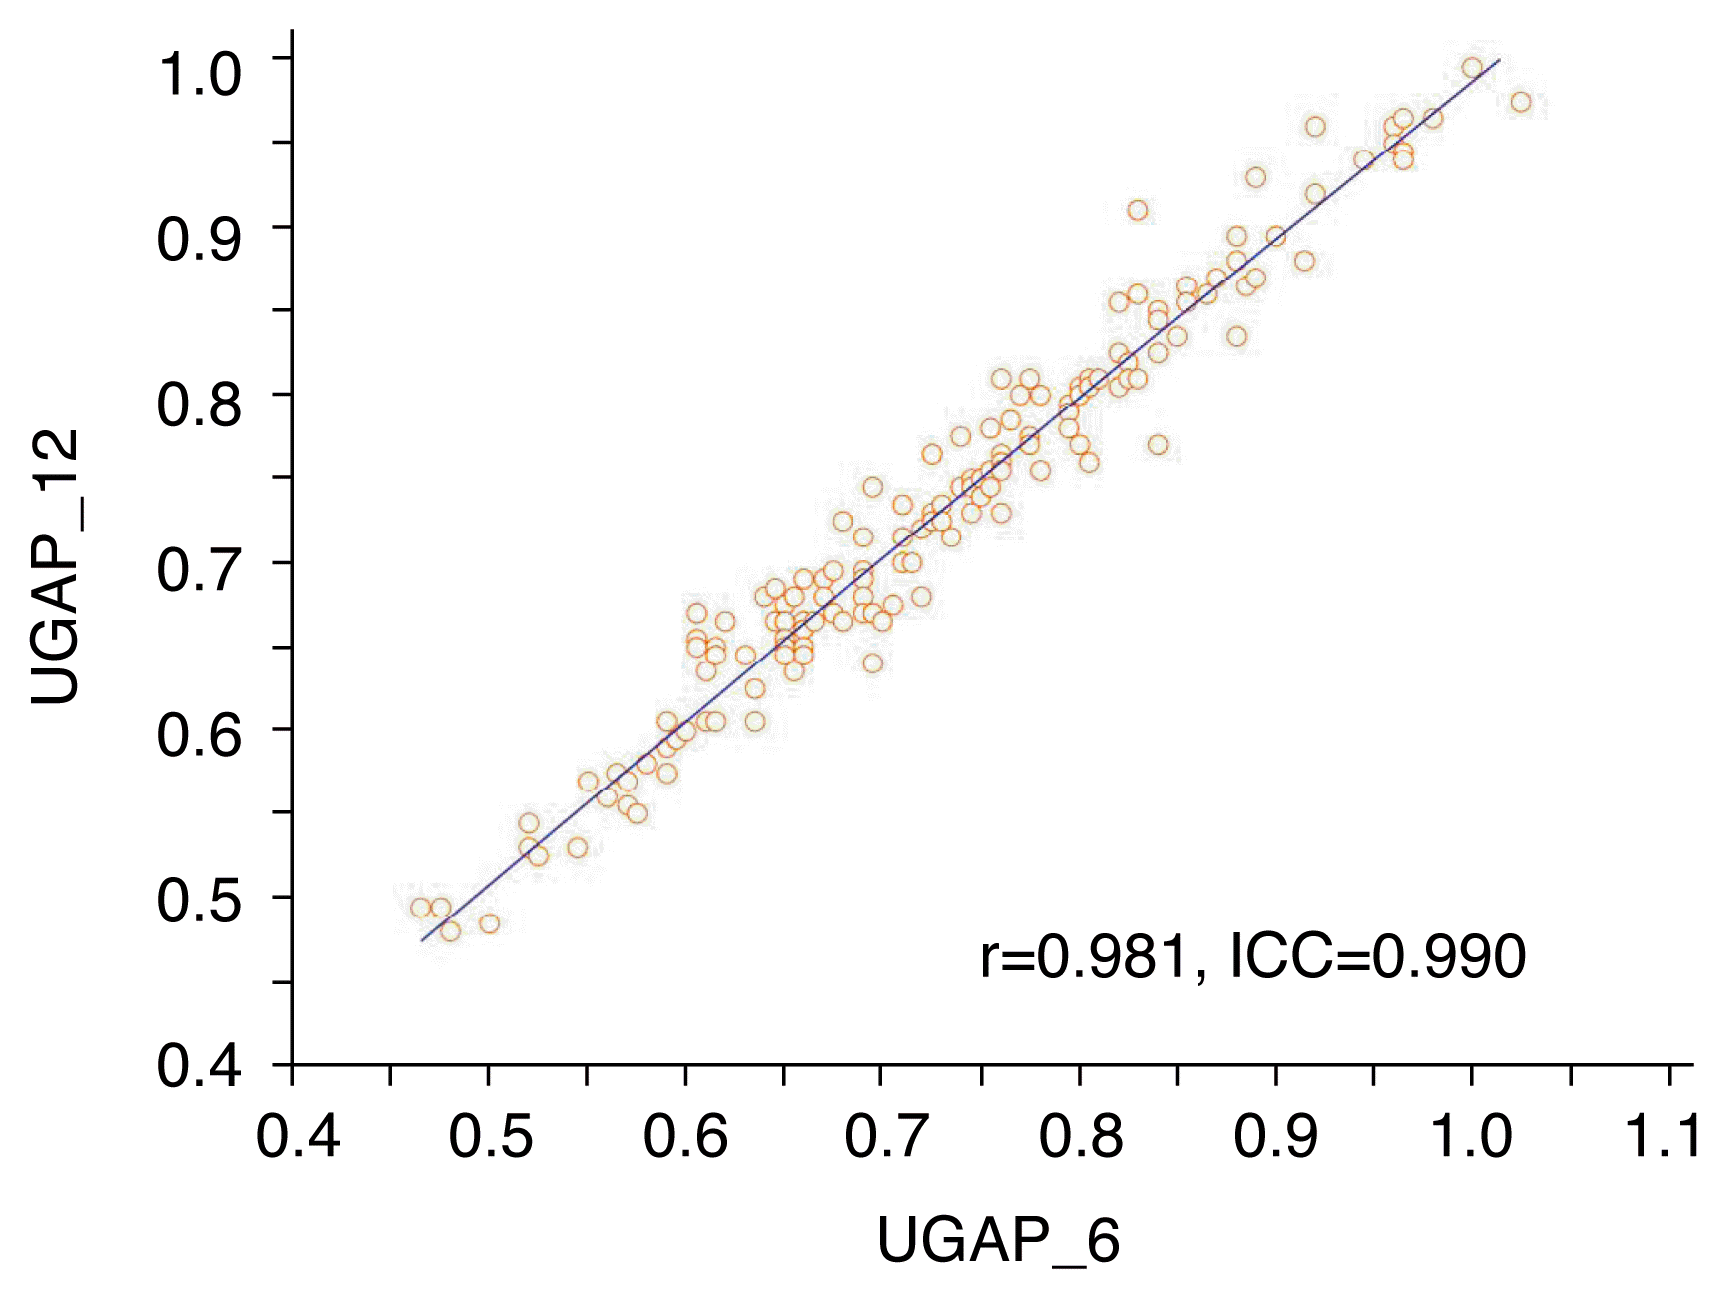
Scatterplots between the attenuation coefficient (AC) values obtained using UGAP_6 and UGAP_12.
The Pearson correlation (r) and intra-class correlation coefficient (ICC) are shown in the plot. The scatterplots show an excellent correlation between AC values obtained using UGAP_6 and UGAP_12. UGAP, ultrasound-guided attenuation parameter; UGAP_6, 6-repeated measurements obtaining 6 attenuation coefficients using UGAP; UGAP_12, 12-repeated measurements obtaining 12 attenuation coefficients using UGAP.
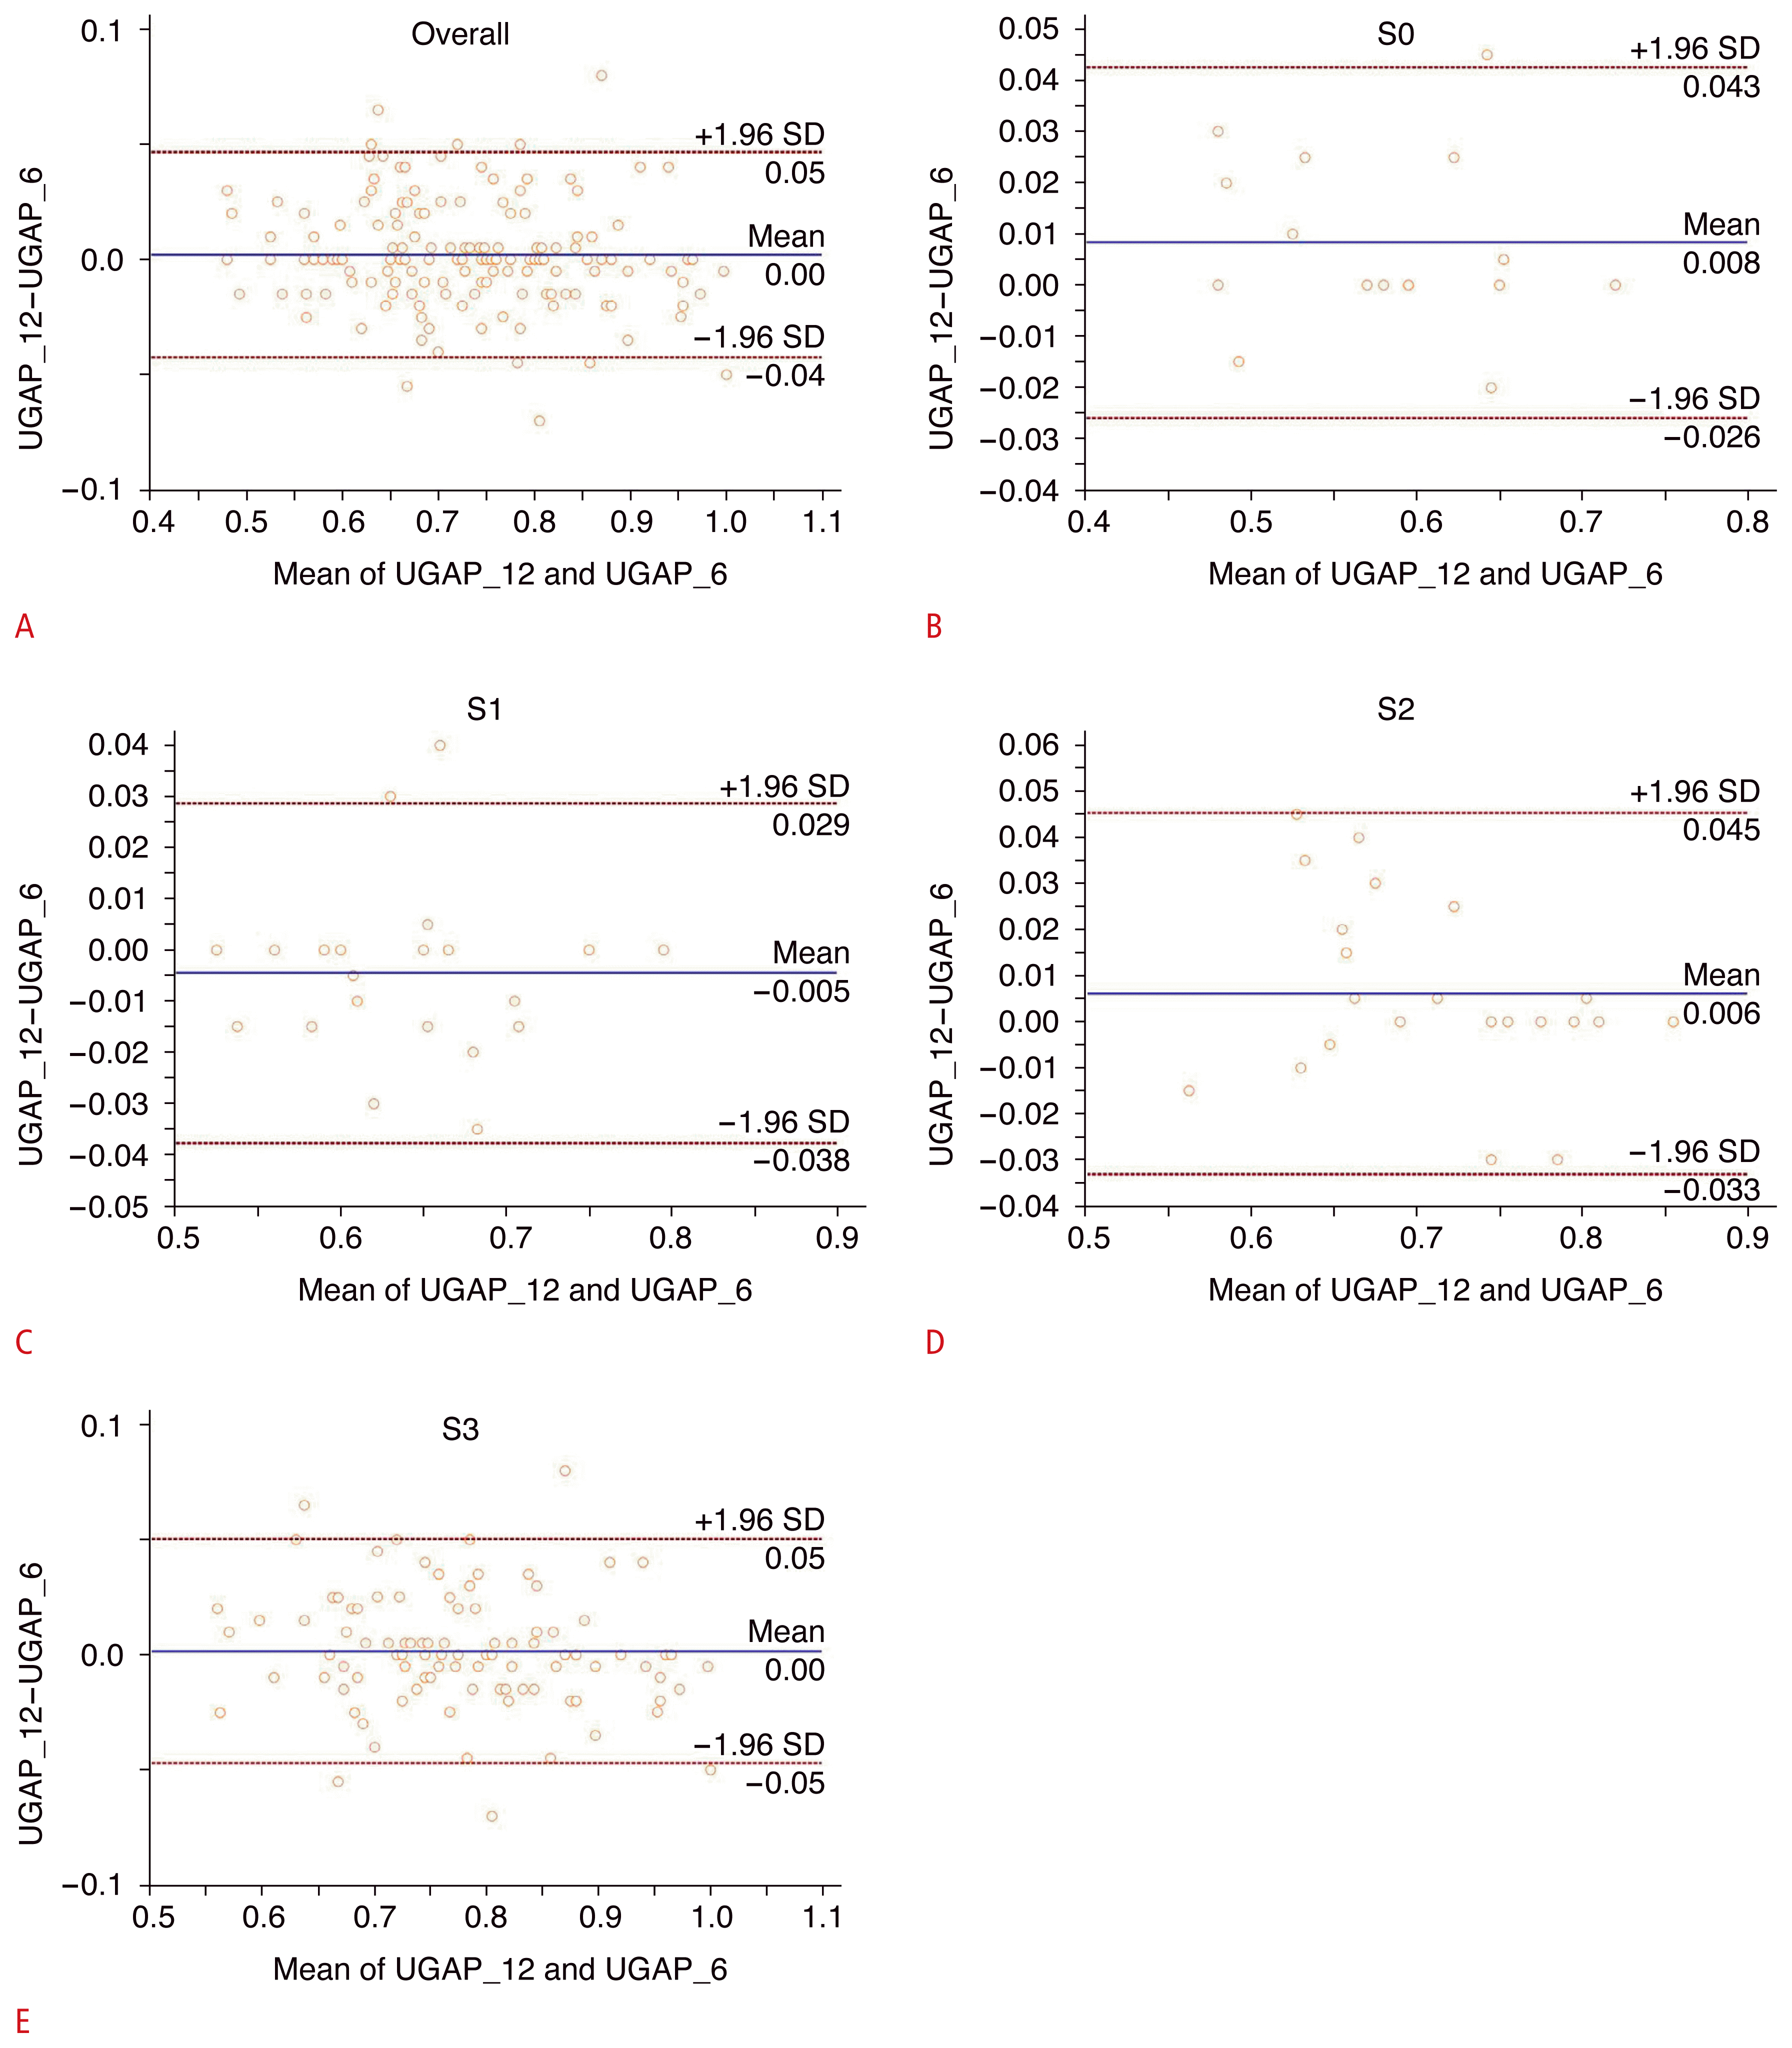
Bland-Altman plot of attenuation coefficient (AC) values between UGAP_6 and UGAP_12 according to each hepatic steatosis grade (A–E).
The solid line indicates the mean difference. The top and bottom dashed lines indicate the upper and lower margins of the 95% limits of agreement, respectively. SD, standard deviation; UGAP, ultrasound-guided attenuation parameter; UGAP_6, 6-repeated measurements obtaining 6 attenuation coefficients using UGAP; UGAP_12, 12-repeated measurements obtaining 12 attenuation coefficients using UGAP.
The AC obtained using UGAP_12 correlated well with CAP (r=0.685, P<0.001). Moreover, the AC obtained using UGAP_6 correlated well with CAP (r=0.680, P<0.001) (Table 3). The correlations of ACs obtained using UGAP_3 and UGAP_9 with CAP values are summarized in Supplementary Table 3.
Diagnostic Performance of UGAP for Steatosis Staging
In diagnosing any grade of steatosis (S≥1), moderate to severe steatosis (S≥2), and severe steatosis (S≥3), UGAP_6 and UGAP_12 yielded comparable AUROCs: 0.908 versus 0.897 (P=0.466) (Fig. 6A), 0.883 versus 0.897 (P=0.126) (Fig. 6B), and 0.832 versus 0.834 (P=0.799) (Fig. 6C), respectively. The optimal cutoff values are summarized in Table 4.
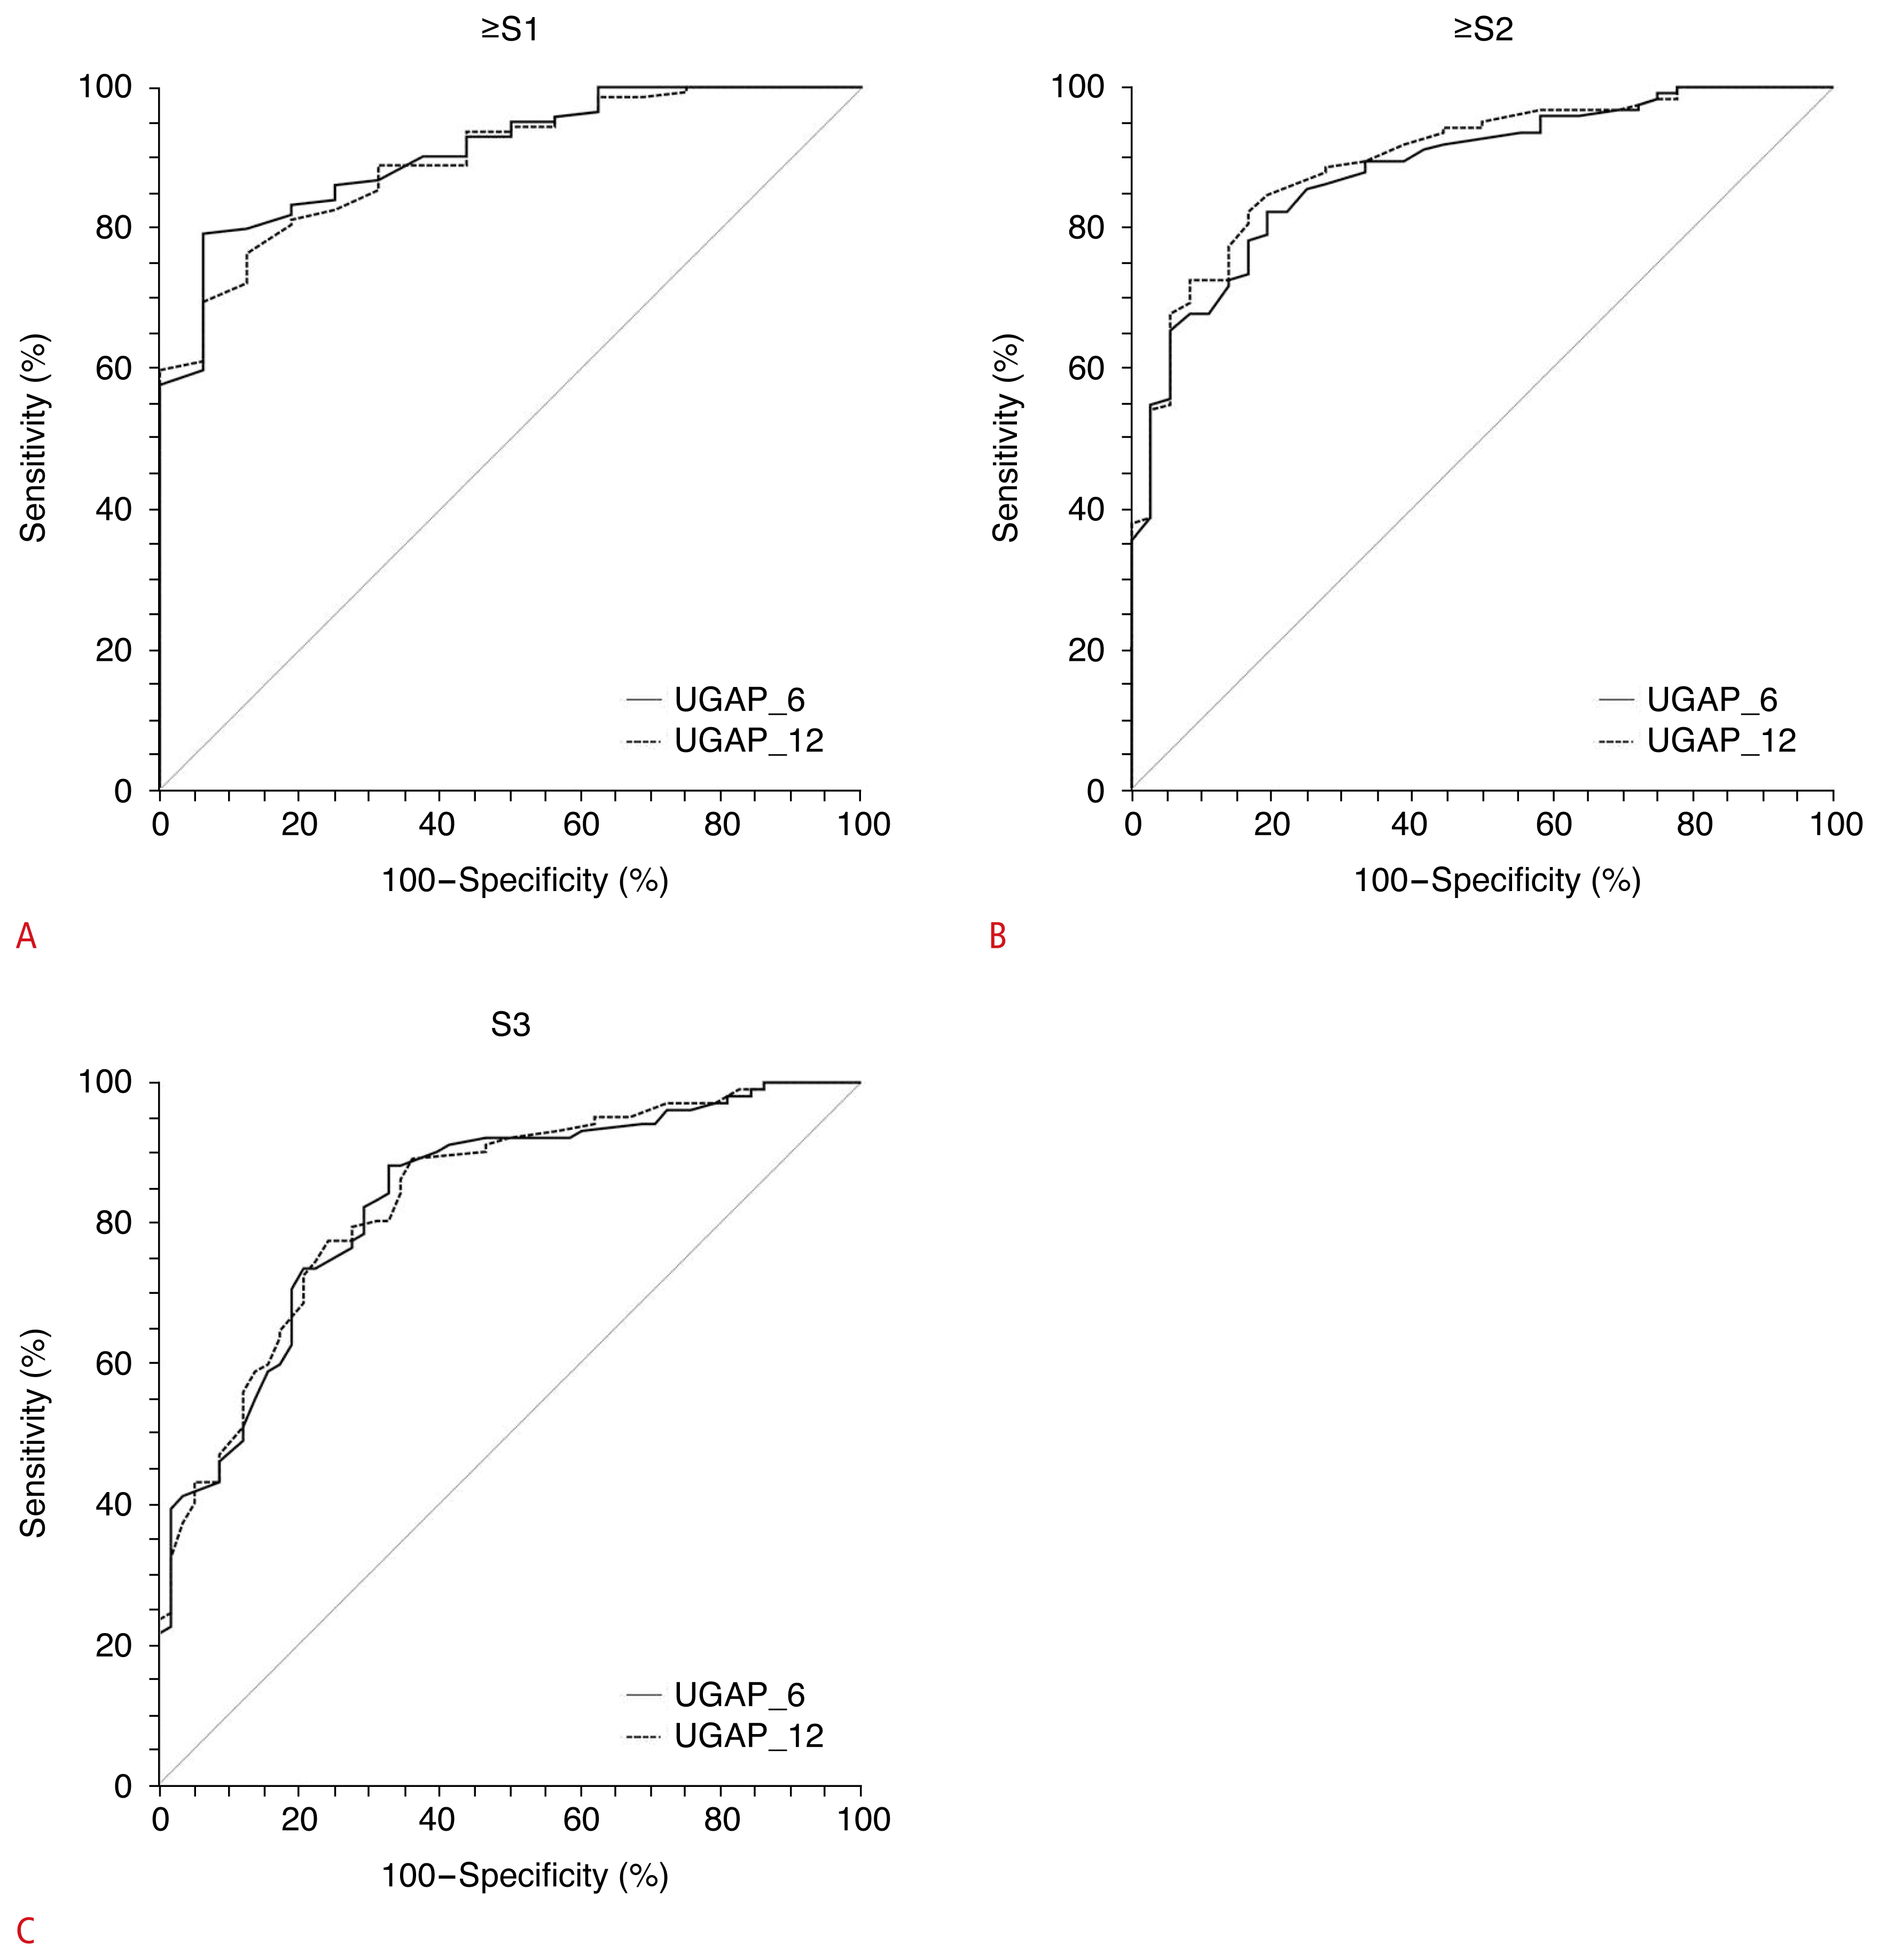
Comparison of receiver operating characteristic curves between UGAP_6 and UGAP_12 for diagnosing ≥S1 (A), ≥S2 (B), and S3 (C).
UGAP, ultrasound-guided attenuation parameter; UGAP_6, 6-repeated measurements obtaining 6 attenuation coefficients using UGAP; UGAP_12, 12-repeated measurements obtaining 12 attenuation coefficients using UGAP.
A comparison of the diagnostic performance of UGAP_3, UGAP_6, UGAP_9, and UGAP-12 is summarized in Supplementary Table 4. In diagnosing any grade of steatosis (S≥1), the AUROC of UGAP_3 was statistically significantly lower than those of UGAP_6 and UGAP_9 (Supplementary Fig. 1). In diagnosing moderate to severe steatosis (S≥2), and severe steatosis (S≥3), the AUROCs showed statistically significant differences among the four repetition protocols.
Discussion
In this study, UGAP had a high diagnostic performance in diagnosing hepatic steatosis staging, irrespective of the number of repetitions (six repetitions [UGAP_6] vs. 12 repetitions [UGAP_12]). There were no significant differences in AUROCs in any steatosis stages between UGAP_6 and UGAP_12. Furthermore, AC and CV values did not significantly differ between UGAP_6 and UGAP_12. Additionally, the AC values obtained using UGAP_6 and UGAP_12 were well correlated with the CAP values.
Despite the widespread validation and high diagnostic performance of CAP [27,28], there are some limitations such as the requirement for an additional TE device and a lack of visualization of B-mode ultrasound images [29]. However, UGAP has the versatility of both B-mode ultrasound imaging and fat quantification [30]. In this study, regarding the diagnostic ability of UGAP, a good correlation was achieved with CAP and high diagnostic performance was noted for accessing hepatic steatosis. These findings are consistent with those of previous studies, which have proven that UGAP is a good tool for quantifying hepatic steatosis, with good accuracy and grading [24,31–33].
However, there is no consensus on exactly how many measurements should be made for UGAP. In previous studies using UGAP, the numbers of measurements varied from 6 to 12 [24,34–36]. In contrast, studies have been conducted to arrive at a consensus on the number of repetitions required for modalities such as SWE [16,37,38]. According to the SRU guidelines, five repetitions are adequate in 2D-SWE with available quality assessment, whereas at least 10 repetitions are recommended in SWE and point SWE without a quality map [16].
According to the results of this study, the UGAP_6 protocol can replace the UGAP_12 protocol; this is expected both to save time and to increase patients’ compliance. To the best of the authors’ knowledge, this is the first study to suggest that six repetitions are sufficient for evaluating hepatic steatosis using UGAP.
In the study, the IQR/median value was significantly lower in UGAP_6 than in UGAP_12. Additionally, the CV in UGAP_6 was lower than that in UGAP_12, but the difference was not statistically significant. This suggests that UGAP_6 had higher repeatability and reproducibility. However, this finding could have been affected by the fact that three ROIs for AC values were obtained from one colored map. Further studies on the adequate number of ROIs in one map would be required to validate this point.
The IQR/median has been used as a reliability criterion for quantitative ultrasound methods such as TE, SWE, and UGAP. However, using only three measurements would not be suitable for applying conventional reliability criteria such as the IQR/median value, although UGAP_3 was also compared with UGAP_12 and the AC values were not found to be significantly different between them. Furthermore, the diagnostic performance of UGAP_3 was inferior to that of UGAP_6 in evaluating any grade of steatosis (≥S1). UGAP_6 would be appropriate because of its lower IQR/median, reduced time, and higher diagnostic performance. In particular, UGAP_6 would be better if patients have significant fibrosis or an SCD <25 mm owing to its lower IQR/median.
However, the proportion of IQR/median values <15% was significantly different between UGAP_6 and UGAP_12. Further studies are required to investigate the sufficiency of IQR/median values <30% for reliable UGAP measurements. Regarding CAP, Wong et al. [23] considered an IQR of <40 dB/m as a quality determination criterion.
The present study had some limitations. First, there was no reference other than CAP, as we did not compare UGAP with MRI-PDFF or liver biopsy. Second, the study was conducted at a single center and investigated only a small population. Furthermore, the distribution of hepatic steatosis was highly skewed. Many participants had severe steatosis, which may have caused spectrum bias in the assessment of diagnostic performance. However, we focused on the feasibility of six measurements rather than the cutoff value for hepatic steatosis staging. Large-scale multicenter studies using histopathology as a reference standard are warranted. Third, three AC values were obtained on the same quality map. This might have led to a significant correlation among the AC values. However, the use of multiple ROIs in an elastographic map was allowed using 2D-SWE, as supported by previous studies [39,40]. Further studies comparing multiple ROIs and one ROI in the quality map using UGAP are warranted. Fourth, although there exist several ultrasound attenuation platforms, which should not be used interchangeably [36], only one platform (UGAP) was used to prove the hypothesis that a small number of repetitions would be enough to measure hepatic steatosis. Thus, further studies comparing many repetition protocols using several ultrasound attenuation platforms are needed. Finally, UGAP measurements were made by only one radiologist, although previous studies have demonstrated high intraobserver and interobserver reproducibility [35,36]. Additionally, the second set of six measurements might have been influenced by the first set of six measurements because all measurements were continuously performed by the same observer; however, this study focused on the preceding six measurements, which were not affected by the following six measurements.
In conclusion, UGAP had a high diagnostic performance in diagnosing hepatic steatosis, irrespective of the number of repetitions (6 vs. 12), with the maintenance of reliability. Therefore, six UGAP measurements seem sufficient for evaluating hepatic steatosis using UGAP.
Acknowledgments
The authors would like to thank Enago (www.enago.co.kr) for English language review.
Notes
Author Contributions
Conceptualization: Seo DM, Lee SM. Data acquisition: Lee SM. Data analysis or interpretation: Seo DM, Lee SM, Park JW, Kim MJ, Ha HI, Park SY, Lee K. Drafting of the manuscript: Seo DM, Lee SM. Critical revision of the manuscript: Park JW, Kim MJ, Ha HI, Park SY, Lee K. Approval of the final version of the manuscript: all authors.
No potential conflict of interest relevant to this article was reported.
Supplementary Material
Supplementary Table 1.
Comparison of the AC, IQR/median, and CV among UGAP_3, UGAP_6, UGAP_9, and UGAP_12 according to each hepatic steatosis stage (https://doi.org/10.14366/usg.22122).
Supplementary Table 2.
Comparison of the AC, IQR/median, and CV between UGAP_6 and UGAP_12 according to hepatic fibrosis, BMI, and SCD (https://doi.org/10.14366/usg.22122).
Supplementary Table 3.
Pearson correlation coefficients (r) between UGAP and CAP (https://doi.org/10.14366/usg.22122).
Supplementary Table 4.
Diagnostic performance of UGAP for hepatic steatosis staging (https://doi.org/10.14366/usg.22122).
Supplementary Fig. 1.
Comparison of receiver operating characteristic curves among UGAP_3, UGAP_6, UGAP_9, and UGAP_12 for diagnosing ≥S1 (A), ≥S2 (B), and S3 (C) (https://doi.org/10.14366/usg.22122).


