Impact of preoperative ultrasonography for predicting the prognosis of deceased donor kidney transplantation
Article information

Abstract
Purpose
This study evaluated the role of donor kidney ultrasonography (US) for predicting functional kidney volume and identifying ideal kidney grafts in deceased donor kidney transplantation.
Methods
In total, 272 patients who underwent deceased donor kidney transplantation from 2000 to 2020 at Samsung Medical Center were enrolled. Donor kidney information (i.e., right or left) was provided to the radiologist who performed US image re-analysis. To binarize each kidney’s ultrasound parameters, an optimal cutoff value for estimated glomerular filtration rate (eGFR) of less than 30 mL/min/1.73 m2 within 1 year after kidney transplantation was selected using the receiver operating characteristic curve with a specificity >60%. Cox regression analysis was performed for an eGFR less than 30 mL/min/1.73 m2 within 1 year after kidney transplantation and graft failure within 2 years after kidney transplantation.
Results
The product of renal length and cortical thickness was a statistically significant predictor of graft function. The odds ratios of an eGFR less than 30 mL/min/1.73 m2 within a year after kidney transplantation and the hazard ratio of graft failure within 2 years after kidney transplantation were 5.91 (P=0.003) and 5.76 (P=0.022), respectively.
Conclusion
Preoperative US of the donor kidney can be used to evaluate donor kidney function and can predict short-term graft survival. An imaging modality such as US should be included in the donor selection criteria as an additional recommendation. However, the purpose of this study was not to narrow the expanded criteria but to avoid catastrophic consequences by identifying ideal donor kidneys using preoperative US.
Key points
Preoperative ultrasonography of the donor kidney is valuable for evaluating kidney function and predicting short-term graft survival. Catastrophic consequences may be avoided by using preoperative ultrasonography to identify ideal donor kidneys.
Introduction
Kidney transplantation (KT) is the best treatment for end-stage renal disease (ESRD) [1]. However, the number of recipients in need far exceeds the number of available donor kidneys. It is essential to develop more marginal criteria for selecting donor organs, and several studies have reported that KT using expanded criteria donor (ECD) kidneys improves patient survival compared with keeping those patients on the waiting list undergoing maintenance dialysis [2,3]. Evidence on ECD has even been used to qualify kidneys obtained from extremely marginal donors for dual KT [4,5].
Until recently, the most important factor determining donor kidney quality was the age of the donor, since nephron mass decreases with age [6,7]. A method to predict nephron mass could reduce the risk of an unacceptable kidney graft, allowing kidneys from elderly donors to be used more safely. In Europe, using criteria for elderly donor kidneys evaluated via preoperative biopsy, kidneys are classified into single and dual KT or are discarded [8,9]. However, it is difficult to implement these criteria at all centers due to the need for on-call pathologists [10] and varying degrees of reproducibility depending on individual variation between pathologists [11].
Therefore, non-invasive imaging modalities could be particularly useful for evaluating the status of donor kidneys, and several studies have suggested that cortical thickness and renal length, representing functional kidney volume, can be used as indicators of kidney function [12–14]. In a recent study, renal cortical volume on computed tomography reflected nephron mass and predicted the recipient’s graft function in living donor KT, although this was not necessarily correlated with graft survival [15,16]. Another study showed that ultrasonography (US) findings, especially cortical thickness, were better for evaluating renal function than laboratory findings such as the estimated glomerular filtration rate (eGFR) [17]. Furthermore, US was more useful than contrast-enhanced computed tomography for evaluating the state of organs in deceased donors, since most deceased donors had sustained an acute kidney injury (AKI) [18] and were not transferred from the intensive care unit to computed tomography for an extended length of time. For that reason, US of the functional volume of the kidney could be a useful tool for evaluating donor kidney quality.
Therefore, in this study, cortical thickness or length of kidney were calculated via US and its usefulness was compared alone or in combination with other donor factors for predicting graft function and graft survival. The hypothesis was that cortical thickness would be useful for identifying acceptable kidney grafts.
Materials and Methods
Compliance with Ethical Standards
This study was approved by the Institutional Review Board of Samsung Medical Center (IRB No. 2020-04-176) and informed consent was waived since this was a retrospective study.
Study Design and Patient Criteria
A retrospective single-center study was performed with data collected from Samsung Medical Center. The patient selection strategy is summarized in Fig. 1. The records of 410 patients who underwent deceased donor KT from the year 2000 to 2020 were reviewed. US evaluation was performed preoperatively to confirm donor kidney status. The donors were recruited only at Samsung Medical Center. The following exclusion criteria were applied: multiorgan transplantation (n=17), dual KT (n=8), En bloc surgery (n=8), donation after cardiac death (n=24), repeated KT (n=41), absence of induction therapy (e.g., daclizumab, anti-thymocyte globulin, and alemtuzumab) (n=6), pediatric KT (n=15), and hemodialysis due to graft failure within 1 year but with some remaining some kidney function (n=4). Patients whose US data could not be confirmed (n=17) were also excluded. A total of 272 patients were enrolled in the study.

Patient selection.
Among all patients who underwent deceased donor kidney transplantation (n=410) at Samsung Medical Center from 2000 to 2020, 272 patients were enrolled in the study after excluding 118 patients who met the exclusion criteria and 20 patients without ultrasonography data. There are intersections in some criteria, so the sum of the number of patients belonging to each criteria is not consistent with the total number of patients.
Imaging Analysis of the Donor Kidney
An experienced genitourinary radiologist with more than 7 years of experience in kidney US analyzed stored preoperative kidney US images from the study period. One of three US scanners (Acuson Sequoia 512, Siemens Healthcare, Mountain View, CA, USA; HDI 5000, Advanced Technology Laboratories, Bothell, CA, USA; or IU22, Philips Healthcare, Bothell, WA, USA) with a 3–5-MHz convex-array transducer was used to evaluate potential donor kidneys. Donor kidney information (i.e., right or left) was provided to the radiologist who performed the US image re-analysis, and donor kidney function analysis using US was performed before surgery. However, the radiologist was blinded to other clinical or pathologic data regarding the donor and the donated kidney (e.g., underlying disease, renal function before or after transplantation, and biopsy results after transplantation). Renal size, cortical thickness, parenchymal thickness, and cortical echogenicity on US were analyzed. Renal size was defined as the longest diameter on the longitudinal axis of the kidney. The cortical thickness or parenchymal thickness was measured in the upper, middle, and lower levels of the kidney and averaged to calculate the representative cortical thickness or parenchymal thickness for each patient (Fig. 2). The degree of cortical echogenicity was scored using a 3-point scale (1, normal; 2, mildly hyperechoic; 3, definitely hyperechoic).
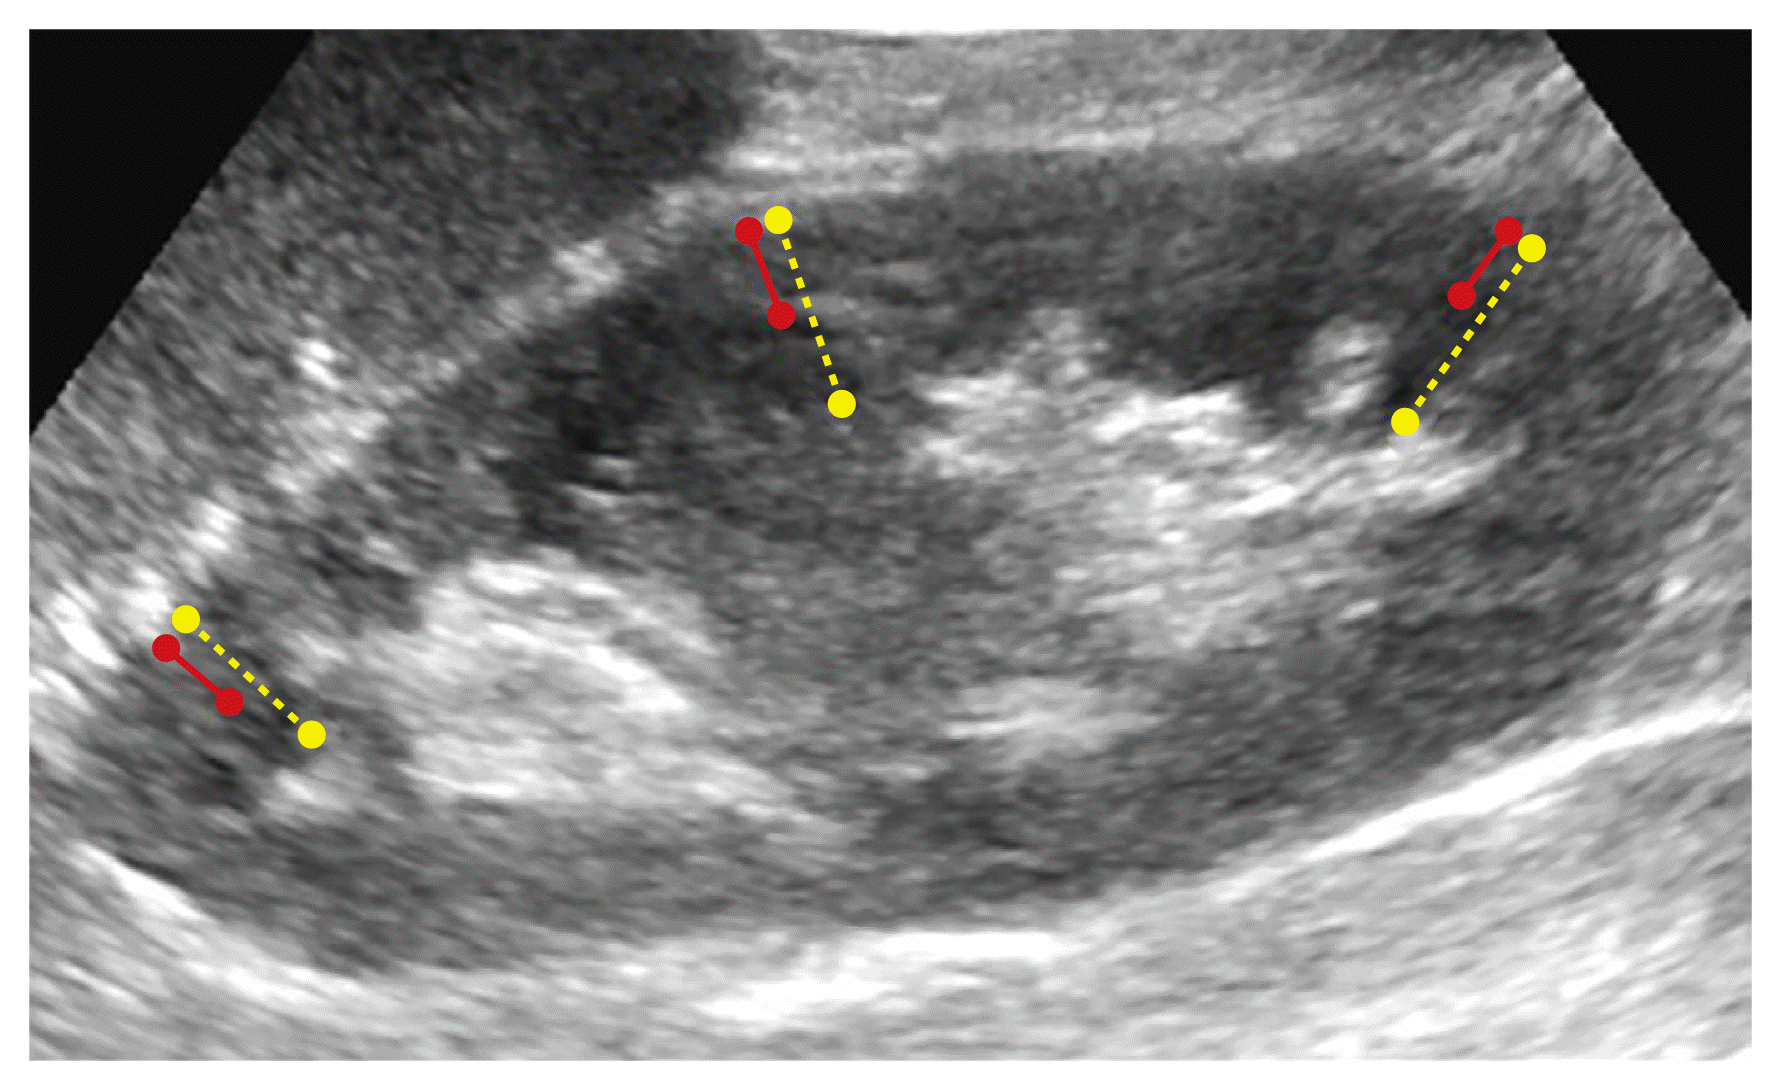
Ultrasound parameter measurement of donor kidneys.
An example shows the method of measuring cortical or parenchymal thickness. Cortical thickness was measured as the length from the lateral border of the hypoechoic renal medulla to the renal surface (solid red line), while parenchymal thickness was the length of both the renal cortex and medulla (dotted yellow line). Each thickness was measured at the upper, middle, and lower levels of the kidney, with values averaged to calculate the representative cortical or parenchymal thickness for each patient.
Postoperative Management and Immunosuppressive Regimens
Doppler US of transplanted kidneys was routinely performed on postoperative days 1, 3, and 7 to evaluate renal vasculature or hydronephrosis, as well as a diethylenetriamine pentaacetic acid renal scan on postoperative days 5 and 7 to determine whether ureteral strictures or leakage was present. Cytomegalovirus antigenemia, parvovirus B19, and polyomavirus type BK DNA status were assessed based on laboratory findings on postoperative day 7. Human leukocyte antigen (HLA) Ab single identification (classes I & II) was analyzed during the preoperative period and again at weeks 1 and 4, 1 year, and annually after transplantation. Rabbit anti-thymocyte globulin (rATG) was used in ECDs or intermediate-to-high immunologic risk cases for induction therapy. Intermediate risk was based on the presence of donor-specific antibodies (DSA) and DSA median fluorescence intensity <2,500, whereas high risk was based on one or more of the following criteria: positive HLA crossmatch, positive HLA flow cytometry crossmatch, and positive DSA and DSA fluorescence intensity ≥2,500. Basiliximab was used for induction therapy in the remaining patients. Tacrolimus (FK) and mycophenolate mofetil (MMF) were used as maintenance immunosuppressants starting from the afternoon of postoperative day 1, and steroids were tapered according to schedule [19–21].
Data Collection
Demographic data including age, sex, underlying disease, body mass index (BMI), diabetes mellitus (DM), and hypertension (HTN) of both donors and recipients were collected. For donors, standard criteria donor (SCD) or ECD status, serum creatinine, continuous renal replacement therapy, kidney donor profile index (KDPI), kidney donor risk index (KDRI), and US findings were reviewed. ECD status was defined according to the United Network for Organ Sharing criteria. The image analysis of donor kidneys via US is described above. Renal length, cortical thickness, and parenchymal thickness were evaluated as risk factors. The eGFR was calculated using the Chronic Kidney Disease Epidemiology Collaboration equation.
Statistical Analysis
SPSS version 27 (IBM Corp., Armonk, NY, USA) was used for statistical analysis. Continuous variables were assessed for the normality of their data distribution and compared via the independent-sample t-test. The values are expressed as the median and quartiles. Categorical variables were compared for significance using the chi-square test and presented as numbers and percentages. To binarize each kidney US characteristic, an optimal cutoff value for eGFR less than 30 mL/min/1.73 m2 within 1 year after KT was selected using the value of the minimum distance from the left-upper corner of the unit square of the receiver operating characteristic curve with a specificity above 60%. The endpoint of this study was graft failure within 2 years after KT, which was defined as a situation in which continuous hemodialysis was necessary after KT. Cox regression analysis was used to evaluate the odds ratios of each mode. The threshold for statistical significance in all comparisons was P<0.05.
Results
Patient Characteristics
The median age of KT recipients was 48 years (95% confidence interval [CI], 40 to 55 years) with a preponderance of men (n=156, 57.4%). The cause of ESRD was unknown in approximately one-third of cases (n=106, 39.0%), while glomerulonephritis (n=40, 14.7%) was the most common known cause of ESRD, followed by DM nephropathy (n=38, 14.0%), hypertensive nephropathy (n=36, 13.2%), and autosomal dominant polycystic kidney disease (n=17, 6.3%). HTN was the underlying disease in 81.6% (n=222) of patients, and DM was detected in 16.2% (n=44) of patients. ECDs constituted 29.4% (n=80) of the total patient population. The median donor age was 47 years (95% CI, 37 to 56), and males were dominant (n=180, 66.2%). Median donor serum creatinine level was 1.29 mg/dL (95% CI, 0.89 to 2.41). Among donors, 73.2% had a history of AKI (n=199), defined as the creatinine level rising by 0.3 mg/dL within 48 hours or an increase of 50%–99% from baseline within 7 days and urine output less than 0.5 mL/kg/h for more than 6 hours. Furthermore, 9.9% (n=27) of donors underwent continuous renal replacement therapy. Among donors, DM was observed in 11.9% (n=32) and HTN in 28.6% (n=77) as underlying diseases. The median values of the KDRI and KDPI were 1.10 (95% CI, 0.91 to 1.39) and 60 (95% CI, 40.0 to 81.5), respectively. The donor kidney weight after bench work was 205.0 g (95% CI, 175.5 to 250.0). The average total operation time was 250 minutes (95% CI, 215 to 300), and the cold ischemic time and warm ischemic times were 224 minutes (95% CI, 183 to 279) and 35 minutes (95% CI, 28 to 47), respectively. Basiliximab was used as an induction agent in 45.2% (n=123) of recipients, and rATG was used in the other 54.8% (n=149). In the authors’ department, basiliximab was used for SCDs and rATG for ECDs and ABO-incompatible cases. In most cases, a combination of FK, MMF, and methylprednisolone was used for maintenance therapy (n=239, 87.9%). These values are listed in Table 1. A correlation analysis between KDRI and KDPI, age, and US parameters showed negligible correlations (Supplementary Fig. 1).
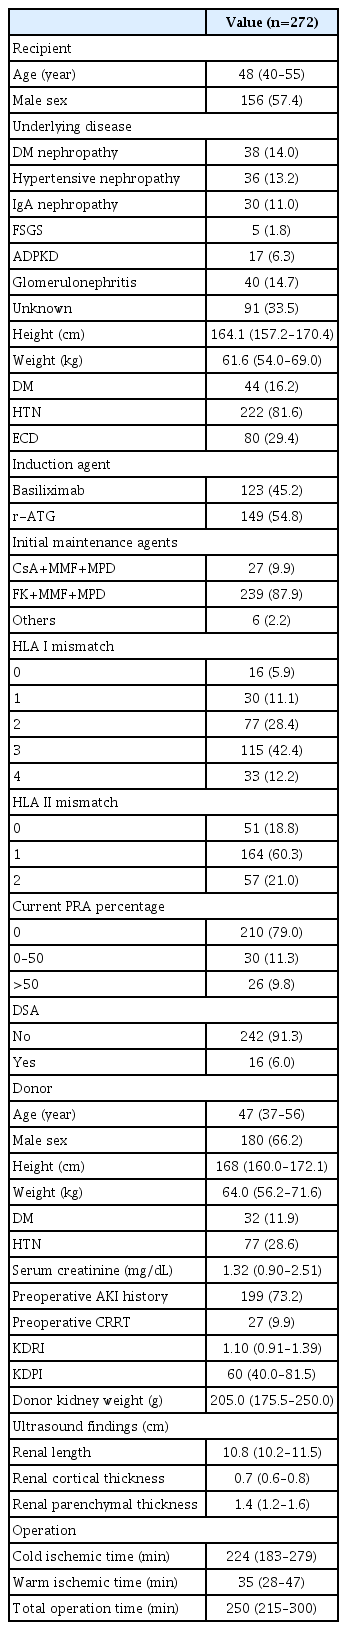
Characteristics of recipients and donors
Area under the Receiver Operating Characteristic Curve and Cutoff Values of Each Ultrasound Finding
To binarize each kidney US characteristic, an optimal cutoff value for eGFR less than 30 within 1 year after KT was selected using the Youden index among values with a specificity above 60%. The cutoff values of renal length, cortical thickness, parenchymal thickness, and the product of renal length and cortical thickness were 10.5 cm, 0.6 cm, 1.3 cm, and 6.6, respectively, and the areas under the receiver operating characteristic curve of each value were 0.605 (95% CI, 0.440 to 0.771), 0.690 (95% CI, 0.555 to 0.825), 0.692 (95% CI, 0.549 to 0.834), and 0.694 (95% CI, 0.526 to 0.861), respectively (Table 2, Fig. 3). Each US parameter was binarized based on the given cutoff value and included in the final model.

Area under the receiver operating characteristic curve and cutoff values of renal length, cortical thickness, parenchymal thickness, and the product of renal length and cortical thickness
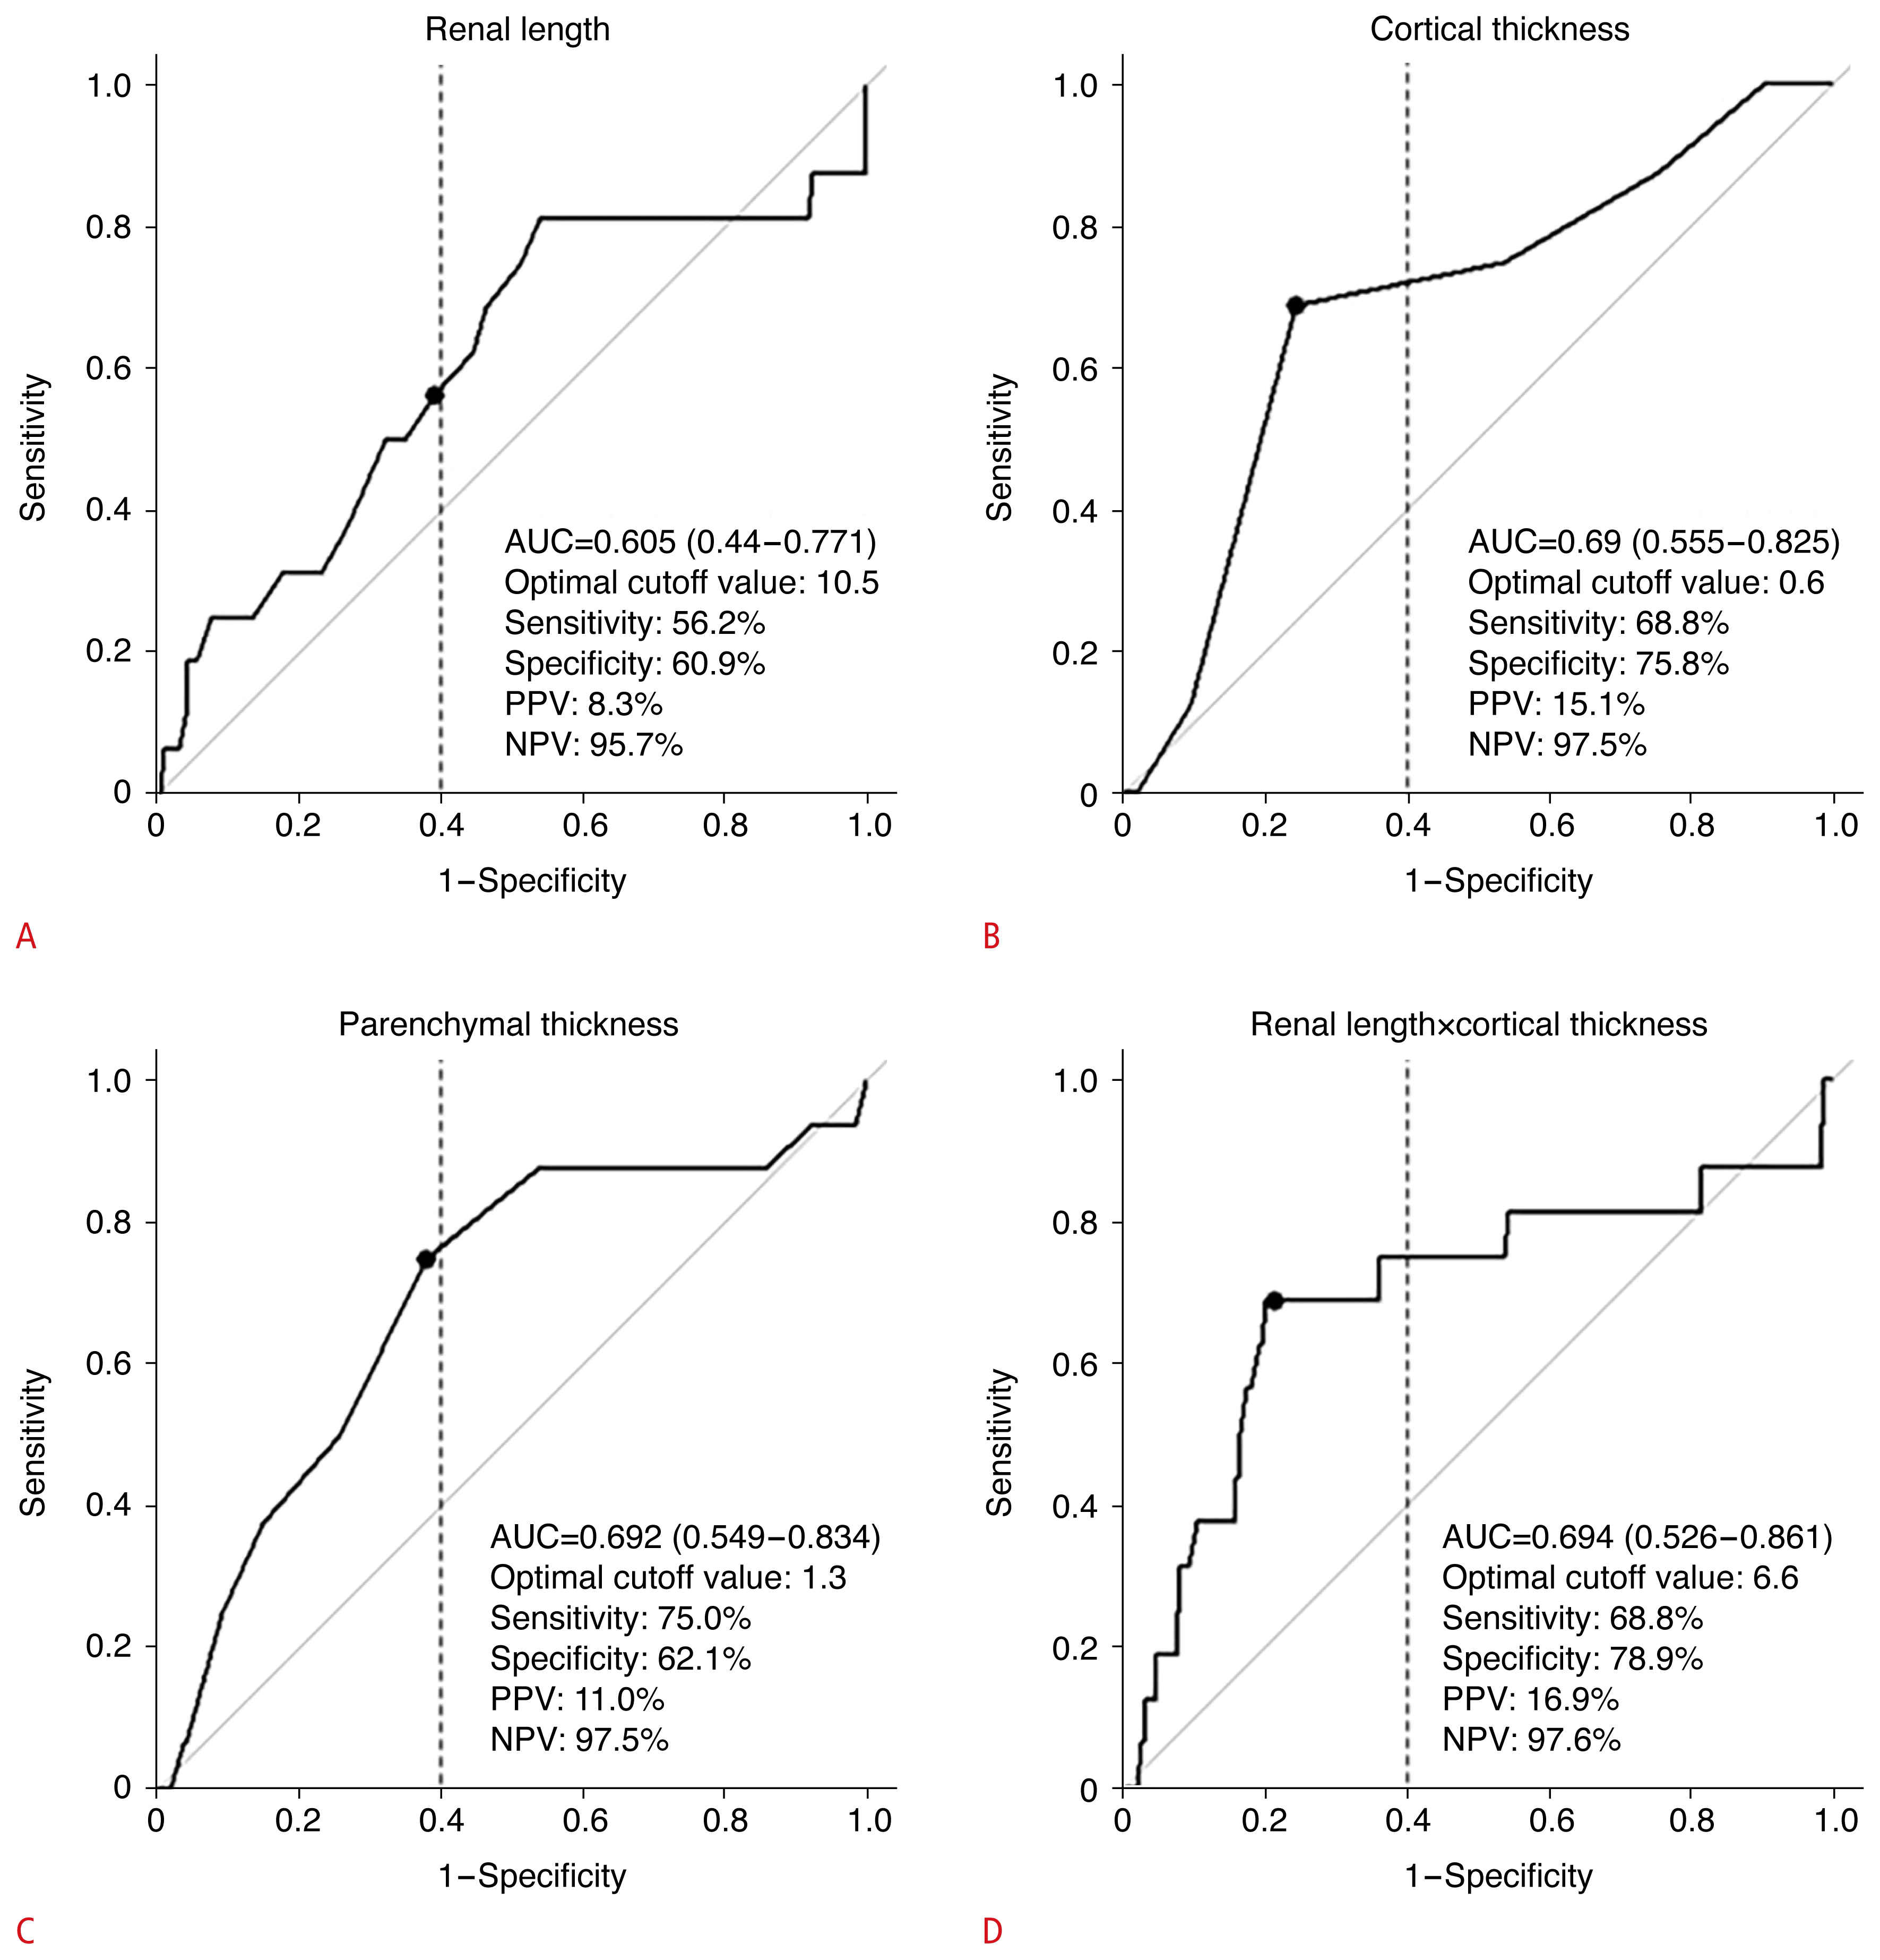
Cutoff values of kidney ultrasound parameters (renal length [A], cortical thickness [B], parenchymal thickness [C], and renal length×cortical thickness [D]) according to the receiver operating characteristic curve.
AUC, area under the curve; PPV, positive predictive value; NPV, negative predictive value.
eGFR Less Than 30 mL/min/1.73 m2 within 1 Year after KT
The results of the univariable analysis of demographic variables and US parameters and the multivariable analysis of US parameters after adjusting for demographic variables with an eGFR less than 30 mL/min/1.73 m2 within 1 year after KT are presented in Table 3. Model 1 is a univariable analysis of US parameters. Models 2 and 3 are multivariable analyses of each US parameter after adjusting for KDPI and ECD, respectively. Model 4 is a multivariable analysis of each US parameter after adjusting for demographic variables (age, sex, and recipient BMI/donor BMI). Model 5 is a multivariable analysis of each US parameter after adjusting for the demographic variables of model 4 and KDPI. All US parameters except renal length were risk factors for eGFR less than 30 mL/min/1.73 m2 within 1 year after KT. The odds ratio in model 5 for cortical thickness, parenchymal thickness, and the product of renal length and cortical thickness were 5.24 (95% CI, 1.64 to 16.77; P=0.005), 3.42 (95% CI, 1.02 to 11.48; P=0.047), and 5.91 (95% CI, 1.85 to 18.91; P=0.003), respectively.
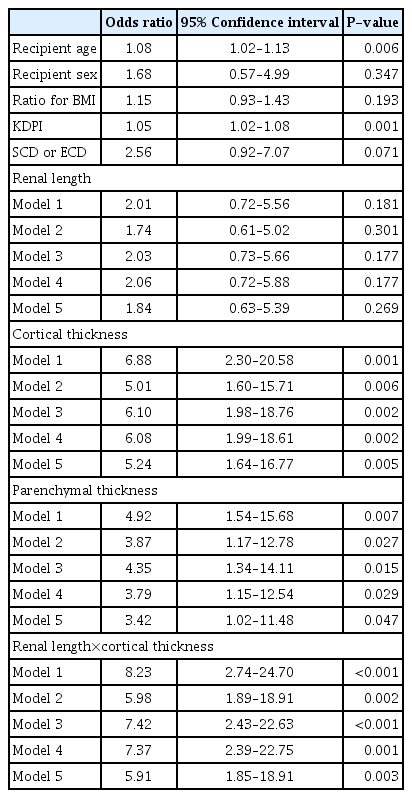
eGFR less than 30 mL/min/1.73 m2 within 1 year after kidney transplantation
Graft Failure within 2 Years after KT
US parameters were evaluated as predictors of graft failure within 2 years after KT, as shown in Table 4. The modeling methods were the same as those used to assess an eGFR less than 30 mL/min/1.73 m2 within 1 year after KT.

Graft failure within 2 years after kidney transplantation
Among the US parameters, a lower product of renal length and cortical thickness was a risk factor for graft failure within 2 years after KT, with a hazard ratio of 5.76 (95% CI, 1.29 to 25.69; P=0.022) in model 5 (In addition, the product of renal length and cortical thickness was a statistically significant predictor in models 1 to 4 [P=0.003, P=0.023, P=0.007 and P=0.004, respectively]). Overall survival differences were analyzed using Kaplan-Meier curves binarized by US parameters with statistically significant variables in a univariable Cox proportional hazard model of patient death. A significant difference in survival rate was found when the cortical thickness was less than 0.6 cm and the product of renal length and cortical thickness was under 6.6 (P=0.008 and P=0.004, respectively) (Fig. 4).
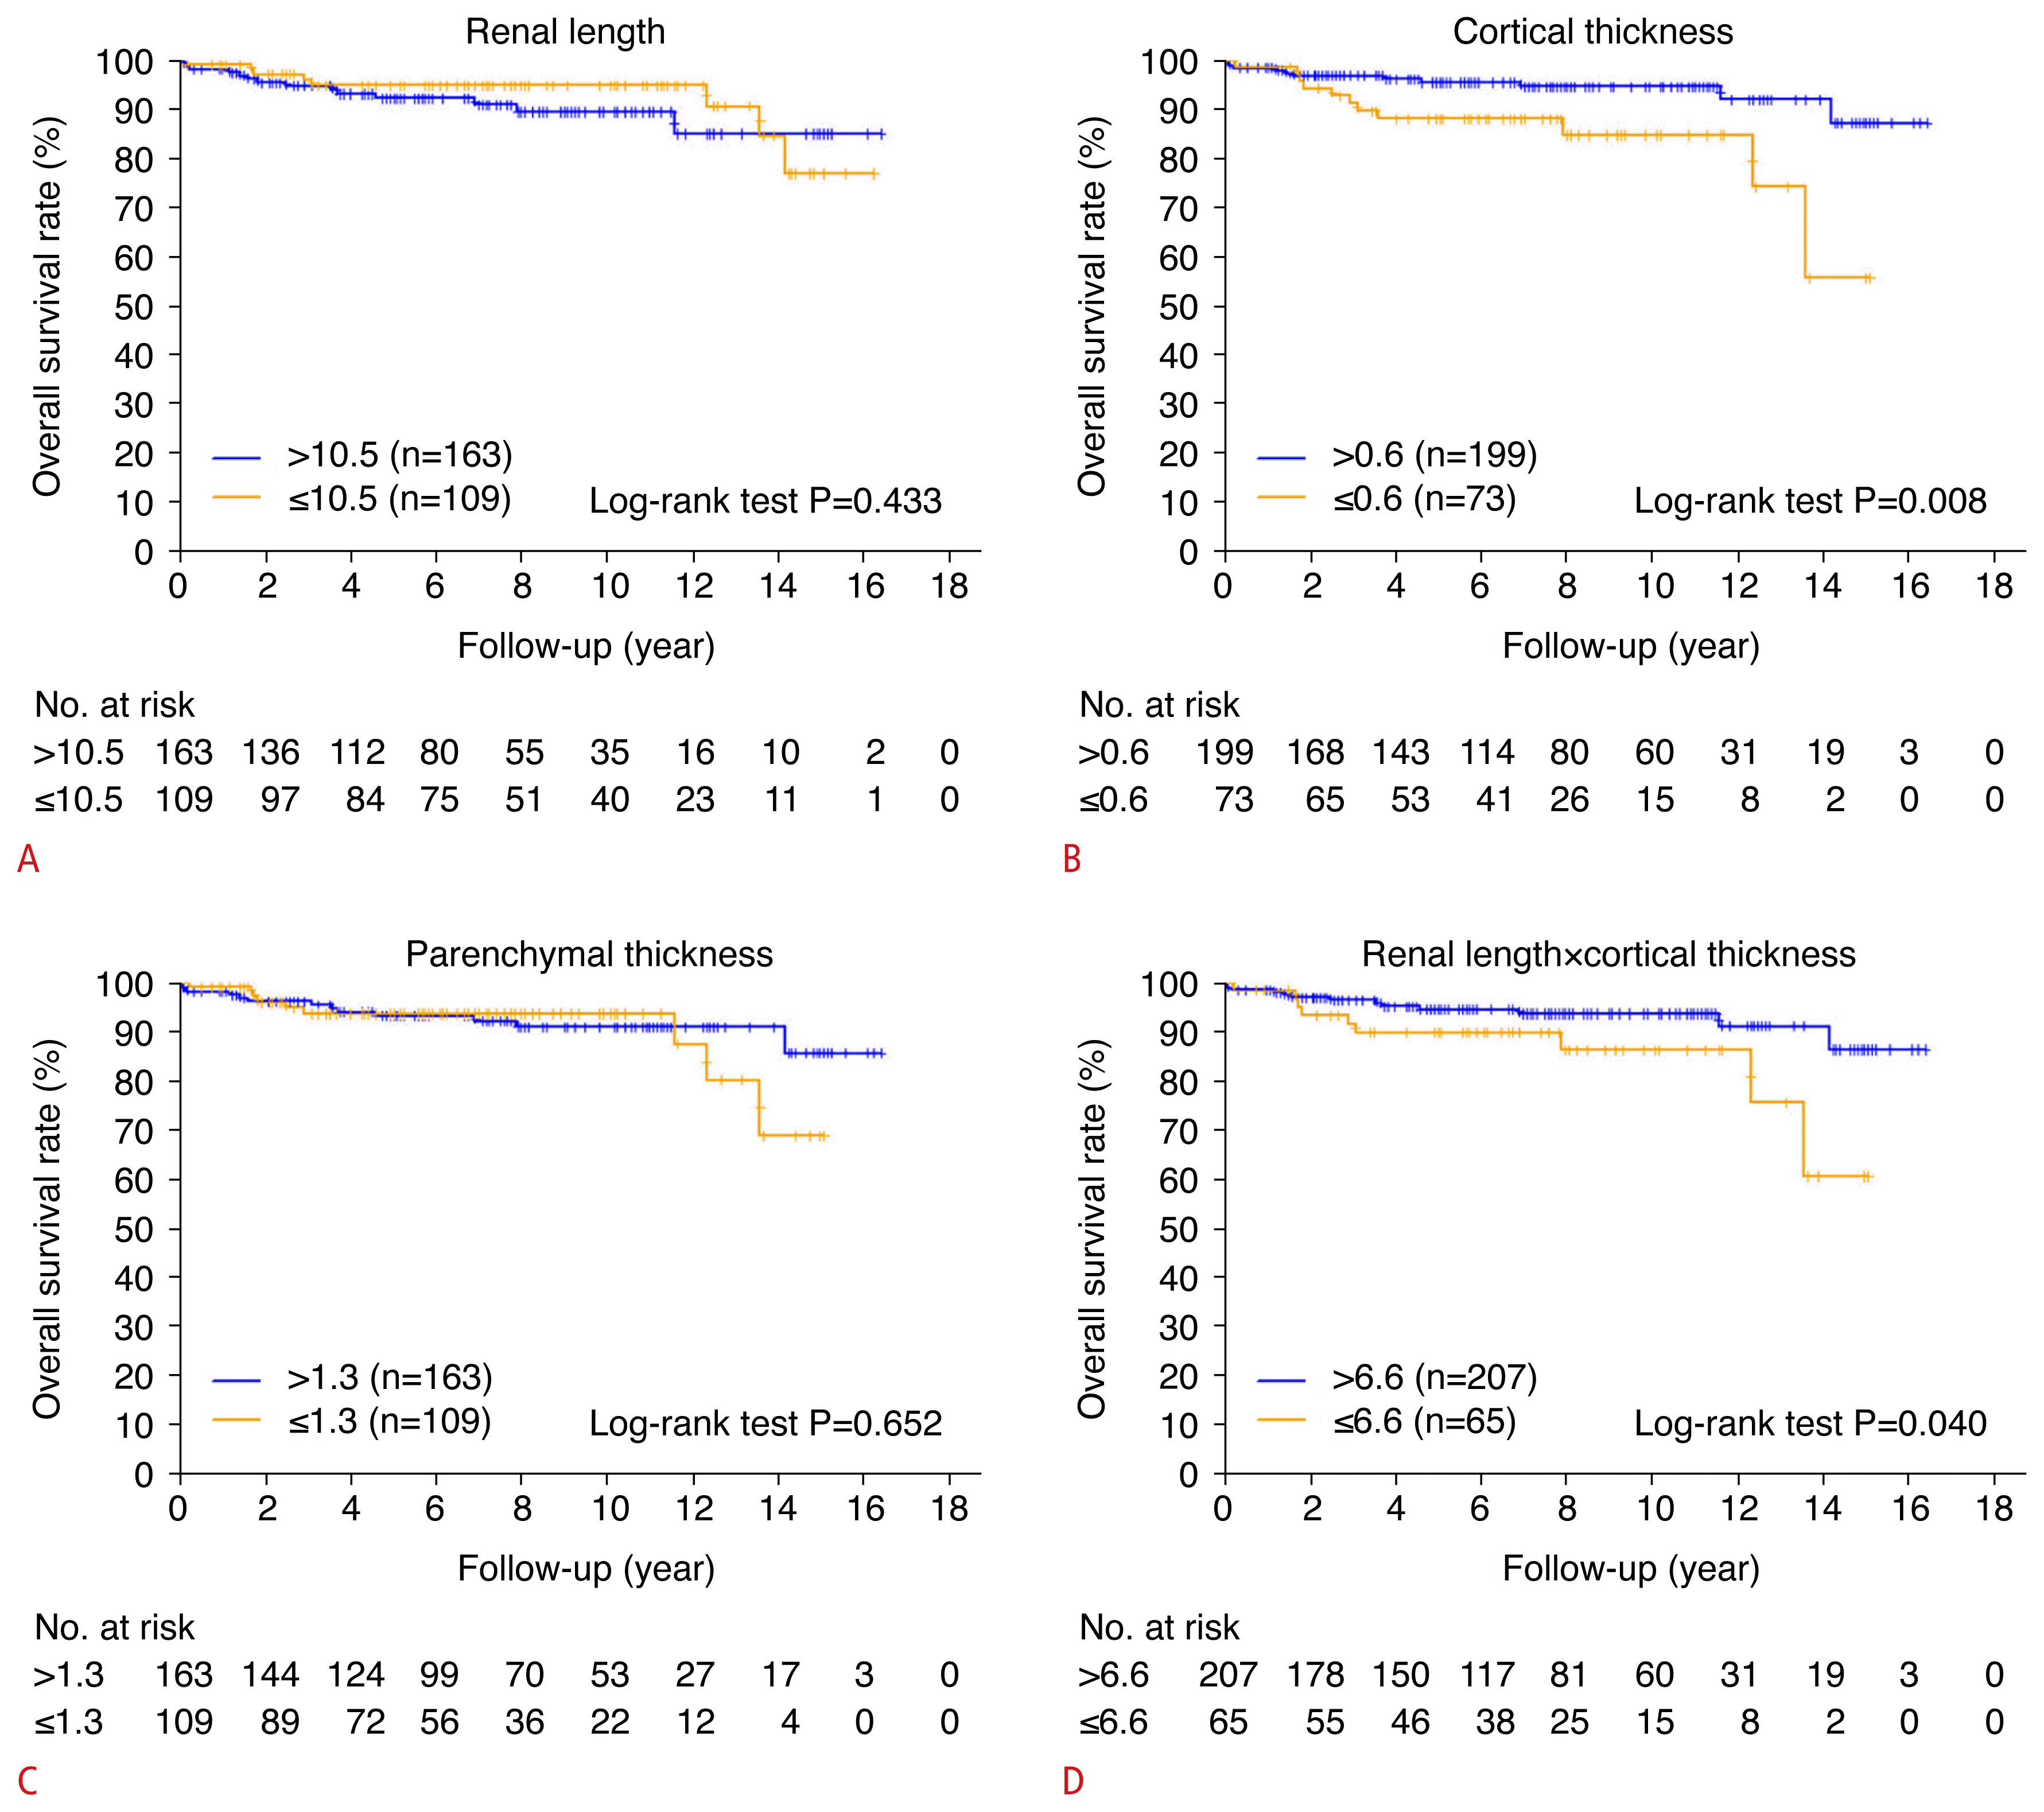
Kaplan-Meier curve for overall survival according to ultrasound parameters (renal length [A], cortical thickness [B], parenchymal thickness [C], and renal length×cortical thickness [D]).
Discussion
Despite their many limitations, serum creatinine and its derivative equations for eGFR have been used as the primary index of chronic kidney disease prevalence and severity [22]. Although the measured glomerular filtration rate (mGFR) is the standard method for evaluating kidney function, it is difficult to measure repeatedly in actual clinical practice; therefore, instead of mGFR, eGFR is primarily used [23]. According to Choi et al. [24], graft survival tends to vary depending on the eGFR measured 1 year after transplantation. In particular, an eGFR less than 30 mL/min/1.73 m2 was a significant risk factor for short-term graft failure [24], and compared to stage 2 chronic kidney disease (CKD), the adjusted Cox proportional hazard ratios for long-term graft failure were significantly higher in stage 3 or higher CKD [23,25]. In addition, some studies reported that long-term graft survival could also be predicted by eGFR measured 1 year after KT, and similar results were obtained in a 10-year follow-up study of a large cohort of KT patients [26,27]. Based on this evidence, graft dysfunction was defined when the eGFR fell below 30 mL/min/1.73 m2, and the cutoff values for US parameters were set according to the eGFR value of 30 mL/min/1.73 m2.
Several studies have analyzed survival outcomes and performed risk-benefit assessments of deceased donor kidney transplantation (DDKT) by comparing patients on waiting lists undergoing dialysis to patients who underwent KT using a marginal donor. The findings suggest that the relative risk of death in the early stage of transplantation was higher in marginal donor recipients than in patients on the waiting list because of the risk of surgery itself; however, after the end of the surgical risk period, even marginal donor KT was associated with significant survival benefit. Ojo et al. [28] reported an average survival benefit of 5 years for marginal KT and 13 years for ideal DDKT compared with patients on the waiting list, as well as a significant decrease in the relative risk of death after nearly 530 days in the ECD group compared with the waiting list group. Merion et al. [29] compared ECD and the standard groups (defined as patients on waiting lists and non-ECD KT) and found the risk of death was lower in ECD groups after 33 weeks and the risk of cumulative mortality was lower after 3.5 years, since the early high-risk period was related to surgery and immunosuppression. Lastly, Heldal et al. [2] also reported that the ECD group showed a cumulative survival advantage beyond 2.5 years compared with patients on the waiting list undergoing dialysis. For these reasons, if patients are managed well in this early high-risk period (the first 2 years following KT), ECD transplantation using a marginal donor kidney is feasible.
The KDPI removes transplant-related factors from the KDRI, and is normalized to a percentile score, so that, for example, risk of a kidney with a KDPI of 70 is judged to be worse than the risk of 70% of kidneys recovered for transplantation in the prior year. Although a kidney with a high KDPI is predicted to confer greater average risk when compared with a kidney with a lower KDPI, a patient who declines a high-KDPI kidney runs the risk of dying before receiving that lower KDPI offer [30].
Careful kidney selection is essential since short-term graft failure can be devastating both physically and psychologically for the patient and may also result in HLA sensitization or increased debility, limiting the possibility of re-transplantation in the future [31].
Based on these findings, it is hoped that ideal kidneys for transplantation can be identified via US; thus, this study set an eGFR of less than 30 mL/min/1.73 m2 after 1 year as the primary end point and 2-year graft survival as the secondary end point. Deceased donor kidney function was evaluated using preoperative US parameters of the donor kidney by analyzing cortical thickness or renal length alone and in combination with other donor factors to determine acceptable kidney grafts. The US findings in deceased donor kidneys, including cortical thickness <0.6 cm, parenchymal thickness <1.3 cm, and a product of renal length and cortical thickness <6.6 were risk factors associated with an eGFR below 30 mL/min/1.73 m2 within 1 year (P=0.005, P=0.047, and P=0.003, respectively).
Kidney volume is closely correlated with function in living kidney donors and is an independent determinant of post-transplant graft outcome [32], while renal cortical volume is associated with kidney function [33]. If the product of renal length and cortical thickness, representing cortical volume, is statistically significant, this indicates that the preoperative US findings of the donor kidney are meaningful for predicting short-term graft failure.
Although no statistical significance of ECD for 2-year graft survival was found in the univariable analysis (P=0.152), it was included in the modeling since it was a clinically important variable. As shown in Table 4, the product of renal length and cortical thickness for all models showed a statistically significant relationship with 2-year graft failure (P=0.003, P=0.023, P=0.007, P=0.004, and P=0.022, respectively). This means that preoperative US can be an important modality to predict short-term graft function, even when adjusting for variables related to or representing kidney function, such as age, sex, BMI, ECD, and KDPI.
Given the causes of graft failure and recent studies of kidneys discarded based on extended criteria for kidney donors, the authors do not recommend narrowing the scope of ECD or discarding high-KDPI kidneys by diagnosing unacceptable kidneys based only on the US results of the donor. Instead, the authors would like to emphasize the need for more careful selection by presenting additional opinions in the preoperative kidney evaluation. If poor graft survival is expected, closer monitoring of postoperative kidney function may be needed.
The retrospective nature of this study is associated with some limitations. First, although short-term survival of 1 to 2 years is also important for determining graft function, long-term survival data determining patients’ prognosis have yet to be evaluated. Second, due to the nature of US, errors can occur even when an experienced genitourinary radiologist performs the examination, and a successful outcome depends on operator skill. If evaluation using US becomes essential in donor kidney selection, an on-call radiologist is also required, which is not possible at all centers. However, going to the computed tomography room itself is a burden for patients with hemodynamic instability; thus, a major advantage of US is that it can be easily checked from the bedside. Although this was a single-center study in a homogeneous study population and rather limited to high-quality donors, its results could be generalizable to other populations since corrections were made using the ratio of height to weight of both donors and recipients, which is closely related to kidney volume. Rejection episodes, side effects of calcineurin inhibitor use, and infection episodes are associated with major outcomes (eGFR less than 30 mL/min/1.73 m2 and graft failure within 2 years), but were not explored in this study since it was difficult to analyze a large number of variables at the same time while recruiting a sufficient number of patients. In addition, the data showed wide confidence intervals due to the relatively small number of events compared to variables (i.e., the total number of events of 2-year graft failure was only 10). Patient populations are being pooled through continuing data collection to overcome these limitations.
Despite these limitations, this is the first study to preoperatively predict deceased donor kidney function through US. This could be a foundational paper demonstrating that US is meaningful for the evaluation of deceased donor kidneys and is helpful in predicting graft function. Additional prospective studies for ECD or high-KDPI groups will be expected to suggest the benefits of US for predicting renal function preoperatively.
Preoperative US of donor kidneys can be used to evaluate donor kidney function and predict short-term graft survival. It is recommended that an imaging modality such as US should be included in donor selection criteria. If extremely marginal results are seen on US, graft survival outcomes will be poor, suggesting that such kidneys should not be used to ensure recipient safety.
However, the purpose of this study was not to narrow the donor criteria. Instead, the authors recommend that a comprehensive evaluation of immunologic and medical conditions is necessary, rather than evaluating kidneys only with US, since it is important to continue to broaden the donor criteria and lower the discard rate in order to give patients on waitlists more opportunities for KT.
Acknowledgments
This research was supported by SungKyunKwan University and the BK21 FOUR (Graduate School Innovation) grant funded by the Ministry of Education (MOE, KOREA) and the National Research Foundation of Korea (NRF).
Notes
Author Contributions
Conceptualization: Lee KW, Park SY, Park JB, Kim MJ. Data acquisition: Lee KW. Data analysis or interpretation: Yun SO, Lee KW, Park SY, Park JB, Kim MJ, Park B. Drafting of the manuscript: Yun SO. Critical revision of the manuscript: Yun SO, Lee KW, Park JB, Kim MJ, Park SY, Park B. Approval of the final version of the manuscript: all authors.
No potential conflict of interest relevant to this article was reported.
Supplementary Material
Supplementary Fig. 1. Scatterplot matrix of age, kidney donor risk index (KDRI), kidney donor profile index (KDPI), and ultrasound parameters (https://doi.org/10.14366/usg.22132).
Supplementary Fig. 1
Scatterplot matrix of age, kidney donor risk index (KDRI), kidney donor profile index (KDPI), and ultrasound parameters.