Diagnostic accuracy of CT and Doppler US for hepatic outflow obstruction after pediatric liver transplantation using left lobe or left lateral section grafts
Article information

Abstract
Purpose
The aim of this study was to evaluate diagnostic accuracy and to establish computed tomography (CT) and Doppler ultrasonography (US) criteria for hepatic outflow obstruction after pediatric liver transplantation (LT) using left lobe (LL) or left lateral section (LLS) grafts.
Methods
Pediatric patients who underwent LT using LL or LLS grafts between January 1999 and December 2021 were retrospectively included. The diagnostic performance of Doppler US and CT parameters for hepatic outflow obstruction was calculated using receiver operating characteristic (ROC) curve analysis. A diagnostic decision tree model combining the imaging parameters was developed.
Results
In total, 288 patients (150 girls; median age at LT, 1.8 years [interquartile range, 0.9 to 3.6 years]) were included. Among the Doppler US parameters, venous pulsatility index (VPI) showed excellent diagnostic performance (area under the ROC curve [AUROC], 0.90; 95% confidence interval [CI], 0.86 to 0.93; Youden cut-off value, 0.40). Among the CT parameters, anastomotic site diameter (AUROC, 0.92; 95% CI, 0.88 to 0.95; Youden cut-off, 4.2 mm) and percentage of anastomotic site stenosis (AUROC, 0.88; 95% CI, 0.84 to 0.92; Youden cut-off, 35%) showed excellent and good diagnostic performance, respectively. A decision tree model combining the VPI, peak systolic velocity, and percentage of anastomotic site stenosis stratified patients according to the risk of hepatic outflow obstruction.
Conclusion
VPI, anastomotic site diameter, and percentage of anastomotic site stenosis were reliable imaging parameters for diagnosing hepatic outflow obstruction after pediatric LT using LL or LLS grafts.

Introduction
Liver transplantation (LT) for end-stage liver disease, which is conventionally performed in adults, is increasingly being performed in the pediatric population, and significant progress in outcomes has been shown [1-4]. Recent data indicate that pediatric patients now represent approximately 8% of liver transplants in the United States [5]. Despite these improvements, postoperative complications remain a significant hurdle to good outcomes in the pediatric population [6]. These may be attributed to the smaller size of the liver in pediatric patients, vessel size discrepancies, and limited experience with pediatric cases [7]. Indeed, the minor or major postoperative complication rates after pediatric LT are reported to be up to 41% [8].
Among the various postoperative complications, vascular complications are the main cause of short-term graft loss and mortality [4,9]. Hepatic artery stenosis is the most common vascular complication, occurring in 8.3% of children [6,10]. Although hepatic vein (HV) complications occur less frequently than other vascular complications [7], they are more commonly observed after left-sided liver grafts in children than in adults, possibly because a left-sided graft is more prone to pivot around the inferior vena cava (IVC) and is more likely to be distorted during regeneration, leading to a high risk of hepatic outflow obstruction [11,12].
To prevent the loss of liver grafts due to complications, it is crucial to detect issues early and intervene in a timely manner. Although Doppler ultrasonography (US) and computed tomography (CT) have a certain diagnostic role within the established diagnostic criteria for the diagnosis of outflow obstruction of liver grafts in the adult population [13-15], it is questionable whether these criteria are directly applicable to left-sided liver grafts in the pediatric population. Therefore, this study evaluated the diagnostic accuracy of Doppler US and CT, and established criteria for the diagnosis of hepatic outflow obstruction after pediatric LT using left lobe (LL) or left lateral section (LLS) grafts.
Materials and Methods
Compliance with Ethical Standards
This single-center retrospective study was approved by the institutional review board of the authors’ affiliated institution Asan Medical Center (IRB No. 2019-1450), and the requirement for written informed consent was waived. This study was conducted according to the Standards for Reporting of Diagnostic Accuracy Studies (STARD) guidelines [16].
Patients
Consecutive data on pediatric patients who underwent LT using an LL or LLS graft at the authors’ affiliated institution between January 1999 and December 2021 were retrospectively collected. The following exclusion criteria were applied: (1) use of dual donor grafts; (2) no available US or CT before HV angiography or the end of follow-up; and (3) poor US or CT image quality. The donor graft was selected according to the estimated graft-recipient weight ratio (less than 4% considered appropriate to prevent large-for-size graf-trelated problems) and the LL and LLS shape. The intra-operative hepatic venoplasty method was decided at the surgeon’s discretion depending on the left hepatic vein (LHV) anatomy and the presence of superficial LHV [17,18].
Follow-up
According to the institution’s protocol, Doppler US was performed on postoperative day 1, and Doppler US and contrast-enhanced CT scans, including at least arterial and portal venous phases, were performed on postoperative day 4. Doppler US was generally performed weekly until discharge, but at more frequent intervals when vascular complications were suspected on follow-up imaging, liver enzymes were unusually high (determined based on clinicians’ judgment, without fixed cut-off values), or the surgeon judged there to be a high risk of vascular complications after surgery. Follow-up Doppler US was conducted every 3 months within the first year after discharge, and then annually thereafter. If vascular complications were suspected on follow-up Doppler US, the follow-up intensity of Doppler US was raised to every 3 months.
HV angiography was indicated when hepatic outflow obstruction was clinically suspected, such as in cases of clinically evident ascites, liver enzyme abnormalities despite adequate serum immunosuppressant levels or equivocal or suspected HV stenosis on spectral Doppler US or CT. Of note, during the study period, hepatic outflow obstruction was assessed by a pediatric radiologist, mainly based on the waveform pattern, without specific quantitative diagnostic criteria.
US and CT Examinations
All US examinations were performed by one of five experienced pediatric radiologists using an i800 system (Canon Medical Systems, Otawara, Japan) with i8CX1 or i10CX1 probes, EPIQ 5 (Philips Healthcare, Best, Netherlands) with C9-2 or C5-1 probes, IU-22 (Philips Healthcare) with C9-4 probe, or ATL HDI 5000 (Philips Healthcare) with C7-4 probe. The probe was selected at the radiologist’s discretion. US examinations were performed with the patient lying in a supine position. If clinically indicated, the US examination was conducted under sedation, according to the institutional protocol. A subcostal view was preferentially used for HV evaluation because LL or LLS liver grafts are often located in the midline or left upper quadrant area, and the intercostal window is small in pediatric subjects. A color Doppler examination was performed to evaluate the direction of HV flow. Spectral Doppler waveforms were obtained at locations where Doppler-detectable blood flow was present. The velocity scale was optimized for each patient, with the Doppler angle ranging from 30°-60° during the measurement.
For the post-LT evaluation, patients underwent at least one contrast-enhanced CT examination (SOMATOM Definition Edge, SOMATOM Definition AS+, SOMATOM Definition Flash, or SOMATOM Sensation, Siemens Healthcare, Forchheim, Germany; Discovery CT750 HD, GE Healthcare, Waukesha, WI, USA). Arterial and portal venous phase CT images were typically obtained with a bolus-triggered technique. Unenhanced CT images were not obtained. The details of the CT acquisition are presented in Supplementary Method 1.
Imaging Analysis
US images were retrospectively reviewed by a single board-certified pediatric radiologist (P.H.K., 3 years in pediatric radiology) using a picture archiving and communication system (Petavision, Hyundai Information Technology, Seoul, Korea). When there were two or more HVs, the largest LHV on imaging was measured, as it is presumed to be a major draining vein maintaining the outflow of the liver graft. The peak systolic velocity (PSV) and venous pulsatility index (VPI) were retrospectively calculated using the ratio between the height at the point of interest and the velocity scale on the Doppler curve (Fig. 1). The VPI was defined as the difference between the maximum and minimum frequency shifts in the venous waveform in a cardiac cycle divided by the maximum frequency shift. Therefore, the VPI of a flat waveform was 0 and that of a typical triphasic waveform was more than 1. In addition, the distance from the IVC to the measurement site (Dmeasurement) was retrospectively measured using the ratio between the length from the IVC to the measurement site and the depth scale.

Representative examples for the measurement of Doppler ultrasonography (US) and computed tomography (CT) parameters.
A, B. Post-transplant color and Doppler US findings without hepatic outflow obstruction were obtained from (A) a 7-year-old boy (biphasic pattern) and (B) a 6-year-old girl (triphasic pattern). The venous pulsatility index (VPI) was calculated as the difference between the maximum (peak systolic velocity; annotated as a) and minimum frequency shifts (annotated as b) in the venous waveform in a cardiac cycle divided by the maximum frequency shift. The distance of the measurement from the inferior vena cava (IVC) (Dmeasurement) was also retrospectively measured using the ratio between the length from the IVC to the measurement site and the depth scale. Note that the VPI is higher than 1 in a triphasic pattern. C. A post-transplant contrast-enhanced CT image was obtained from a 5-year-old girl without hepatic outflow obstruction. The diameters of the left hepatic vein (LHV) anastomotic site (Dana) and the LHV at 1 cm distal to the anastomotic site (DLHV) were measured in the sagittal plane. The percent stenosis was calculated as (DLHV-Dana)/ DLHV×100.
CT images were preferentially evaluated on sagittal reconstructed views (Fig. 1). The diameter of the LHV anastomotic site (Dana) and the diameter of the LHV at 1 cm distal to the anastomotic site (DLHV) were measured. The percentage of the anastomotic site stenosis (% stenosis; [DLHV-Dana]/DLHV×100) was also calculated. In addition, the presence of ascites, pleural effusion, nonenhancement of LHV, and abnormal parenchymal enhancement on the portal phase (i.e., decreased, mottled, reticulated, or mosaic pattern of liver parenchymal contrast enhancement) was recorded.
Hepatic outflow obstruction was diagnosed by HV angiography and was defined as severe narrowing at the anastomosis with stasis, or with a pressure gradient of 5 mmHg or greater. Since there was no suggested cut-off value for the pressure gradient, the approximate average of the suggested cut-off values was taken from the existing literature (range, 3 to 10 mmHg) [14,19-23]. A representative case of hepatic outflow obstruction is presented in Fig. 2. If the patient underwent HV angiography, angiographic findings were considered as the reference standard, and the index tests were the last US and CT examinations performed before HV angiography. Since patients without clinical signs or symptoms of suspected hepatic outflow obstruction did not undergo HV angiography, hepatic outflow obstruction was considered to be absent in those patients, and the index tests were the most recent US and CT examinations during follow-up.

A 2-year-old girl with hepatic outflow obstruction after cadaveric liver transplantation due to progressive familial intrahepatic cholestasis type II.
A. Color and Doppler ultrasonography obtained 3 months after the liver transplantation showed a monophasic waveform of the left hepatic vein (LHV), with a venous pulsatility index of 0.21 (points of maximum and minimum frequency shift are noted as a and b in the Doppler spectrogram) and peak systolic velocity of 13.8 cm/s. B. A sagittal computed tomography scan obtained during the portal venous phase 3 months after liver transplantation shows significant LHV anastomotic site stenosis, with a diameter of 2.0 mm and 76% stenosis (arrowheads). There is also mottled enhancement of liver parenchyma (asterisk) and a considerable amount of ascites (arrow). C. Subsequent hepatic venous angiography shows 80% LHV stenosis with a pressure gradient of 17 mmHg (arrowheads). D. After balloon angioplasty, the LHV stenosis improved, with a decrease in pressure gradient to 4 mmHg (arrowheads).
Statistical Analysis
Univariable and multivariable logistic regression analyses were performed to identify imaging parameters significantly associated with hepatic outflow obstruction. Backward variable selection with a P-value <0.2 in the univariable analysis was used to select variables for the multivariable regression analysis. Variables with a variance inflation factor >10 were removed from the analysis due to multicollinearity issues.
Diagnostic accuracy was evaluated using receiver operating characteristic (ROC) curve analysis and sensitivity, specificity, and area under the ROC curve (AUROC), together with their 95% confidence intervals (CIs). Cut-off values were calculated for continuous parameters according to the maximum Youden index, and also for fixed sensitivity and specificity values of 95%, to mitigate the impact of test inaccuracies across varying weights between false positives and false negatives. AUROC was interpreted as follows: 0.5-0.6, failed; 0.6-0.7, poor; 0.7-0.8, fair; 0.8-0.9, good; and ≥0.9, excellent [24]. To assess the robustness of the results against potential bias resulting from inconsistent timing between US and CT scans, a subgroup analysis was conducted including cases where (1) the interval between US and CT was less than 1 month and (2) the intervals both between LT and US and between LT and CT were less than 1 year.
In addition, a classification and regression tree (CART) decision tree model to predict hepatic outflow obstruction was constructed using imaging parameters. Considering that CT is generally performed when HV stenosis is suspected after screening with Doppler US, decision tree models were developed for two scenarios: scenario 1 using only US parameters, and scenario 2 using both US and CT parameters.
A supplementary analysis was also performed to estimate the effect of the distance of the measurement site from the IVC on the US parameters (i.e., PSV and VPI), using linear regression analysis to evaluate the interaction effect of the presence versus absence of hepatic outflow obstruction. The independent t-test was used to estimate the significance of differences in PSV and VPI between patients with or without hepatic outflow obstruction according to the Dmeasurement, which was divided into <10 mm, 10-30 mm, and >30 mm. The cut-off value of 3 cm was selected in accordance with the institution’s protocol (recommending Dmeasurement <3 cm). Additionally, a cut-off value of 1 cm was chosen, as the authors hypothesized that a Dmeasurement <1 cm might falsely reflect the spectra of the IVC rather than the HV.
The ROC analysis was conducted using MedCalc software version 22.007 (MedCalc Software, Ostend, Belgium), while the other statistical analyses were conducted using R software version 3.6.1 (R Foundation for Statistical Computing, Vienna, Austria). All tests were two-sided, with the significance level set at P=0.05.
Results
Patients
During the study period, 362 pediatric patients underwent LT. Among them, 64 patients who underwent LT using the whole liver (n=38), right liver (n=23), or dual donor grafts (n=3) were excluded. In addition, six patients with poor US or CT image quality and four patients without available US or CT before HV angiography or the end of follow-up were excluded. Consequently, a total of 288 patients were included in the analysis (150 girls; median age at LT, 1.8 years [interquartile range (IQR), 0.9 to 3.6 years]).
During the post-LT follow-up, HV angiography was performed in 42 patients, and hepatic outflow obstruction was diagnosed in 38 (13.2%; 95% CI, 9.7% to 17.6%). In 42 patients who underwent HV angiography, the median intervals between HV angiography and US, between HV angiography and CT, and between US and CT, were 4 days (IQR, 2 to 9.5 days), 7.5 days (IQR, 2.3 to 15.8 days), and 3 days (IQR, 1 to 8 days), respectively. In the other 246 patients who did not undergo HV angiography, the median interval between US and CT was 1.6 years (IQR, 0.5 to 4.9 years).
The cumulative incidence of hepatic outflow obstruction was 12.6% at 2 years and 14.5% at 10 years (Supplementary Fig. 1). The detailed baseline characteristics are presented in Table 1. Of note, the age at LT was significantly higher in the patients with hepatic outflow obstruction than in those without obstruction (45.5 vs. 18.0 months, P<0.001). In addition, cadaveric donor grafts (36.8% [14 of 38] vs. 19.2% [48 of 250], P=0.024) and LL grafts (36.8% [14 of 38] vs. 20.0% [50 of 250], P=0.034) were more frequently used in patients with hepatic outflow obstruction. The patients with and without hepatic outflow obstruction showed a significant difference in the intervals between LT and CT (0.6 vs. 5.5 years, P<0.001) and between LT and US (0.8 vs. 8.1 years, P<0.001).

Baseline characteristics of the 288 included patients
Diagnostic Performance of Imaging Parameters
In the univariable logistic regression analysis, all US and CT parameters except Dmeasurement showed significant associations with hepatic outflow obstruction. In the multivariable logistic regression analysis, the VPI (in 0.1 units; adjusted odds ratio [OR], 0.421; 95% CI, 0.280 to 0.596; P<0.001) and Dana (with units in millimeters; adjusted OR, 0.413; 95% CI, 0.280 to 0.568; P<0.001) were significantly associated with LHV stenosis (Table 2).

Results of logistic regression analysis
The results of the ROC curve analysis are presented in Table 3. The VPI showed excellent diagnostic accuracy (AUROC, 0.90; 95% CI, 0.86 to 0.93), with a sensitivity of 0.74 (95% CI, 0.57 to 0.87), a specificity of 0.91 (95% CI, 0.87 to 0.94), and a maximized Youden index cut-off of 0.40. The fixed cut-off values for 95% sensitivity and specificity were 0.64 and 0.37, respectively. Regarding the CT parameters, Dana (AUROC, 0.92; 95% CI, 0.88 to 0.95) showed excellent performance. In detail, the sensitivity and specificity of Dana under the maximized Youden index cut-off of 4.2 mm were 0.87 (95% CI, 0.72 to 0.96) and 0.84 (95% CI, 0.79 to 0.88), respectively. Percent stenosis showed good diagnostic performance (AUROC, 0.88; 95% CI, 0.84 to 0.92), with a sensitivity of 0.82 (95% CI, 0.55 to 0.92) and a specificity of 0.89 (95% CI, 0.83 to 0.92) under the maximized Youden index cut-off of 35%. Although abnormal parenchymal hyperenhancement and nonenhancement of LHV showed high specificity (0.97 [95% CI, 0.94 to 0.99] and 1.00 [95% CI, 0.99 to 1.00], respectively), they showed poor sensitivity (0.42 [95% CI, 0.26 to 0.59] and 0.26 [95% CI, 0.13 to 0.43], respectively). Good to excellent diagnostic performance was also observed for VPI, Dana, and percent stenosis in the subgroup analysis including cases where the interval between US and CT was less than 1 month (Supplementary Table 1) and where the intervals between both LT and US, and LT and CT, were less than 1 year (Supplementary Table 2).
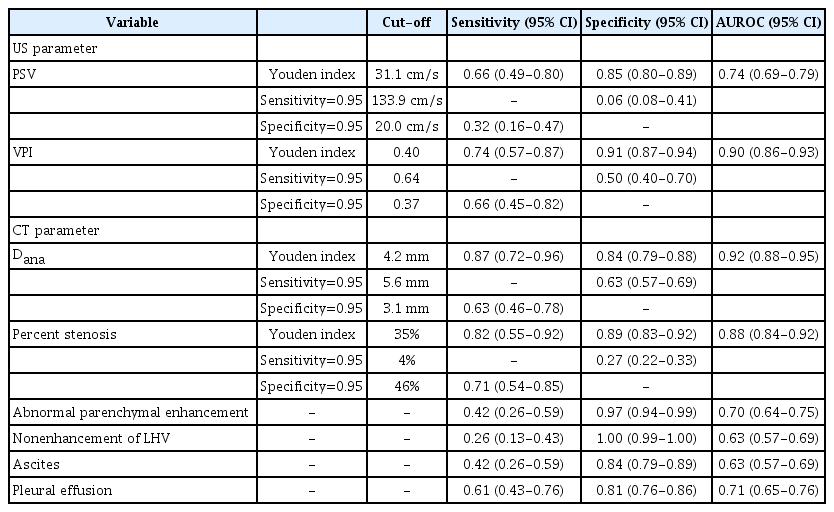
Results of ROC curve analysis
Decision Tree Analysis
In scenario 1 (using US parameters only), both PSV and the VPI were included in the decision tree model (Fig. 3), which yielded an AUROC of 0.94 (95% CI, 0.90 to 0.96). In scenario 2 (using both US and CT parameters), stenosis and the VPI were included in the decision tree model (Fig. 3), which resulted in an AUROC of 0.95 (95% CI, 0.92 to 0.97).
Diagnostic flowchart for the prediction of hepatic outflow obstruction using US parameters (A) and US and CT parameters (B).
US, ultrasonography; CT, computed tomography; VPI, venous pulsatility index; PSV, peak systolic velocity.
Impact of the Distance of the Doppler Measurement Site
Linear regression analysis revealed that Dmeasurement was significantly associated with PSV (P<0.001), but not with VPI (P=0.410). There was no significant interaction effect of the presence versus absence of hepatic outflow obstruction between Dmeasurement and PSV (P=0.283) or between Dmeasurement and VPI (P=0.344).
When subgrouping Dmeasurement into <10 mm, 10-30 mm, and >30 mm, only the 10–30 mm subgroup showed a significant difference in PSV (P=0.003) and the VPI (P<0.001) between patients with and without hepatic outflow obstruction (Supplementary Fig. 2). The VPI (AUROC, 0.91; 95% CI, 0.87 to 0.95), Dana (AUROC, 0.92; 95% CI, 0.87 to 0.95), and percent stenosis (AUROC, 0.89; 95% CI, 0.84 to 0.93) showed good to excellent performance in the subgroup analysis including cases with Dmeasurement of 10-30 mm (Supplementary Table 3).
Discussion
There is a paucity of data on the diagnostic accuracy of US or CT for HV stenosis following pediatric left liver graft. This study confirmed that US and CT had good diagnostic accuracy for the evaluation of hepatic outflow obstruction. In particular, the VPI demonstrated excellent diagnostic performance (AUROC, 0.90; 95% CI, 0.86 to 0.93), with a maximum Youden index cut-off of 0.40 and 95% specificity cut-off of 0.37. On CT, the diameter of the left HV anastomotic site (AUROC, 0.92; 95% CI, 0.88 to 0.95) showed excellent diagnostic performance. In addition, a diagnostic flowchart was proposed using a CART decision tree model, which would make decision-making easier based on multiple imaging parameters. These findings are anticipated to help facilitate the early detection of hepatic outflow obstruction in pediatric patients who undergo LT, thereby contributing to the preservation of liver grafts.
Doppler US has an established role in the diagnosis of HV stenosis of liver grafts in adults [13-15]. A monophasic waveform has been used as an important indicator of HV stenosis because cardiac pulses cannot be transmitted to the HV in the setting of stenosis. However, some ambiguity exists in the discrimination of monophasic and biphasic patterns of HV. Furthermore, there are uncertainties about its applicability to the pediatric population because of a paucity of data. The present study confirmed that Doppler US, especially using the VPI, had excellent accuracy in the diagnosis of HV stenosis. In particular, VPI, as a quantitative value, can be recommended because of its higher reproducibility than subjective pattern-based evaluation (i.e., monophasic vs. biphasic pattern) [9]. The VPI is recognized as an important tool for diagnosing HV stenosis after adult LT, with reported cut-off values of 0.16 to 0.45 [14,19]. The suggested maximum Youden value cut-off in this study was 0.40, which is within the reported range of cut-off values for the adult population.
It was also observed that PSV played an adjunctive diagnostic role in scenario 1 (US screening). Although it was not identified as a significant factor in the multivariable analysis, as presented in the diagnostic flowchart, PSV discriminated the presence versus absence of LHV stenosis when VPI values ranged from 0.22 to 0.37. Specifically, when PSV exceeded 30 cm/s in such cases, the risk of LHV stenosis was only 25%. However, when PSV was lower than 30 cm/s, the risk of LHV stenosis was 75%. This finding is in accord with observations from other studies [25,26], further supporting the diagnostic utility of PSV in conjunction with the VPI. However, it was found that PSV was influenced by Dmeasurement, with PSV decreasing as Dmeasurement increased. In particular, there was no statistically significant difference in PSV between cases with and without LHV stenosis with Dmeasurement >30 mm or <10 mm. This phenomenon could be partially explained by the fact that the Doppler frequency shift is attenuated as the flow propagates [10]. The HV Doppler wave is created by the blood flow through the HV related to the cardiac cycle. As the Dmeasurement increases, the Doppler waveform created by the cardiac cycle becomes attenuated, decreasing the PSV. Although the reason why the VPI was not affected by Dmeasurement seems unclear, it could be speculated that the VPI, considered as a proportion, would remain unchanged even if the overall frequency shift of the waveform decreases. Therefore, the authors recommend keeping Dmeasurement within 10–30 mm to minimize underestimation of PSV.
Considering that CT is considered the decisive imaging modality for determining the need for conventional angiography, high diagnostic accuracy is essential. Thus, it would be reasonable to consider all CT parameters when making a decision. Among the CT parameters, Dana and percent stenosis demonstrated good diagnostic performance. As CT is generally used for "rule-in" purposes in clinical settings, using a cut-off value of 3.1 mm for Dana and 46% for percent stenosis would ensure 95% specificity. The cut-off value of 47% for percent stenosis in the diagnostic flowchart could also be understood in a similar context. In addition, although they were not significant in the multivariable analysis, it would be helpful to evaluate liver parenchymal and LHV enhancement, as these findings demonstrated very high specificity of 0.97 and 1.00, respectively.
This study has several limitations. First, since conventional angiography was not performed in all patients, there is a chance that some of the cases where HV outflow obstruction was classified as absent might actually have had mild HV outflow obstruction. Second, some discrepancies and inconsistencies existed in the timing between US and CT scans, especially in cases without HV outflow obstruction. While US was performed at maximum intervals of 6-12 months, CT was not routinely performed, except on the fourth day after LT. Indeed, the median interval between US and CT was 3 days (IQR, 1 to 8 days) in patients who underwent HV angiography, whereas it was 1.6 years (IQR, 0.5 to 4.9 years) in patients who did not undergo HV angiography. However, the effect of this potential bias seems minimal because similar results were reproduced in the subgroup analysis including cases with an interval of less than 1 month between US and CT. Third, the US measurement techniques were not standardized during the study period. Fourth, the imaging review was conducted by a single reader, thereby limiting the generalizability and reproducibility of the results. Fifth, this study did not consider the effect of the time interval between LT to examination, which might influence Doppler US values [9]. Sixth, The CT and US machines varied during the study period. Lastly, a validation cohort was not established because of the relatively small number of hepatic outflow obstruction cases in the study population, which limits the generalizability of the findings. Further research is required to address this issue.
In conclusion, US and CT are useful imaging modalities for the diagnosis of hepatic outflow obstruction following pediatric LL or LLS grafts. The VPI, diameter of the LHV anastomotic site, and percent stenosis were found to be reliable imaging parameters for the diagnosis of hepatic outflow obstruction.
Notes
Author Contributions
Conceptualization: Kim PH, Yoon HM. Data acquisition: Kim PH, Cho YA. Data analysis or interpretation: Kim PH, Yoon HM, Jung AY, Lee JS, Cho YA, Oh SH, Namgoong JM. Drafting of the manuscript: Kim PH. Critical revision of the manuscript: Kim PH, Yoon HM, Jung AY, Lee JS, Cho YA, Oh SH, Namgoong JM. Approval of the final version of the manuscript: all authors.
No potential conflict of interest relevant to this article was reported.
Supplementary Material
Supplementary Method 1.
CT acquisition protocol (https://doi.org/10.14366/usg.23190).
Supplementary Table 1.
Results of ROC curve analysis in 73 patients with a time interval between US and CT of <1 month (https://doi.org/10.14366/usg.23190).
Supplementary Table 2.
Results of ROC curve analysis in 76 patients with a time interval between liver transplantation and US/CT of <1 year (https://doi.org/10.14366/usg.23190).
Supplementary Table 3.
Results of ROC curve analysis in 216 patients with a distance from the inferior vena cava to the measurement site of 10–30 mm (https://doi.org/10.14366/usg.23190).
Supplementary Fig. 1.
The cumulative incidence of hepatic outflow obstruction (https://doi.org/10.14366/usg.23190).
Supplementary Fig. 2.
Boxplot graphs of peak systolic velocity (A) and venous pulsatility index (B) according to the distance from the inferior vena cava (IVC) to the measurement site in patients with (red) and without (blue) hepatic outflow obstruction (https://doi.org/10.14366/usg.23190).
References
Article information Continued
Notes
Key point
Among the Doppler ultrasonography (US) parameters, the venous pulsatility index (Youden cut-off value, 0.40) showed excellent diagnostic performance. Among the computed tomography (CT) parameters, anastomotic site diameter (Youden cut-off, 4.2 mm) and the percentage of anastomotic site stenosis (Youden cut-off, 35%) showed excellent and good diagnostic performance, respectively. The combination of Doppler US and CT parameters, especially using a decision tree model, effectively stratifies the risk of hepatic outflow obstruction.