Non-traumatic lower abdominal pain: ultrasonographic and clinical differential diagnosis
Article information
Abstract
Lower abdominal pain is frequently reported and has a diverse differential diagnosis. In cases with atypical presentation and nonspecific findings, further imaging evaluation is required to confirm the clinical suspicion and to distinguish between self-limiting disorders and those requiring immediate intervention. In line with European guidelines, transabdominal ultrasonography is recommended as a first-line imaging modality for clinically suspected acute appendicitis and acute diverticulitis, which respectively represent the predominant causes of right and left lower quadrant abdominal pain. It is similarly the preferred method for evaluating suspected obstetric/gynecologic and genitourinary diseases. Computed tomography is utilized as a secondary option when ultrasonography results are inconclusive. This pictorial essay illustrates the sonographic features of the most common conditions associated with lower abdominal pain and outlines the clinical characteristics of each entity.
Introduction
Lower abdominal pain (LAP) represents a common concern with a broad differential diagnosis, ranging from self-limiting conditions to life-threatening surgical emergencies. The presence of overlapping or atypical clinical signs can complicate the evaluation of patients with LAP. A thorough history and physical examination are essential and should be supplemented with laboratory and imaging assessments as clinically indicated.
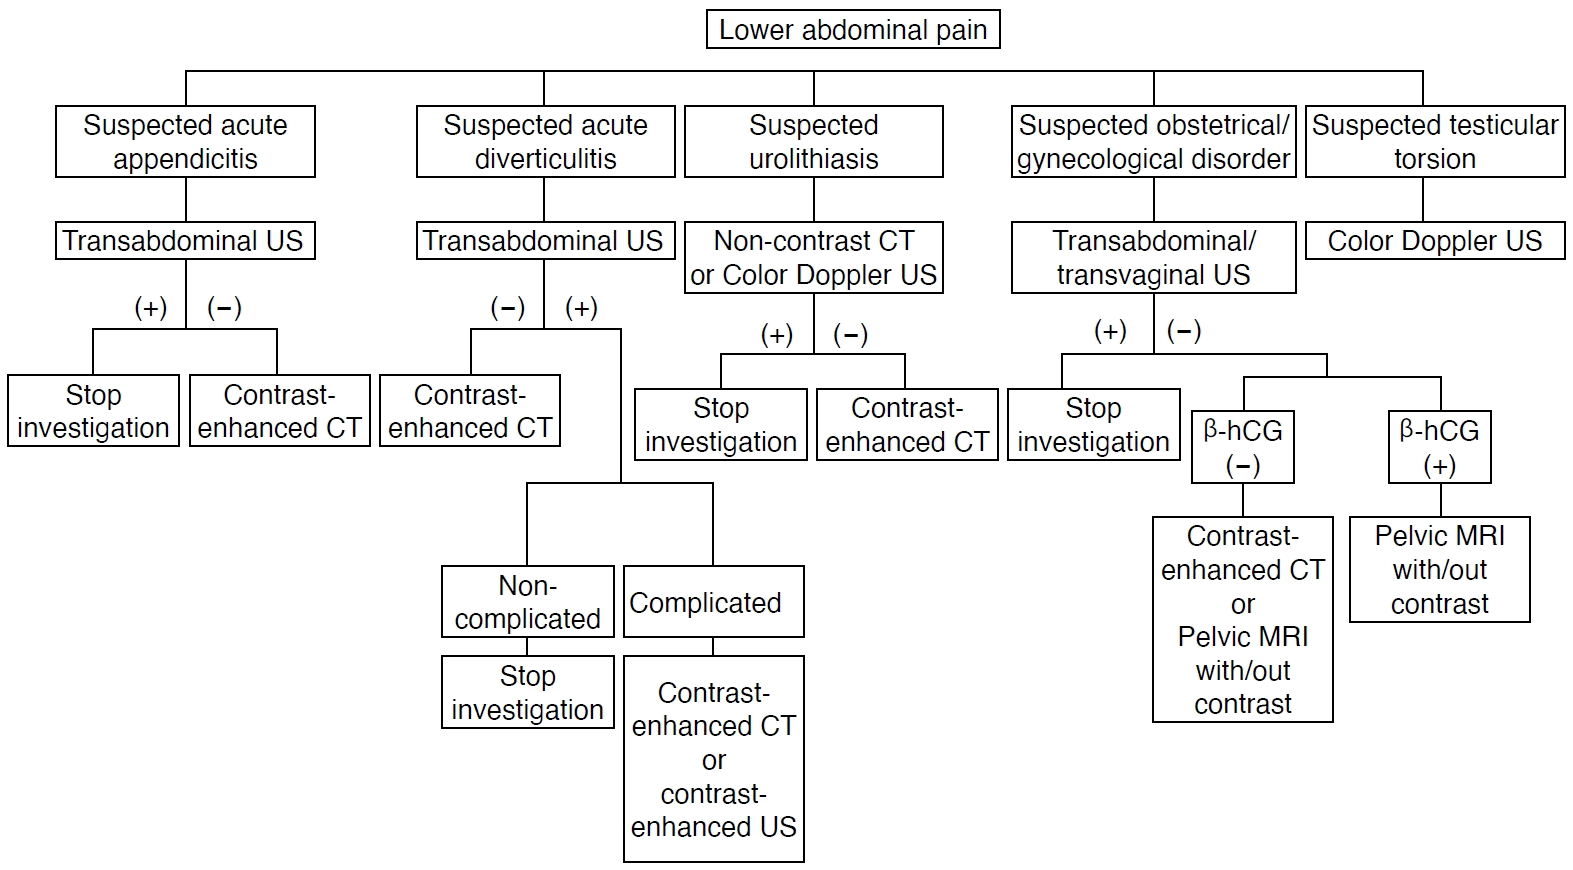
Recent recommendations suggest that transabdominal ultrasonography (US) should be routinely used in all patients with suspected acute appendicitis and diverticulitis. This approach allows for early risk stratification and reduces the need for additional computed tomography (CT) scans. Under these guidelines, CT should be reserved for cases in which US results are inconclusive [1-3]. Furthermore, the American College of Radiology appropriateness criteria recommend transabdominal US as the first-line imaging modality for suspected obstetric/gynecologic and genitourinary diseases, followed by contrast-enhanced CT when US findings are negative (Fig. 1) [4,5].
This pictorial essay summarizes the US appearances of the most common causes of LAP, accompanied by brief clinical notes intended to increase the clinical awareness of each entity.
Gastrointestinal Disorders
Acute Colonic Diverticulitis and Acute Appendicitis
Clinical presentation
Acute colonic diverticulitis (ACD) is the most common cause of left LAP, although individuals with a redundant sigmoid colon may experience suprapubic or right lower quadrant pain. Other potential symptoms include fever, nausea, and constipation. In cases of complicated ACD, patients may present with septic shock, exhibiting generalized guarding and rebound tenderness [6]. Acute appendicitis, which is the leading cause of right LAP, typically begins with periumbilical pain, which migrates to the right lower quadrant after several hours. This pain is often accompanied by peritoneal irritation, and patients also experience anorexia and nausea.
Imaging
A step-up strategy employing US as the first-line imaging method, followed by CT when US results are negative or inconclusive, seems to be the most effective approach for suspected acute diverticulitis or appendicitis [1]. The diagnostic accuracy of US can be compromised by factors such as obesity, diverticulitis affecting the distal sigmoid colon, and retrocecal or pelvic positioning of the appendix.
The presence of uncomplicated ACD is suggested by several findings: (1) short-segment colonic wall thickening greater than 5 mm; (2) inflamed diverticula within the thickened wall area, which manifest as focal discontinuities in the bowel wall; (3) inflammation of the perigut fat, appearing as a hyperechoic halo surrounding the bowel serosa or diverticula; (4) pericolic fluid; and (5) sonographic tenderness to compression (Figs. 2, 3) [1]. Complicated ACD is diagnosed based on the presence of intramural, pericolic, or distant abscesses, which appear as well-demarcated fluid collections that may contain echogenic debris, gas bubbles, and/or intraperitoneal fluid (Fig. 4) [1].
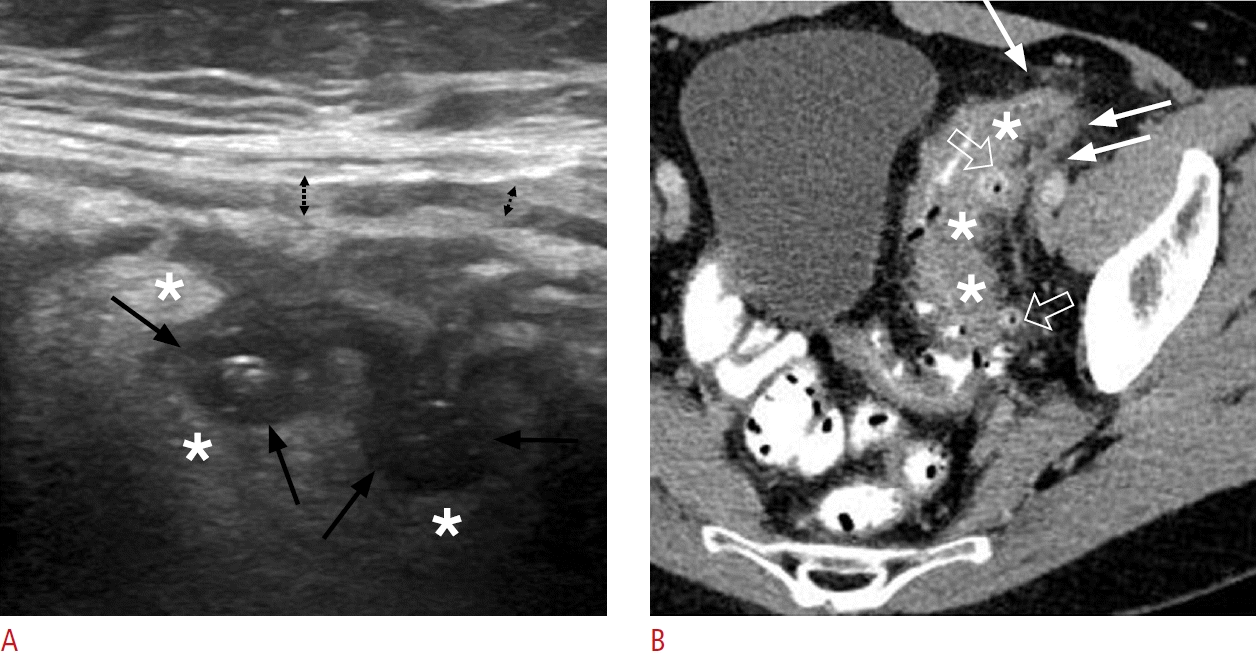
Acute uncomplicated colonic diverticulitis in a 63-year-old man.
A. Ultrasonographic image through the long axis of the sigmoid colon reveals air-/fluid-containing diverticula (black arrows) with surrounding inflammatory infiltration, evidenced by the hyperechogenicity of the pericolic fat (asterisks). Notable mural thickening of the sigmoid colon is also evident, with a prominent, hypoechogenic muscularis propria (dashed, black arrows). B. A corresponding axial contrast-enhanced computed tomography image displays multiple diverticular outpouchings scattered along the sigmoid colon (open arrows), with mural thickening (asterisks) and stranding of the adjacent fat planes (white arrows).

Acute uncomplicated colonic diverticulitis in a 59-year-old man.
A, B. Ultrasonographic images obtained perpendicular to the long axis of the sigmoid colon reveal an air-containing diverticulum appearing as a hyperechoic formation (arrowheads in A) adjacent to the colonic wall, causing acoustic shadowing (asterisk) and mural thickening with preserved wall stratification (dashed black arrows in A). Additionally, concomitant pericolic free fluid (white arrows in B) is visible. C. An axial non-contrast computed tomography image of the same sigmoid segment demonstrates pericolic stranding (asterisks) and variably sized diverticula, appearing as ovoid structures adjacent to the colonic wall and filled with air or fecal material (white arrows). A thick-walled diverticulum (arrowheads) is also noted, surrounded by marked fat inflammation.
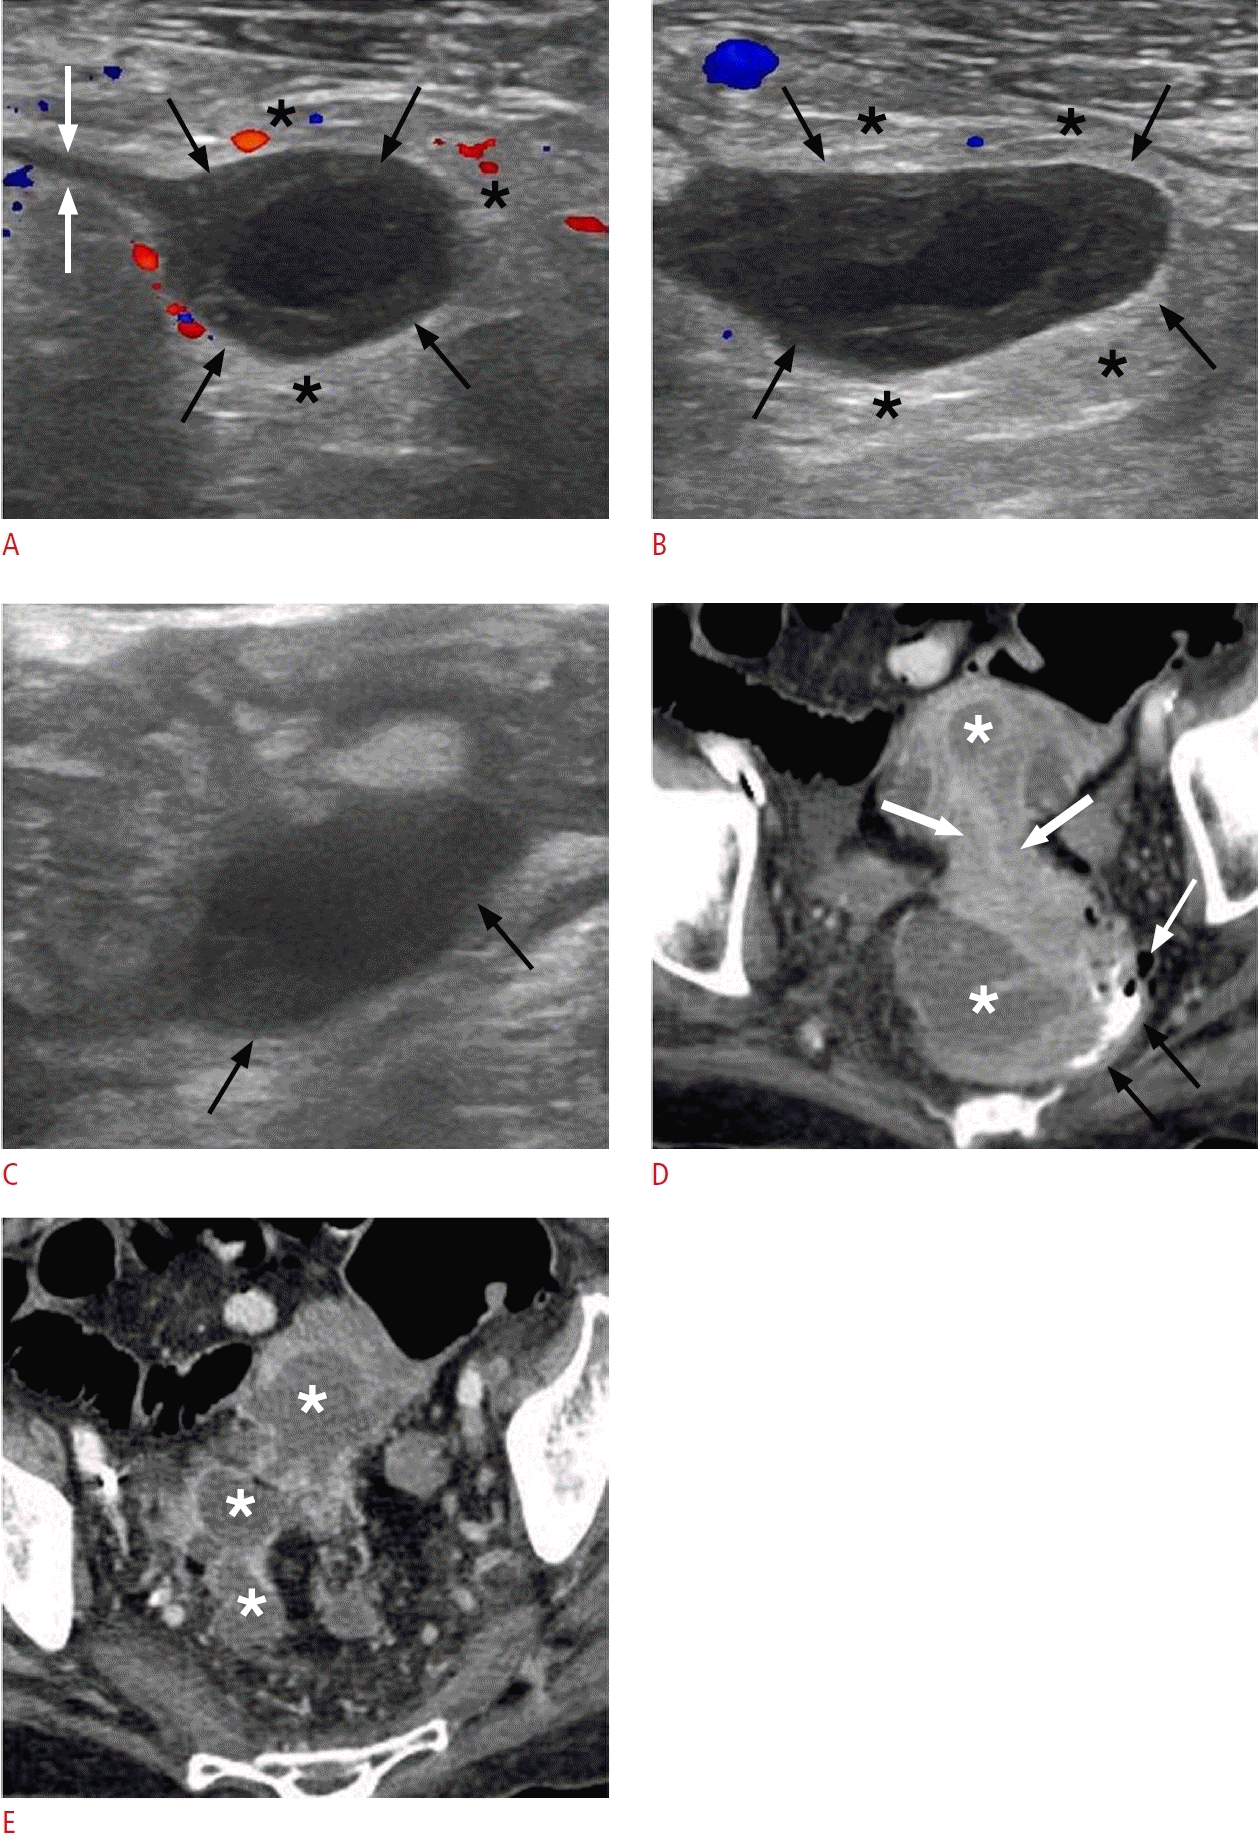
Acute complicated (Hinchey stage II) colonic diverticulitis in a 70-yearold woman.
A-C. Pelvic ultrasonographic images reveal ovoid, thick-walled fluid collections (black arrows indicative of pericolic and distant [A and B] or intramural [C] abscesses). These are encircled by a hyperechoic halo (asterisks in A and B), which corresponds to perilesional inflammatory fat changes. A fistulous tract is visible as a linear hypoechoic structure (white arrows in A), establishing a connection between the collection and the colonic lumen (not shown). D, E. Axial contrastenhanced computed tomography images demonstrate extensive irregular wall thickening with hypoattenuating submucosa (thick white arrows in D) and pronounced mucosal enhancement, indicative of colonic inflammation. Multiple fluid-filled collections with rim enhancement are present along the affected sigmoidal segment (asterisks) or at distant intrapelvic sites, consistent with abscesses. A small amount of contrast is observed within the lumen of the distal sigmoid (black arrows in D), accompanied by diverticula (thin white arrow).
The diagnosis of acute appendicitis can be confirmed by the presence of (1) an enlarged, incompressible appendix with an outer diameter greater than 6 mm; (2) sonographic tenderness to compression; and (3) hyperechoic periappendiceal tissue (Figs. 5, 6) [1]. To definitively rule out appendicitis, the entire length of the normal appendix must be visualized. The presence of substantial periappendiceal fluid and submucosal hypoechogenicity suggest perforation (Fig. 7).
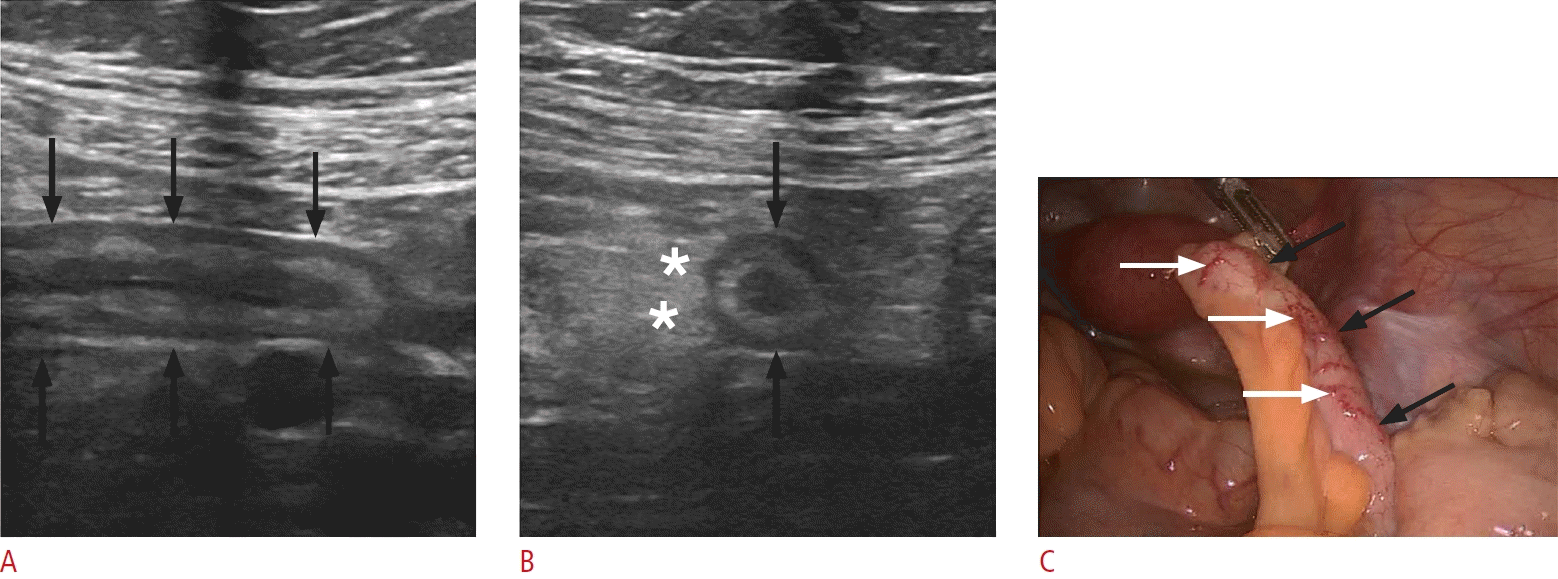
Acute appendicitis in a 14-year-old woman.
A. Sonographic image of the right lower quadrant displays the blind-ending appendix along its long axis (black arrows), with an outer diameter of 9 mm and preserved stratification. B. A sonographic image through the short axis of the appendix reveals appendiceal enlargement (black arrows) and periappendiceal hyperechoic, inflammatory fat changes (asterisks). C. A laparoscopic intraoperative image of the same patient exhibits a dilated appendix (black arrows) with mural hyperemia (white arrows).

Acute appendicitis in a 31-year-old man.
A. Sonographic image of the right lower quadrant displays an enlarged appendix along its long axis (black arrows), with preserved stratification. Hyperechoic periappendiceal inflammatory tissue (asterisks) and intraluminal appendicolith (white arrow) are also evident. B. A color Doppler sonographic image through the short axis of the appendix confirms its enlargement (black arrows) and shows mural hyperemia (white arrows). Note the concomitant presence of periappendiceal fluid (white asterisks) and hyperechogenic changes in the periappendiceal fat, indicative of inflammation (black asterisks). C. A laparoscopic image confirms the presence of a dilated appendix (black arrows) with wall hyperemia (white arrows).
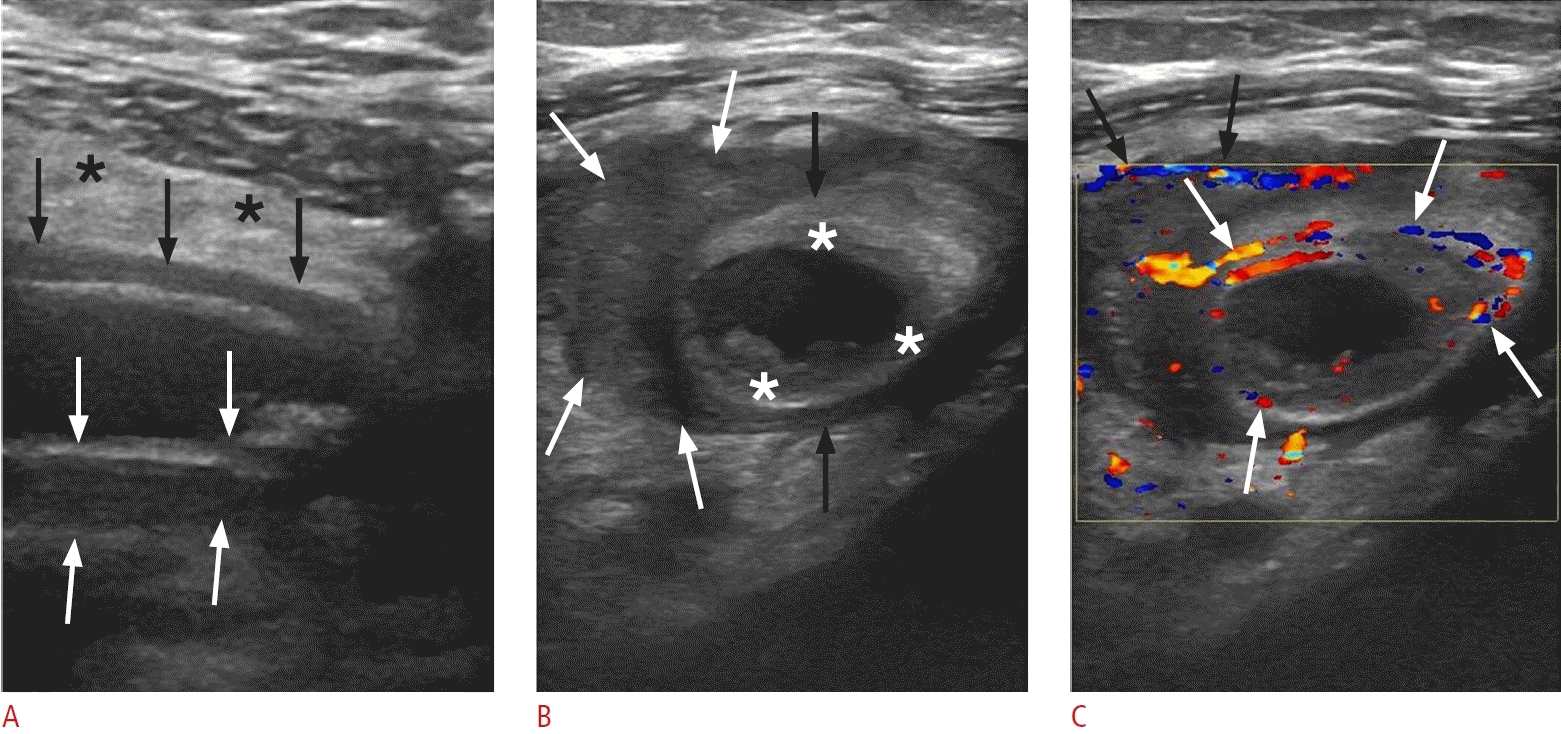
Acute appendicitis in a 33-year-old woman.
A. Longitudinal sonogram of the inflamed appendix shows a noncompressible, blind-ending tubular structure with an outer diameter of 12.3 mm (black arrows), accompanied by marked mural thickening (between the white arrows). The surrounding mesentery appears hyperechoic (black asterisks). B. Sonographic image captured across the short axis of the appendix (black arrows) reveals hypoechogenic areas within the submucosal layer, indicative of edema (white asterisks). A heterogeneous, hypoechoic collection (white arrows) surrounds the appendix, which is suggestive of perforation. C. Transverse color Doppler sonography of the inflamed appendix reveals mural hyperemia (white arrows) and hypervascularity along the periphery of the periappendiceal fluid collection (black arrows).
Colitis and Colon Cancer
Clinical presentation
The typical presentation of inflammatory bowel disease includes bloody diarrhea, colicky abdominal pain, tenesmus, and fatigue. Physical examination reveals abdominal tenderness to palpation along with fever [7]. Fulminant colitis and toxic megacolon are suggested by continuous bleeding, abdominal pain, and signs of systemic toxicity [8]. In comparison, the predominant symptom of infectious colitis is acute diarrhea, which may be watery or contain mucus and blood. Ischemic colitis typically presents with rectal bleeding and abdominal pain.
Patients with colon cancer may represent emergent cases, with symptoms such as intestinal obstruction, perforation, or acute non-profound gastrointestinal bleeding. These manifestations display incidence rates of 8%- 20%, 3%- 10%, and 2.3%, respectively. Typically, the patient’s history reveals a recent onset of hematochezia, iron deficiency anemia, and/or changes in bowel patterns.
Imaging
Although CT is considered the modality of choice, US is recognized as a first-line modality for the initial diagnosis of colitis when performed by experienced practitioners. For initial imaging investigations, it is crucial to accurately characterize US abnormalities associated with colitis, as this can assist in diagnosis or inform the selection of the most appropriate CT protocol.
Crohn disease is characterized by moderate wall thickening, with a cutoff of 4 mm displaying high specificity. Wall hypervascularization and mesenteric hypertrophy are indicative of disease activity [9]. Involvement of the appendix in Crohn disease may mimic acute appendicitis; however, concurrent thickening of the terminal ileum and cecum can help differentiate between the two conditions [9]. Ulcerative colitis typically presents with less extensive bowel thickening than Crohn disease, affecting the mucosa and submucosal layer while usually preserving stratification. In turn, pseudomembranous colitis exhibits more pronounced wall thickening than inflammatory bowel disease. This thickening consists of two layers: a thick echogenic inner layer of redundant mucosa stemming from edema and pseudomembranous formation, and an outer hypoechoic layer corresponding to the muscularis propria (Fig. 8) [10]. Ischemic colitis generally affects the left colon and causes segmental wall thickening. Stratification is commonly preserved, but a hypoechoic pattern may be observed (Fig. 9).

Pseudomembranous colitis in a 74-year-old man.
Sonographic image along the long axis of the distal descending colon shows mural thickening, with a thick inner layer of medium echogenicity representing redundant mucosa (asterisks) and a thin hypoechoic outer layer corresponding to the muscularis propria (black arrows). The effacement of the bowel lumen is also noted (white arrows). B. A schematic representation of image A illustrates the hypertrophied mucosal layer within the mural colonic layers.

Ischemic colitis in a 78-year-old woman.
A. Sonographic image through the short axis of the descending colon reveals mural thickening characterized by a hypoechoic pattern and loss of stratification, indicative of submucosal edema (asterisks) affecting a 20-cm segment. The image also shows a narrowed bowel lumen (white arrows). B. A schematic representation of image A illustrates submucosal edema within the mural colonic layers. C. Axial contrastenhanced computed tomography image demonstrates circumferential wall thickening of the descending colon, extending from the splenic flexure to the rectosigmoid junction. A low-density ring of submucosal edema (asterisks) is visible between the enhancing mucosa (arrowhead) and serosa (white arrows), accompanied by pericolic fat stranding (open arrows).
Colorectal cancer typically presents as a bulky, often lobulated mass with an intra- or extraluminal location, or as segmental, eccentric, or circumferential mural thickening (Figs. 10, 11). The irregular contour and hypoechoic wall pattern represent features that help differentiate carcinoma from colitis.

Sigmoid cancer in a 69-year-old man.
A. Transverse sonographic image at the left lower quadrant depicts asymmetric mural thickening of the sigmoid colon (black arrows) with hypoechoic echogenicity. This finding is characterized by an irregular and lobulated contour, along with narrowing of the lumen (white arrows). B. Sonographic image taken with a high-frequency linear-array transducer at a more distal level reveals the irregular contour of the lesion as well as prominent lobulations (black arrows) and evidence of internal vascularity. C. Corresponding axial contrast-enhanced computed tomography image confirms segmental wall thickening of the sigmoid colon (black arrows), featuring a lobulated contour and luminal narrowing.
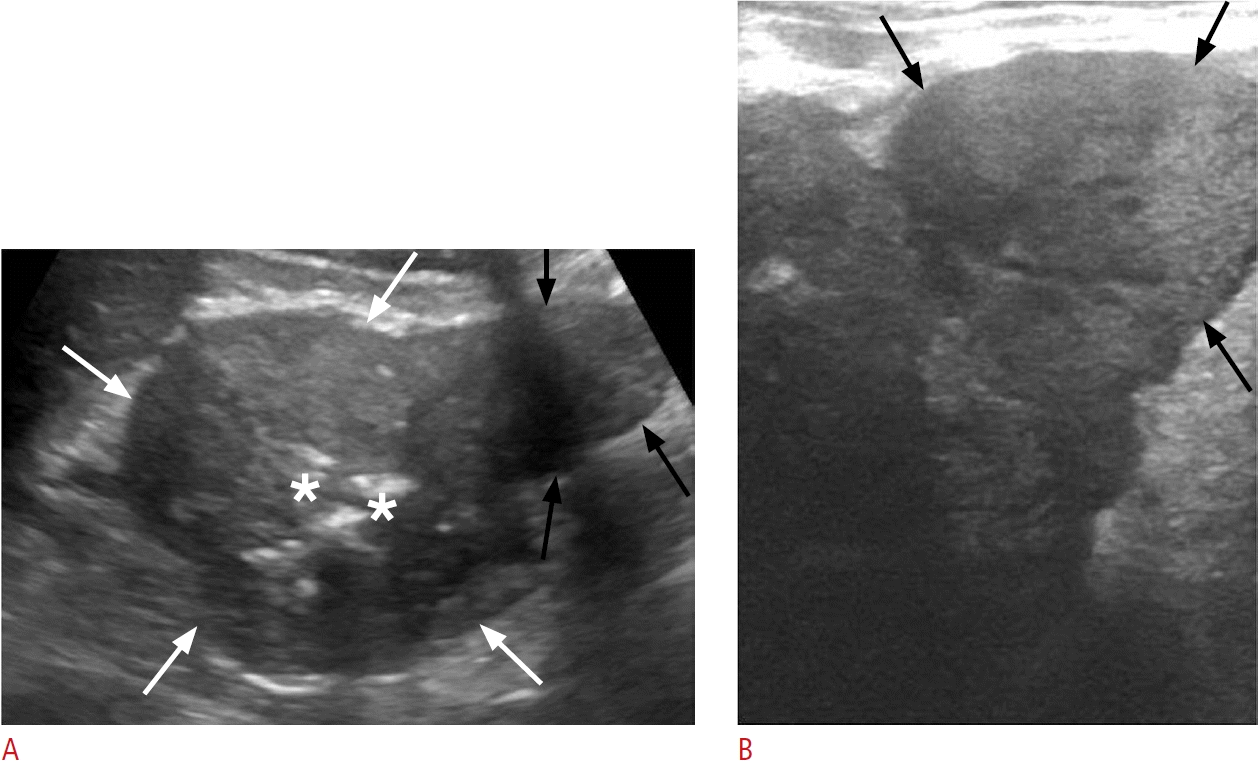
Left colonic cancer in a 72-year-old man.
A. Transverse sonographic image at the mid-descending colon reveals marked hypoechoic mural thickening with a lobulated contour (white arrows), causing narrowing of the lumen (asterisks), and a mass-like projection extending beyond the bowel wall (black arrows). B. Highresolution sonographic image at the same level better demonstrates the irregular contour of the mass-like projection (black arrows).
Epiploic Appendagitis
Clinical presentation
Epiploic appendagitis is a self-limiting condition resulting from the ischemic infarction of a long epiploic appendage, leading to localized LAP that can mimic acute diverticulitis or appendicitis [11]. The typical absence of rebound tenderness may help differentiate between these conditions.
Imaging
While CT is the preferred method for diagnosing epiploic appendagitis, US not only reveals indicative findings in certain cases but also has the benefit of correlating the lesion’s location with the point of maximum tenderness.
US typically reveals an avascular, ovoid, hyperechoic mass measuring 2-4 cm that is adherent to the anterior colonic wall. This mass is encased by a hypoechoic layer that corresponds to a thickened serosal/peritoneal covering (Fig. 12). The absence of bowel wall thickening, central blood flow, and ascites assists in differentiating epiploic appendagitis from acute diverticulitis [12].
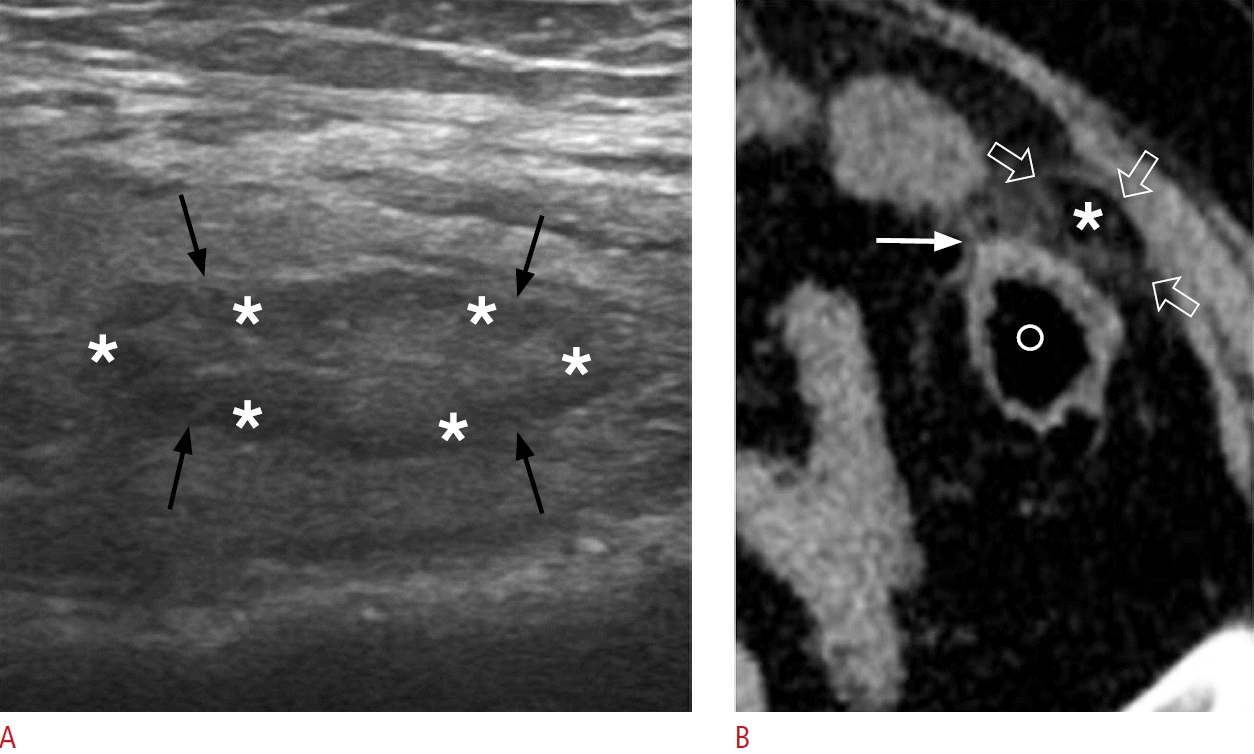
Epiploic appendagitis in a 58-year-old woman.
A. Sonographic image at the site of maximal tenderness in the left lower quadrant reveals an ovoid, hyperechoic lesion (black arrows) surrounded by a hypoechoic halo (asterisks). B. Corresponding axial non-enhanced computed tomography image displays a fat-density ovoid structure (asterisk) adjacent to the descending colon (labeled with "o"), surrounded by a thin hyperdense rim (open arrows) and perilesional inflammatory fat stranding (white arrow).
Genitourinary Disorders
Testicular Torsion
Clinical presentation
Testicular ischemia resulting from torsion of the testis on the spermatic cord can arise due to arterial flow obstruction or venous congestion. This condition typically presents with acute scrotal pain, diffuse tenderness, and a negative cremasteric reflex, which are often accompanied by nausea and vomiting. Notably, in 22% of adolescent patients, the sole presenting symptom is ipsilateral LAP [13]. Testicular torsion is most common among individuals between the ages of 12 and 18 years. The optimal window for detorsion, known as the "golden time," is the 4-6 hours following the onset of symptoms.
Imaging
Color Doppler US is the preferred imaging method for suspected testicular torsion. A side-by-side comparison of the testicles is essential to assess differences in size, echogenicity, and color Doppler signals. Testicular enlargement is an early sign; this may present with either a homogeneous echotexture or a heterogeneously hypoechoic pattern, indicating a potentially viable testis or ischemia, respectively [14]. Notably, in the initial stages of testicular torsion, the echogenicity of the affected testis may appear normal. The diagnosis of torsion is supported by the absence or marked reduction of blood flow (Fig. 13). In addition, compensatory increased vascularity may be evident in the scrotal wall, and the whirlpool sign, which indicates a spiral twist of the spermatic cord components, may sometimes be observed cephalad to the testis.

Testicular torsion in a 32-year-old man who presented with left lower quadrant pain for the prior 2 days.
A. Sonographic image of both testes demonstrates diffuse hypoechogenicity and absent blood flow on color Doppler in the left testis (on the left side of the image) compared to the normal contralateral testis (right side). B. Sonographic image of the left testis shows peripheral blood flow (white arrows) on power Doppler, suggesting neovascularization due to the recruitment of peripheral collateral vessels. Note the presence of concomitant complex hydrocele (asterisks).
Acute Epididymo-orchitis
Clinical presentation
Acute epididymo-orchitis is the most common cause of scrotal pain in adults. Although it typically results from infection, trauma or autoimmune diseases can also be causative factors. The affected epididymis is edematous and painful on palpation. In more advanced cases, the testis may become involved, leading to testicular pain and swelling.
Imaging
In the acute setting, epididymo-orchitis is characterized by the thickening, enlargement, and hypoechogenicity or coarse echotexture of the epididymis, with initial involvement typically occurring at the tail. Testicular involvement is generally indicated by diffuse hypoechogenicity, although it presents with a focal pattern in approximately 10% of patients. Color Doppler imaging typically reveals testicular and/or epididymal hypervascularity relative to the asymptomatic side (Fig. 14). Reactive hydrocele and skin thickening are also common findings.
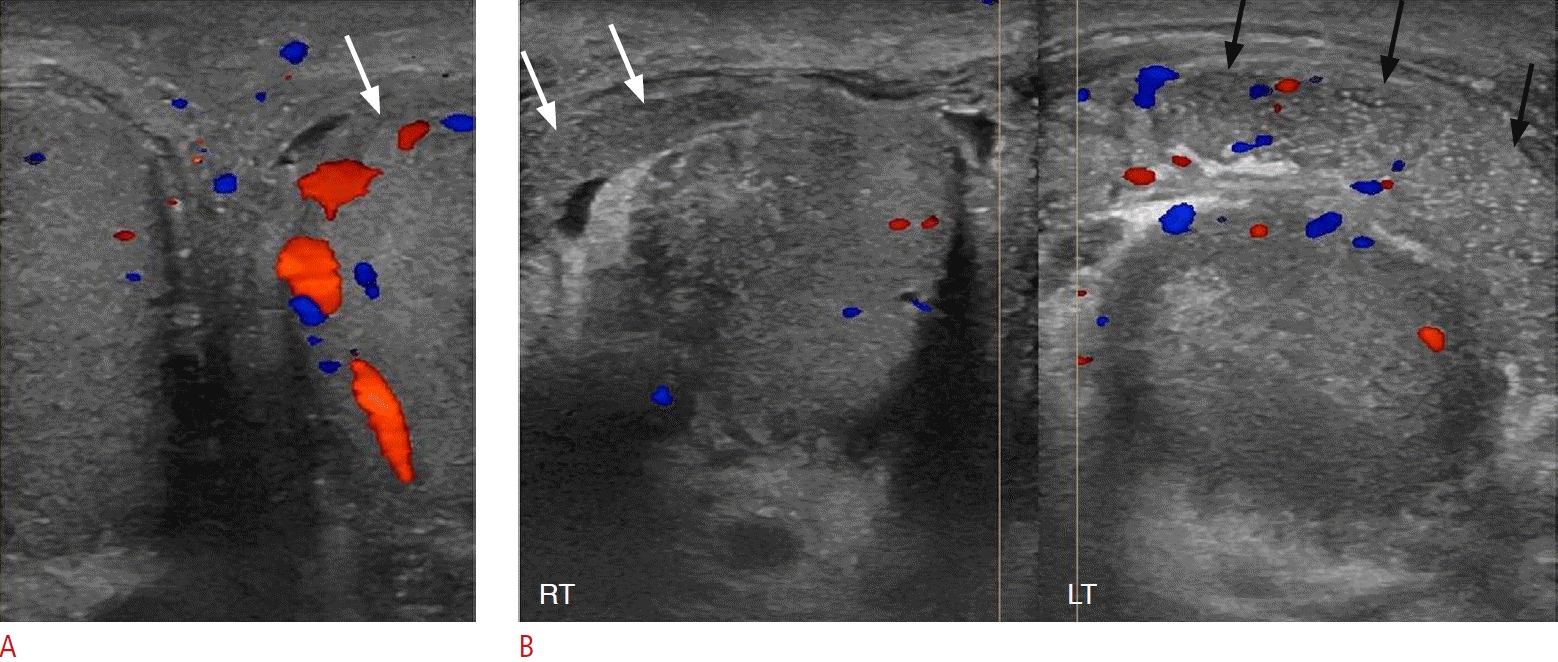
Acute left epididymo-orchitis in a 56-year-old man.
A. Sonographic side-by-side comparison of the right and left testes shows increased vascularity in the left testis (arrow) compared to the normal contralateral testis. B. Sonographic side-by-side comparison of the right and left epididymides shows enlargement, coarse echotexture, and hypervascularity of the left epididymis (black arrows) compared with the right epididymis (white arrows).
Urolithiasis
Clinical presentation
Urolithiasis can lead to renal colic in cases of acute obstruction of the ureter or renal pelvis. Patients typically report sudden, intense flank pain that radiates to the ipsilateral abdomen and groin, frequently accompanied by hematuria. The site of the pain can suggest the level of obstruction. Additional symptoms include nausea, vomiting, and dysuria [7].
Imaging
Although non-contrast CT is the preferred initial imaging method for urolithiasis, US may also be utilized, particularly for pregnant patients. If the initial findings are inconclusive, further evaluation with contrast-enhanced CT is recommended [5].
US can detect calculi of 5 mm or larger, which appear as echogenic foci that cause acoustic shadowing and may produce a "twinkle" artifact on color Doppler. However, the sensitivity of US in detecting urinary stones, particularly those located in the ureters, is lower than that of CT. Additionally, US is more limited in estimating stone size compared to CT, often resulting in an overestimation of the stone’s dimensions. US can reveal obstruction with accuracy comparable to CT, characterized by dilatation of the collecting system and ureter up to the level of the calculus (Fig. 15).

Two cases of urolithiasis.
A. Urolithiasis in a 40-year-old man is shown. Sonographic image of the left lower abdomen reveals dilatation of the left ureter (black arrows) extending to a hyperechoic calculus (white arrows), which causes acoustic shadowing and a "twinkle" artifact (white arrowheads) on color Doppler examination. B. Urolithiasis in a 42-year-old man is shown. Sonographic image of the lower abdomen displays a mildly echogenic calculus at the right ureterovesical junction (black arrow), accompanied by dilatation of the right distal ureter (white arrows). The urinary bladder is indicated by the asterisk. C. Sonographic image through the long axis of the right kidney in the same patient as in image B shows hydronephrosis (asterisk) and an echogenic calculus (arrow), with associated acoustic shadowing (arrowheads) distal to the ureteropelvic junction.
Acute Pyelonephritis
Clinical presentation
The diagnosis of acute pyelonephritis is primarily based on clinical findings. Typical clinical features include fever, nausea, and/or vomiting, and symptoms of cystitis may also be present. Atypical cases may present with LAP. Physical examination often reveals tenderness in the flank, costovertebral angle, or suprapubic area, but without rebound tenderness or abnormal bowel sounds [15].
Imaging
Contrast-enhanced CT is the preferred method for evaluating suspected pyelonephritis, particularly in cases with atypical clinical findings or when differential diagnosis is challenging. While US is less sensitive, with prior research indicating that it detected abnormalities in only approximately 25% of patients, this modality resembles CT in the key features it can be used to identify. These include wedge-shaped parenchymal areas with reduced vascularity and abnormal echogenicity, which may be hypoechoic or hyperechoic, corresponding to edema or hemorrhage, respectively. US may also detect the loss of renal sinus fat, hydronephrosis, or abscess formation (Fig. 16) [16].
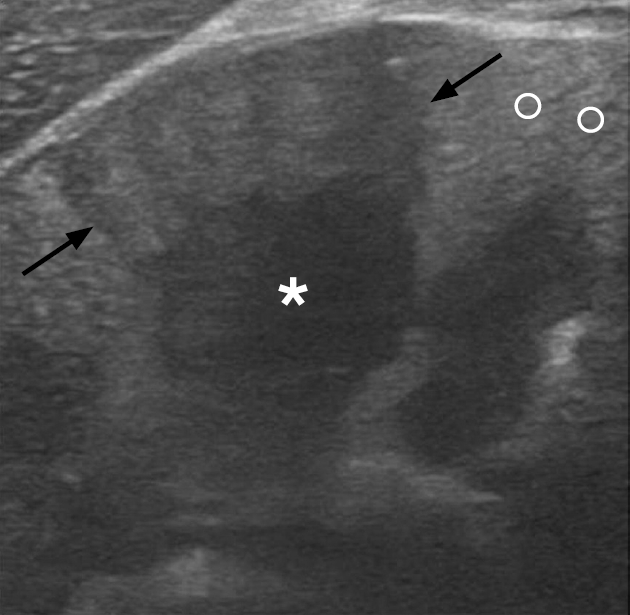
Acute pyelonephritis in a 32-year-old woman.
A focused sonographic image of the upper pole of the left kidney reveals a wedge-shaped, hypoechoic area relative to the normal cortex (labeled with "o"), involving the renal parenchyma (black arrows) and situated superficial to the medullary pyramid (asterisk).
Obstetric/Gynecologic Disorders
Ovarian Cysts
Clinical presentation
Ovarian cysts larger than 4 cm can cause unilateral, sharp, intermittent, and sudden pain in the lower quadrant, potentially accompanied by tenesmus or radiating to the ipsilateral leg [17]. Ovarian cyst rupture is indicated by moderate to severe pelvic pain, typically arising suddenly following strenuous physical activity; other signs include vaginal bleeding and nausea. The presence of generalized tenderness and hypovolemia should raise the suspicion of massive intraperitoneal hemorrhage.
Imaging
Combined pelvic transabdominal and transvaginal US is the most valuable initial imaging technique for suspected obstetric and gynecologic disorders. In cases of uncertain diagnosis, particularly regarding conditions such as ovarian torsion, pelvic inflammatory disease, and tubo-ovarian abscess, contrast-enhanced CT and magnetic resonance imaging serve as secondary diagnostic tools.
Follicular cysts appear as thin-walled, most commonly unilocular, anechoic cysts measuring 3-6 cm (Fig. 17A) [17]. Corpus luteal cysts, which are functional cysts that form when the corpus luteum fails to regress, present as thick-walled structures with prominent peripheral vascularization (Fig. 17B). Hemorrhagic cysts initially appear isoechoic relative to the ovarian stroma, but as clotting occurs, a distinctive "lace-like" reticular pattern emerges (Fig. 17C, D). Common findings include a fluid-debris level or the appearance of a peripheral clot that may mimic a nodule. The absence of internal vascularity is a useful feature for ruling out solid ovarian lesions. Collapse of the cyst, along with the presence of intraperitoneal fluid containing low-level echoes, indicates cyst rupture (Fig. 18) [17]. Endometriomas are characterized by their homogeneous, low-level echogenicity and tend to be multiple and stable over time (Fig. 19).
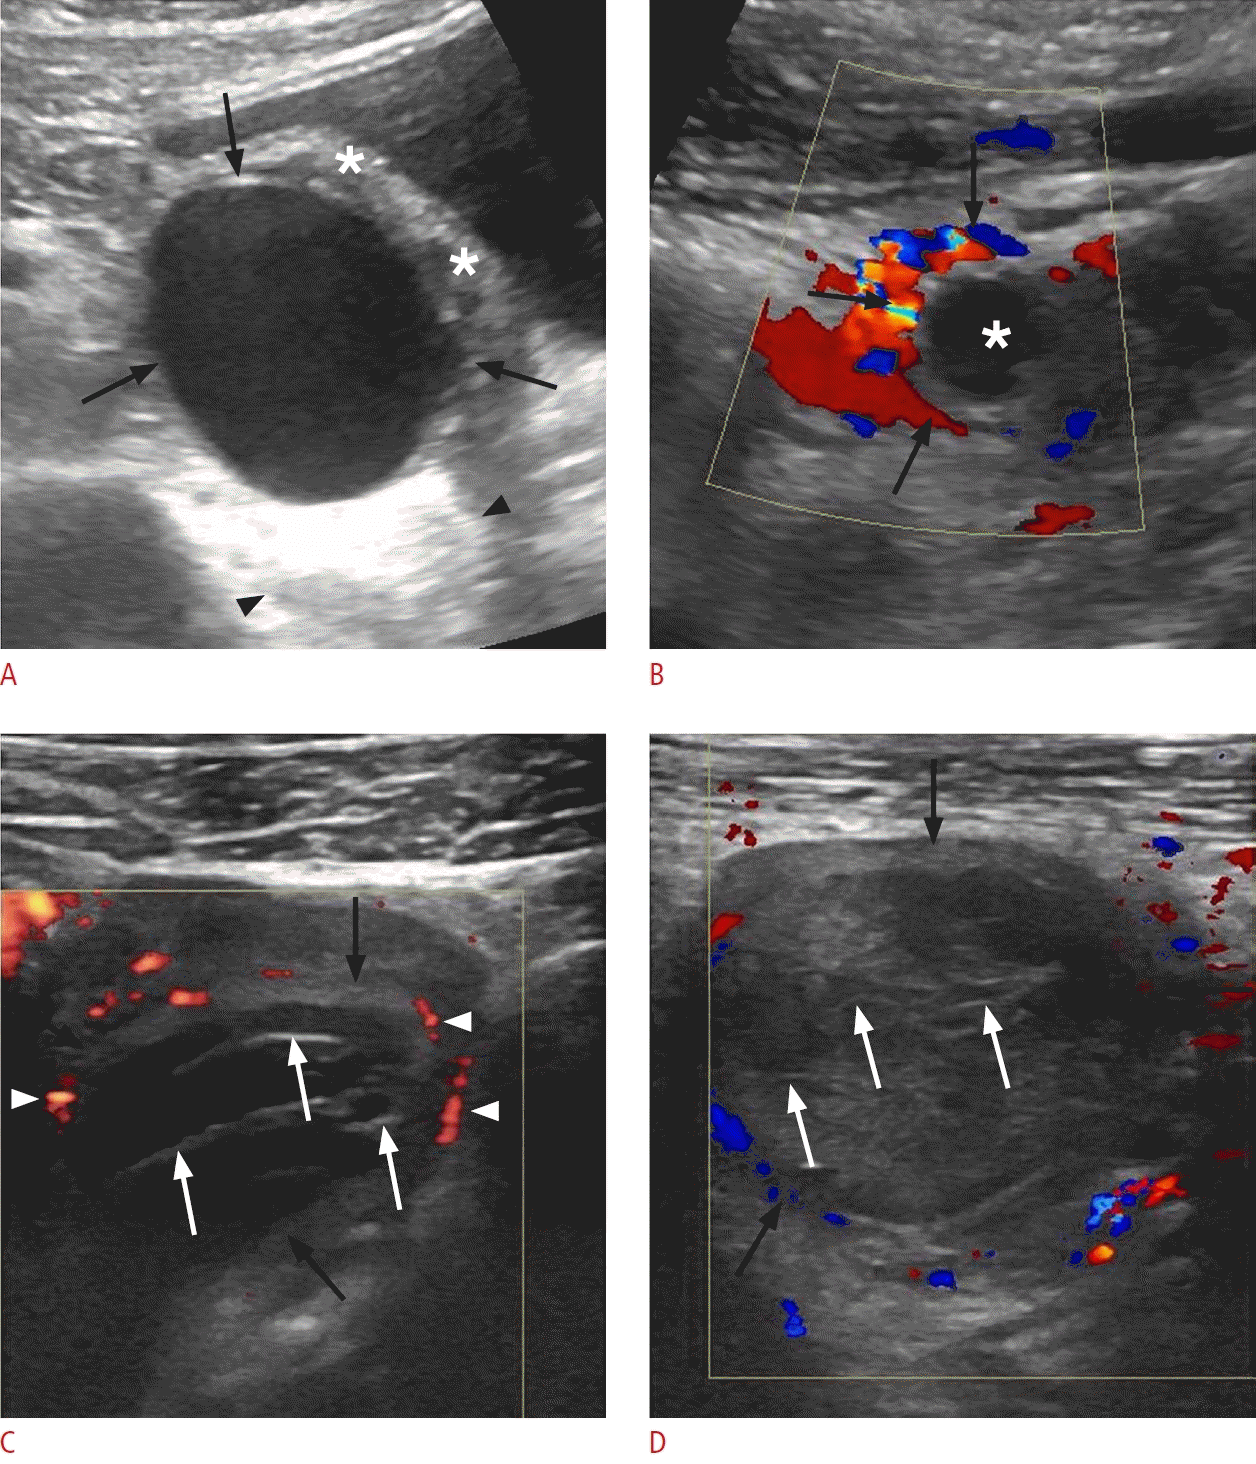
Different types of ovarian cysts in patients presenting with acute lower abdominal pain.
A. Follicular cyst in a 25-year-old woman is shown. A sonographic image of the left lower quadrant displays a thin-walled, unilocular, anechoic cyst (black arrows) with posterior acoustic enhancement (located between arrowheads) originating from the left ovary (asterisks). B. Corpus luteal cyst in a 29-year-old woman is shown. Sonographic image of the lower abdomen reveals a thick-walled cyst (asterisk) with prominent peripheral vascularization (black arrows). C. Hemorrhagic ovarian cyst in a 21-year-old woman is shown. Sonographic image reveals a well-defined cystic lesion (black arrows) with "lace-like" reticular contents, consisting of multiple thin septations (white arrows), and displaying prominent peripheral vascularity (arrowheads). D. Hemorrhagic ovarian cyst in a 32-year-old woman is shown. Sonographic image reveals a thin-walled, complex cystic lesion (black arrows) with echogenic reticular internal septations (white arrows). Color Doppler imaging revealed no internal vascularity.
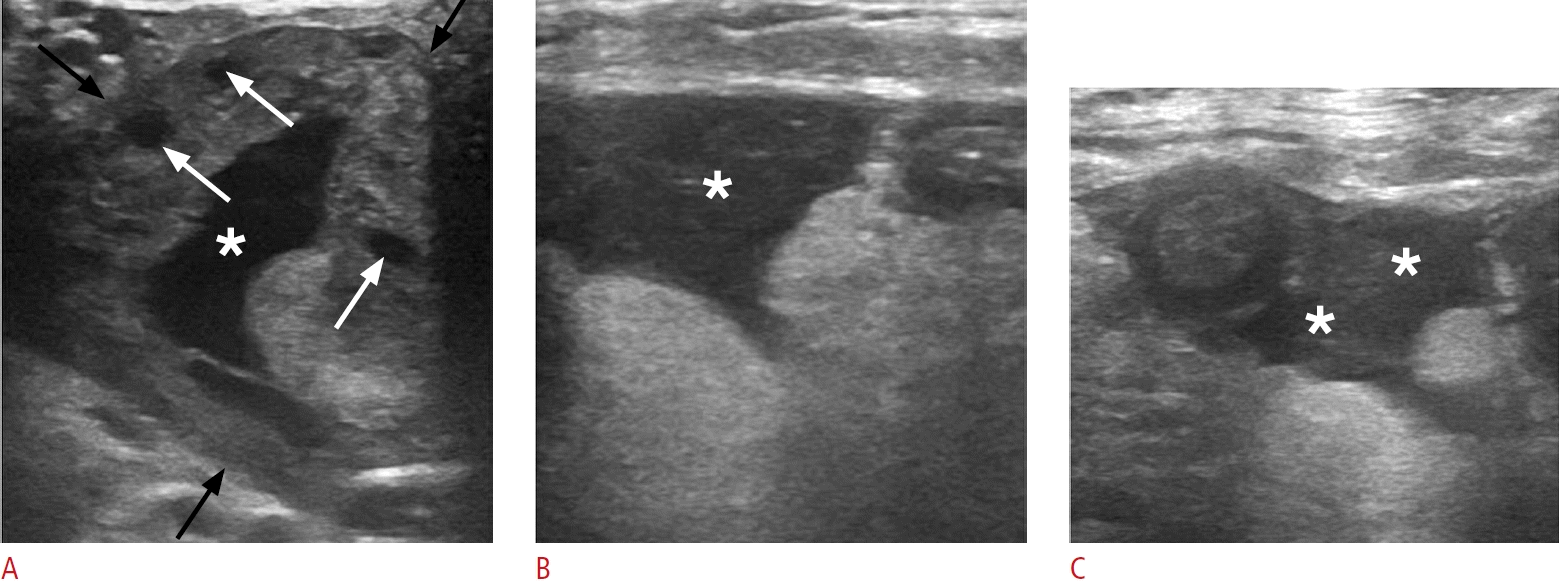
Ruptured hemorrhagic ovarian cyst in a 35-year-old woman presenting with acute left lower quadrant pain.
A. Sonographic image of the left lower abdomen reveals an enlarged left ovary (black arrows) with a well-defined cystic lesion (asterisk) featuring an irregular, collapsed wall. Note the presence of normal follicles (white arrows). B, C. The concomitant presence of intraperitoneal fluid with low-level echoes encircling small bowel loops (asterisks) suggests a hemoperitoneum resulting from cyst rupture.
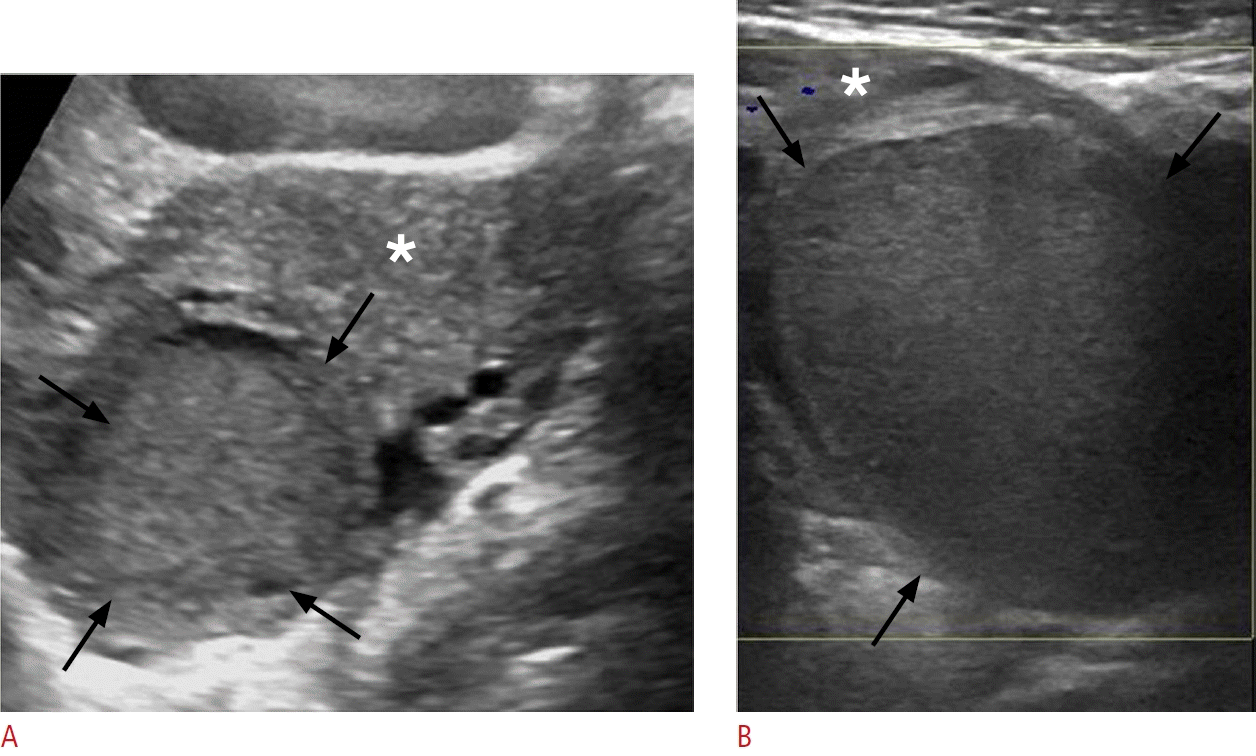
Ovarian endometriomas in 27-year-old and 32-year-old women with a history of endometriosis presenting with left lower abdominal pain.
A. Sonographic image of the left lower quadrant reveals a well-defined lesion (black arrows) arising from the left ovary (asterisk) and containing uniform, low-level internal echoes. B. A sharply defined lesion with homogeneous internal content and low-level echoes (black arrows) nearly occupies the left ovarian stroma (asterisk).
Ovarian Torsion
Clinical presentation
The most common symptom of ovarian torsion, also termed "adnexal torsion" when the fallopian tube is involved, is the sudden onset of moderate to severe pain in the lower quadrant [18]. Patients with ovarian torsion experience nausea and vomiting more frequently than those with other gynecologic causes of pelvic pain. Furthermore, the presence of an ovarian mass increases the likelihood of ovarian torsion.
Imaging
Ovarian enlargement with peripherally located follicles is the most consistent finding indicative of torsion (Fig. 20). Stromal echogenicity may vary based on the duration of the condition, and an ovarian tumor that predisposes to torsion can sometimes be detected. The characteristics observed on color Doppler imaging depend on the extent of vascular compromise. The most sensitive of the early signs is a reduction or absence of venous flow, whereas arterial flow tends to be affected in more advanced stages [19,20]. The presence of free pelvic fluid is a common associated finding.

Ovarian torsion in a 34-year-old woman.
A. Sonographic image of the left lower quadrant reveals a markedly enlarged left ovary with heterogeneous internal echogenicity (black arrows) and free fluid in the cul-de-sac (asterisk). B. A high-frequency transducer provided a focused image of the lesion, displaying peripherally located follicles (asterisks) and minimal stromal vascularity (white arrow), with an arterial waveform present (not shown). Venous flow was not detected.
Ectopic Pregnancy
Clinical presentation
Typical symptoms of ectopic pregnancy include vaginal bleeding and/or abdominal pain. The characteristics of the pain can vary depending on the site of implantation and the volume of hemoperitoneum, presenting as suprapubic, lateralized, or generalized pain. In rare instances, profound hemorrhage can lead to hemodynamic instability. Beta-human chorionic gonadotropin (β-hCG) levels serve as an important marker for ectopic pregnancy. Although women with an ectopic pregnancy typically exhibit lower β-hCG levels than those with intrauterine pregnancy, these ranges display considerable overlap. When ectopic pregnancy is strongly suspected, serial measurement of β-hCG concentrations may be useful while the diagnosis remains uncertain.
Imaging
Ovarian ectopic pregnancy most commonly manifests as a thick-walled adnexal cyst with a hypervascular rim (Fig. 21) [19,20]. Tubular ectopic pregnancy typically presents as a complex, extra-adnexal cyst or mass-like lesion. The presence of a thick, echogenic endometrium within the uterine cavity, coupled with the absence of an intrauterine pregnancy, are consistent findings.
Less Common Causes
Iliopsoas Bursitis
Clinical presentation
Iliopsoas bursitis typically causes pain in the anteromedial thigh, which can radiate to the leg and lower back and is often provoked by activity. In atypical cases, patients may experience pain in the lower quadrant.
Imaging
US should be the initial imaging modality performed in cases of suspected iliopsoas bursitis, followed by magnetic resonance imaging for further characterization when necessary. US is superior to CT in determining the nature of the bursal contents.
Iliopsoas bursitis is characterized by a well-defined, thin-walled, echo-free collection that is either heterogeneous or septated, situated along the iliopsoas tendon. A crucial imaging characteristic is the demonstration of a connection between the bursa and the hip joint (Fig. 22).

Hemorrhagic iliopsoas bursitis in a 63-year-old man.
A. Sonographic image at the level of the left lower quadrant shows a well-defined fluid-filled collection (black arrows) with internal lowlevel echoes, indicative of a distended iliopsoas bursa. B. Sonographic image at a more distal level than image A again demonstrates the bursa situated anterior to the femoral head (FH), containing hyperechoic material (asterisk). Note the communication between the bursa and the left hip joint (black arrow). C. Corresponding axial contrast-enhanced computed tomography image reveals the distended bursa (open arrows) with internal high-attenuating hemorrhagic material (asterisk). The hyperdense content exhibited high attenuation on the scan prior to intravenous contrast administration (not shown). D. The bursa is depicted at its expected anatomical location anterior to the left hip, in communication with the joint (black arrow).
Spontaneous Retroperitoneal Hematoma
Clinical presentation
Patients with spontaneous retroperitoneal hematoma typically present with symptoms such as abdominal pain, anemia, or hypovolemia. The presence of the Grey Turner sign, characterized by ecchymosis or discoloration of the flanks, and the Cullen sign, which represents periumbilical ecchymosis, can aid in the diagnosis.
Imaging
CT angiography is the recommended imaging modality for determining the cause of retroperitoneal hemorrhage and investigating active extravasation. Depending on patient body habitus, ultrasound may detect retroperitoneal fluid if it is located in US-accessible areas, such as the posterior renal space or behind the external iliac vessels (Fig. 23).
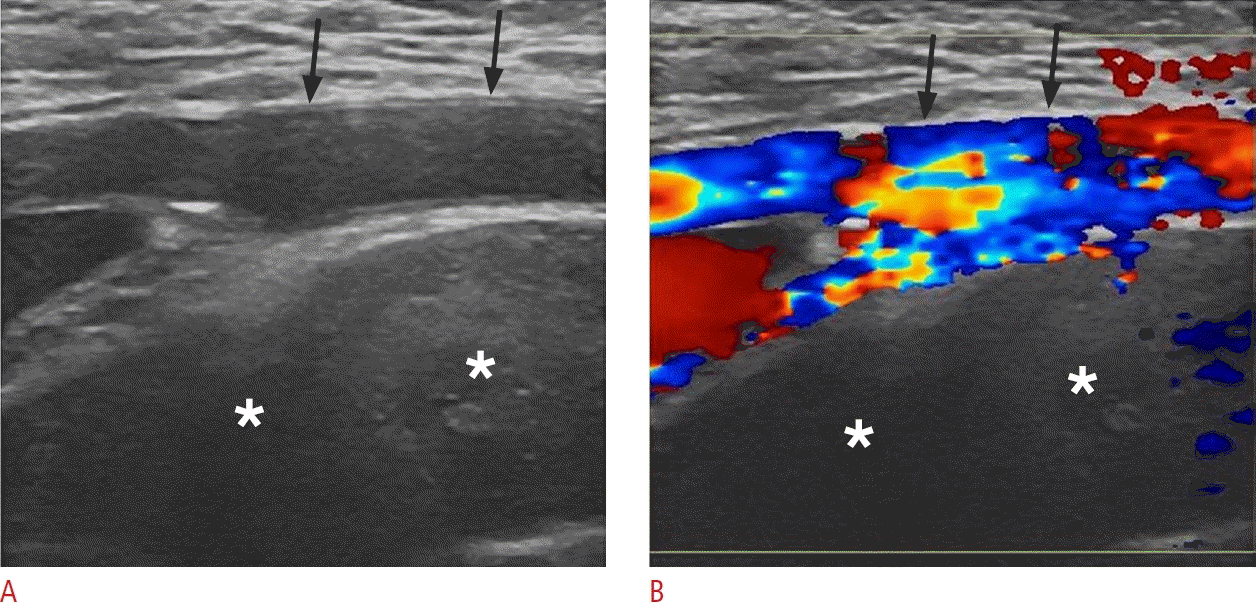
Spontaneous retroperitoneal hemorrhage in a 65-year-old man.
A, B. Sonographic images of the left lower quadrant reveal an extensive heterogeneous fluid collection (asterisks), without internal vascularity, situated deep to the external iliac artery (black arrows). This location is sonographically accessible for the evaluation of the retroperitoneum.
Rectus Sheath Hematoma
Clinical presentation
The typical symptoms of rectus sheath hematoma (RSH) include acute, lateralized abdominal pain and a palpable abdominal mass. Physical examination often reveals abdominal tenderness and guarding. The tenderness does not change when the patient sits up from the supine position, a phenomenon known as the Carnett sign. Additionally, the palpable mass is bounded medially by the midline, which is referred to as the Fothergill sign.
Imaging
Typical features of RSH include heterogeneity in the rectus abdominis muscle and fluid collection that may be homogeneous or heterogeneous, depending on the stage of hematoma evolution. This fluid collection is confined to the abdominal wall (Fig. 24).
Conclusion
Elucidating the numerous causes of LAP remains a challenging task that requires a high degree of clinical suspicion. A thorough physical examination, typically accompanied by imaging evaluation, is essential for prompt patient work-up. US plays a pivotal role, particularly as a first-line imaging modality, while CT primarily serves as a problem-solving tool. Awareness of the imaging algorithm and familiarity with the appearances of entities associated with LAP are important for accurate diagnosis.
Notes
Author Contributions
Conceptualization: Perysinakis I, Vassalou EE. Data acquisition: Perysinakis I, Vassalou EE. Data analysis or interpretation: Perysinakis I, Vassalou EE. Drafting of the manuscript: Perysinakis I, Vassalou EE. Critical revision of the manuscript: Perysinakis I, Vassalou EE. Approval of the final version of the manuscript: all authors.
No potential conflict of interest relevant to this article was reported.
References
Article information Continued
Notes
Key point
Lower abdominal pain has a broad differential diagnosis. Ultrasonography is a first-line imaging modality for clinically suspected acute appendicitis, acute diverticulitis, and obstetrical/gynecologic as well as genitourinary disorders. Ultrasonography can complement clinical examination in clarifying the underlying causes of lower abdominal pain.

