Logistic LASSO regression for the diagnosis of breast cancer using clinical demographic data and the BI-RADS lexicon for ultrasonography
Article information

Abstract
Purpose
The aim of this study was to compare the performance of image analysis for predicting breast cancer using two distinct regression models and to evaluate the usefulness of incorporating clinical and demographic data (CDD) into the image analysis in order to improve the diagnosis of breast cancer.
Methods
This study included 139 solid masses from 139 patients who underwent a ultrasonography-guided core biopsy and had available CDD between June 2009 and April 2010. Three breast radiologists retrospectively reviewed 139 breast masses and described each lesion using the Breast Imaging Reporting and Data System (BI-RADS) lexicon. We applied and compared two regression methods-stepwise logistic (SL) regression and logistic least absolute shrinkage and selection operator (LASSO) regression-in which the BI-RADS descriptors and CDD were used as covariates. We investigated the performances of these regression methods and the agreement of radiologists in terms of test misclassification error and the area under the curve (AUC) of the tests.
Results
Logistic LASSO regression was superior (P<0.05) to SL regression, regardless of whether CDD was included in the covariates, in terms of test misclassification errors (0.234 vs. 0.253, without CDD; 0.196 vs. 0.258, with CDD) and AUC (0.785 vs. 0.759, without CDD; 0.873 vs. 0.735, with CDD). However, it was inferior (P<0.05) to the agreement of three radiologists in terms of test misclassification errors (0.234 vs. 0.168, without CDD; 0.196 vs. 0.088, with CDD) and the AUC without CDD (0.785 vs. 0.844, P<0.001), but was comparable to the AUC with CDD (0.873 vs. 0.880, P=0.141).
Conclusion
Logistic LASSO regression based on BI-RADS descriptors and CDD showed better performance than SL in predicting the presence of breast cancer. The use of CDD as a supplement to the BI-RADS descriptors significantly improved the prediction of breast cancer using logistic LASSO regression.
Introduction
Diagnosing breast cancer at an early stage has long been a goal of breast cancer screening. One of the challenges of screening is the substantial performance variability among radiologists, which results in suboptimal sensitivity and specificity [1]. The Breast Imaging Reporting and Data System (BI-RADS) atlas was developed by the American College of Radiology to improve communication among physicians and to facilitate standardized breast imaging reporting, including reports of ultrasonography (US) findings, the organization of reports, and a classification system [2]. To improve diagnostic performance, several reports have used statistical approaches, such as logistic regression and artificial neural networks employing BI-RADS [3-5]. Using statistical approaches is generally beneficial and improves the diagnosis of breast cancer, not only with BI-RADS, but also with the clinical and demographic data (CDD) regarding patients’ demographic risk factors [5].
Regression procedures suffer from overfitting when a large number of covariates are included; in such circumstances, a regression model fits the training data well, but it does not generalize well to real-world cases. Variable selection is necessary in order to obtain more accurate predictions with a large number of covariates, such as BI-RADS descriptors and CDD. It is well known that standard stepwise selection approaches are not optimal for regression models with numerous covariates [6]. Alternatively, sparse penalized approaches, such as the least absolute shrinkage and selection operator (LASSO), have received much attention [7]. LASSO is a penalized regression approach that estimates the regression coefficients by maximizing the log-likelihood function (or the sum of squared residuals) with the constraint that the sum of the absolute values of the regression coefficients,
The aim of this study was to compare the performance of image analysis for predicting breast cancer depending on whether logistic LASSO regression or stepwise logistic (SL) regression was used, and to evaluate the usefulness of incorporating CDD into the image analysis in order to improve the diagnosis of breast cancer.
Materials and Methods
Patients
This retrospective review of ultrasonographic images and medical records was approved by the Institutional Review Board of our institution. The requirement for informed patient consent was waived.
A computerized search of the electronic medical records, including CDD and ultrasonographic and surgical findings was performed in order to identify pathologically confirmed ultrasonographic breast masses between June 2009 and April 2010 at our medical center. During that time, US-guided percutaneous needle biopsy was performed in 293 patients, 139 of whom had sonograms (139 solid masses) and available CDD that were encoded and stored in the CDD warehouse. The patients ranged in age from 17 to 76 years (mean age, 47.0 years) (Table 1). All the masses had a known diagnosis based on a US-guided core biopsy. Forty-nine lesions (35.3%) were confirmed as malignant and 90 lesions (64.7%) were benign. Surgery was performed on all malignant masses. All benign lesions were followed up (range, 24 to 86 months; mean, 45 months).
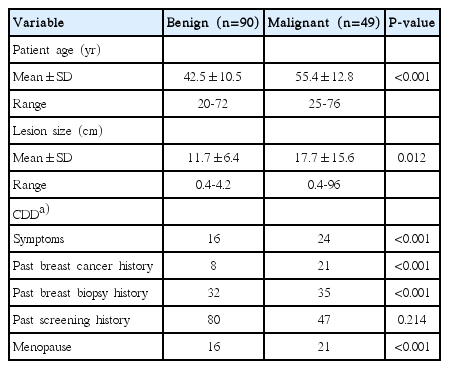
Characteristics of patients and lesions
Assessment of US Findings
US was performed in the transverse (axial) and longitudinal (sagittal) planes using a HDI 5000 or iU22 ultrasound scanner (Philips-Advanced Technology Laboratories, Bothell, WA, USA) equipped with a 5-12 MHz linear array transducer. The most experienced breast radiologist selected the transverse and longitudinal images from each case on a picture archiving and communication system and converted the images into TIFF files with 300 dpi. All TIFF files were arranged in an arbitrary order.
Three subspecialty-trained breast radiologists with 10, 5, and 3 years of experience, respectively, performed a retrospective review of all the images. All three investigators were familiar with the use of ultrasonographic BI-RADS descriptors in their daily work, and no formal training for the descriptions was required in this study. At first all observers performed an independent review of all 139 images without knowledge of the clinical information, mammographic findings, and pathologic results of each case, or the ratio of the incidence of malignant to benign lesions. All observers described each lesion using the BI-RADS lexicon given in Table 2 [2]. Among the seven categories, the categories of 0 (incomplete assessment), 1 (normal), and 6 (biopsy-proven malignancy) were excluded from this study. After 1 month, each lesion was re-evaluated using BI-RADS, based on the consensus of three radiologists. After another month, each lesion was re-evaluated with CDD, based on the consensus of three radiologists. The first set of data were used for regression model analysis. The second and third sets of data were used to compare the radiologists’ performance.
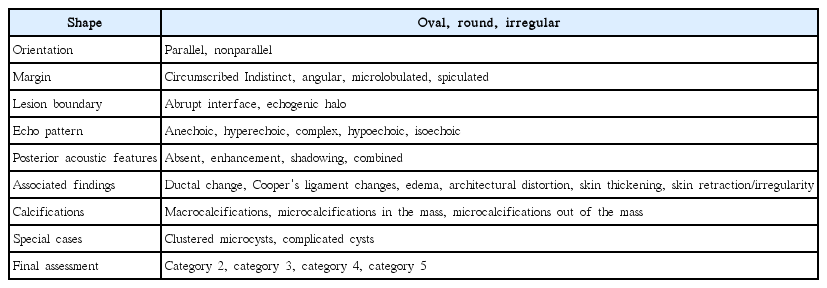
BI-RADS descriptors for breast ultrasonography
Extraction of Clinical Information
The medical records from the patients’ initial visits for breast disease included age, symptoms, the size of the lesion on US, and other details; these are presented in Table 3. A database was constructed and incorporated into the hospital information technology and stored in the CDD warehouse. Data were extracted from CDD warehouse entries via patients’ electronic medical records, and exported into an Excel file.
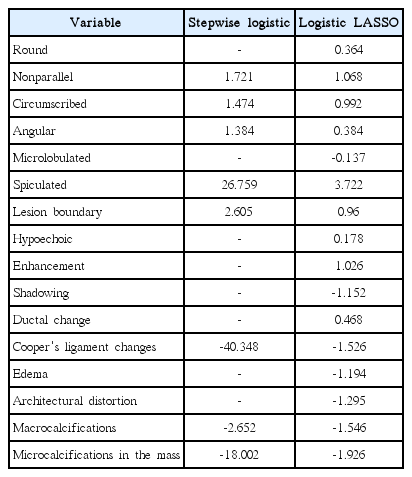
The estimated coefficients in the stepwise logistic regression and logistic LASSO regression with descriptors only
Logistic LASSO Regression
A histologic diagnosis of malignancy for a breast mass was entered as a dependent variable, Y, in the logistic regression model and was coded as 0 for absent (benign) and 1 for present (malignant). The probability of cancer given the covariates xi was calculated as follows:
where xi =(xi1, xi2,…, xik) are covariates of the ith observation and include the BI-RADS lexicon descriptors (Table 2) and CDD variables (Supplementary Table 1). β0 is the intercept and βj (j=1,…,k) is the coefficient corresponding to the jth covariate.
The logistic LASSO estimator
subject to
Statistical Analysis
The responses of the three radiologists for the BI-RADS lexicon descriptors were pooled. For a binary descriptor, if two or more radiologists gave positive responses, the pooled response was considered positive; otherwise, the pooled response was considered negative. For an ordinal descriptor, the pooled response was the median value of the three radiologists' responses. We categorized continuous covariates in the CDD into three or four categories with approximately the same sample sizes.
To assess predictive performance, we randomly divided the 139 sets of data, using stratified sampling, into 99 sets for the training data set (35 malignancies and 64 benign masses) and 40 sets for the test data set (14 malignancies and 26 benign masses). We fit the SL regression and logistic LASSO regression using the training data set only and predicted the malignancy of the test data using the fitted models. For the stepwise selection, we used the Akaike information criterion to select the covariates. For the logistic LASSO regression, we used cross-validation to select λ. We calculated the misclassification error and the area under the receiver operating characteristic curve (AUC) for the test data as measures of the predictive performance of the fitted models. Since the size of the dataset was small, the random split of data had a great influence on prediction performance; therefore, we repeated the random partition 100 times to obtain 100 sets of misclassification errors and AUCs. To investigate the statistical significance of the difference in predictive performance, we applied two statistical tests, the paired t test and the Wilcoxon signed-rank test, based on the 100 differences in predictive performance obtained from the 100 random partitions.
We compared the predictive performance of the stepwise logistic regression, the logistic LASSO regression, and radiologists with descriptors only as covariates, and with descriptors and CDD as covariates. The cutoff value of the probability for classification, which was needed for calculating the test misclassification error, was obtained to minimize misclassification errors in the training data.
Results
Predictive Performance
When using the BI-RADS descriptors only, the logistic LASSO regression was superior to the SL regression in terms of misclassification errors (0.234 vs. 0.253 [mean values], P<0.001 [paired t test, Wilcoxon signed-rank test]) and AUC (0.785 vs. 0.759, P<0.001 [both]). The use of CDD as a supplement to the descriptors significantly improved misclassification errors (0.196 vs. 0.234, P<0.001 [both]) and AUC (0.873 vs. 0.785, P<0.001 [both]) in the logistic LASSO regression (Fig. 1). However, the additional information provided by CDD made the performance of the SL regression worse. This is because the SL regression did not select important covariates. In contrast, the logistic LASSO regression selected and used important covariates among the CDD.

Box plots of the test misclassification errors and AUCs.
The first column used only the BI-RADS descriptors, and the second column used CDD as well. All numbers in the box plots are the corresponding mean values. AUC, area under curve; BI-RADS, Breast Imaging Reporting and Data System; CDD, clinical and demographic data; LASSO, least absolute shrinkage and selection operator; SL, stepwise logistic.
When compared with the agreement of radiologists, the logistic LASSO regression was inferior in terms of test misclassification errors (0.234 vs. 0.168, P<0.001 [both] without CDD; 0.196 vs. 0.088, P<0.001 [both] with CDD) and in terms of the AUC without CDD (0.785 vs. 0.844, P<0.001 [both]) (Fig. 1). However, it was comparable to the AUC with CDD (0.873 vs. 0.880, P=0.165, P=0.141) (Fig. 1).
Variable Selection
Tables 3 and 4 present the covariates selected and their estimated coefficients, using all 139 observations as training data. In Table 4, the estimated coefficients using the SL regression are quite large compared to those using the logistic LASSO regression. This indicates that the SL regression over-fit the present data.

The estimated coefficients in the stepwise logistic regression and logistic LASSO regression with descriptors and clinical demographic data
Covariates whose coefficients are large in terms of their absolute value have a great influence on the diagnosis of breast cancer. Among the covariates within the CDD, the presence of symptoms, history of breast cancer, and history of undergoing breast biopsy were found to be important covariates affecting the accuracy of the diagnosis. Age and size of tumors were also selected for analysis, but their effects were found to be minimal.
Discussion
We have shown that the predictive performance of the logistic LASSO regression for breast cancer diagnosis based on a combination of CDD with BI-RADS descriptors was far better than the performance based only on the BI-RADS descriptors or using SL regression, and was comparable to the agreement of radiologists in terms of AUC. Our results are consistent with many previous studies, which have shown that the accuracy of diagnostic tests may be improved if the reader has prior information from the patients’ clinical history or other tests [6,11]. Merging the CDD into a model with images has a potential to improve physicians’ insights into the diagnosis of a disease. However, the logistic LASSO regression model had a larger misclassification error than the consensus of radiologists. This indicates that it would still be difficult for the regression model developed in this paper to replace the role of radiologists.
Among the BI-RADS descriptors, spiculation turned out to be the most important covariate for diagnosis. This result is comparable to those of previous studies, in which age and margin were found to be statistically significant predictors using an artificial neural network, while the margins and boundaries were found to be significant using SL regression [12,13]. In contrast, among the covariates for CDD, the presence of symptoms, a history of breast cancer, and a history of undergoing breast biopsy were found to be important covariates affecting the accuracy of the diagnosis.
The coefficients estimated using the SL regression were quite large compared to those estimated using the logistic LASSO regression. This is because some covariates are highly unbalanced; hence, complete separation is possible. For example, the covariate of ‘calcifications in the mass’ is a binary covariate, for which only eight observations were positive, all of which were malignant. The inflation of the estimated coefficients of such covariates may be a reason for the poor predictive performance of the SL regression. In contrast, the logistic LASSO regression shrinks such coefficients successively to avoid inflation of the estimated coefficients, which results in superior predictive performance. These results suggest that a certain degree of regularization is indispensable for accurate prediction when the number of covariates is large and/or some covariates are highly unbalanced. Logistic LASSO regression does this successfully.
In logistic LASSO regression, only six descriptors of the BI-RADS lexicon were selected when CDD were included as covariates, while 16 descriptors were selected without CDD. This indicates that the covariates in CDD were correlated with the descriptors (i.e., multicollinearity was present). Since reviewing the descriptors by interviewers requires less effort, using a smaller number of descriptors for diagnosis would be beneficial.
This study has several limitations, and there are various ways to extend the proposed logistic LASSO regression. First, the BI-RADS lexicon descriptors rely heavily on observers. In this study, we used the pooled BI-RADS lexicon descriptors obtained by three investigators. In general, pooling the data results in losing a considerable amount of information, and it would be more advantageous to construct a better model by using all the data without pooling. For this purpose, it would be necessary to incorporate interobserver agreement into the model. Second, since this was a retrospective analysis at a single institution, selection bias was inevitable. Although we repeated the random partition 100 times and reported the average predictive performance, a sample size of 139 cases is small; therefore, logistic LASSO regression with more data is necessary. Third, the BI-RADS descriptors used in this study were based on the fourth version because the data were reviewed before the publication of the fifth version [2]. However, the changes in the new version are minor, and most of the descriptors are the same. Lastly, the data were used for regression models in which radiologists only interpreted US findings, which does not reflect actual practice. In actual practice, categorization is based on the results of mammography and US, as well as clinical information. Thus, an analysis with more data, including mammographic findings as well as CDD in the LASSO models, would be necessary for making an accurate comparison with the performance of radiologists.
Certain other regularization methods for high-dimensional regression perform better than LASSO. Examples are the elastic net [14] and sparse Laplacian penalty [15]. However, these methods have more than one tuning parameter, which makes the computation much more difficult. It would be interesting to develop efficient ways of selecting multiple tuning parameters and to apply them to the diagnosis of breast cancer.
In conclusion, logistic LASSO regression based on the BI-RADS descriptors and CDD showed better performance than SL in predicting the presence of breast cancer. The use of CDD as a supplement to the BI-RADS descriptors significantly improved the prediction of breast cancer using the logistic LASSO regression model.
Notes
No potential conflict of interest relevant to this article was reported.
Acknowledgements
This work was supported by grant No. 12-2013-003 from the Seoul National University Bundang Hospital (SNUBH) Research Fund.
Supplementary Material
Supplementary Table 1.
Clinical demographic data of patients(https//doi.org/10.14366/usg.16045)