Ultrasound features of secondary appendicitis in pediatric patients
Article information
Abstract
Purpose
The purpose of this study was to evaluate the ultrasonographic findings of secondary appendicitis (SA) and to discuss the differential findings compared with primary appendicitis.
Methods
In this study, we analyzed the ultrasonographic findings of 94 patients under 15 years old of age treated at our institution from May 2005 to May 2014 who had bowel inflammation and an inflamed appendix with a maximal outer diameter >6 mm that improved with nonsurgical treatment (the SA group). Ninety-nine patients with pathologically proven acute appendicitis (the primary appendicitis [PA] group) from June 2013 to May 2014 and 44 patients with pathologically negative appendectomy results from May 2005 to May 2014 were also included to compare the ultrasonographic features of these conditions. A retrospective review of the ultrasonographic findings was performed by two radiologists. The clinical and laboratory findings were also reviewed. The results were statically analyzed using analysis of variance, the Pearson chi-square test, and the two-tailed Fisher exact test.
Results
Compared with PA, cases of SA had a smaller diameter (9.8 mm vs. 6.6 mm, P<0.001), and were less likely to show periappendiceal fat inflammation (98% vs. 6%, P<0.001) or an appendicolith (34% vs. 11%, P<0.001). SA showed mural hyperemia on color Doppler ultrasonography as frequently as PA (P=0.887).
Conclusion
The ultrasonographic features of SA included an increased diameter compared to a healthy appendix and the same level of hyperemia as in PA. However, the diameter was commonly in the equivocal range (mean diameter, 6.6 mm), and periappendiceal fat inflammation was rarely present in SA.
Introduction
Acute appendicitis is one of the most common diseases that cause an acute surgical emergency in pediatric patients. Acute appendicitis is diagnosed by computed tomography (CT), ultrasonography (US), and rarely, magnetic resonance imaging in specific conditions [1]. Among these modalities, the American College of Radiology recommends US as the most appropriate initial modality to evaluate acute appendicitis in children [2]. To diagnose acute appendicitis on the basis of imaging, size is regarded as the most reliable feature, with the diagnostic criterion of a maximal outer diameter (MOD) more than 6 mm with compression [3]. It is generally accepted that the MOD of a normal appendix does not exceed 6 mm [3]. Other findings helpful for diagnosing acute appendicitis are periappendiceal fat inflammation, mural hyperemia of the appendix, fluid collection in the right lower quadrant (RLQ), and the presence of an appendicolith [4].
However, clinicians often encounter negative findings on the pathologic report after appendectomy, even if the MOD was more than 6 mm. The negative appendectomy (NA) rate has been reported to be between 10% and 30% in several reports [5-7]. The pathology of NA results includes lymphoid hyperplasia, vascular congestion, periappendicitis, and serositis [8,9]. Several inflammatory conditions of the gastrointestinal tract, such as a generalized gastrointestinal infection, Crohn disease, ulcerative colitis, and intestinal tuberculosis may involve the appendix and cause secondary inflammation of the appendix [10-12]. In our institution, when bowel inflammation was present and the appendix also showed inflammation, we termed the condition secondary appendicitis (SA), which is not due to a luminal obstruction, but secondary to adjacent bowel abnormalities. In contrast, we use the term primary appendicitis (PA) to refer to the conventional form of acute appendicitis, which is due to luminal obstruction, with no other abnormalities in the adjacent bowel. SA can mimic PA clinically and radiologically. For PA, the treatment of choice is appendectomy, which is broadly accepted. However, for SA, the preferred treatment is conservative management, and an appendectomy is not necessary. To avoid an unnecessary operation or invasive procedure, differentiating SA from acute appendicitis is important; in particular, it is important to be able to do so based on US in the pediatric population.
The purpose of this study was to review the clinical results of SA in our institution, to describe the US findings of SA, and to discuss the differential findings compared with PA.
Materials and Methods
This study was approved by the Institutional Review Board of our hospital, which waived the requirement for informed consent for the use of patient data because of the retrospective study design.
Patients
We searched for the terms "secondary appendicitis" or "secondary inflammation of appendix" in the US reports on the picture archiving and communication system (PACS) of our institution from May 2005 to May 2014, and limited our search to pediatric patients who were under 15 years old. These patients were admitted both to the emergency department and to the pediatric clinic of our institution. We included children who were treated with conservative management and whose symptoms improved. We excluded cases if the MOD of the appendix was less than 6 mm on the initial US exam. We grouped these patients into the SA group. In order to create a comparison group, we received a list of pathologic reports of appendectomy specimens from May 2005 to May 2014 in patients under 15 years old. Children who were diagnosed using CT were excluded, and we only included patients diagnosed using US. There were various pathological diagnoses, including acute suppurative appendicitis, acute gangrenous appendicitis, acute early appendicitis with or without perforation, lymphoid hyperplasia, vascular congestion, acute serositis, periappendicitis, and tumorous condition of the appendix. We categorized these pathologic diagnoses into four groups: acute appendicitis without perforation, perforated appendicitis, NA (other pathology rather than appendicitis), and tumorous condition. We separated perforated appendicitis from acute appendicitis without perforation because perforation could cause the appendix to decompress, reducing the MOD to less than 6 mm [6]. From the patients with acute appendicitis without perforation, we included consecutive patients from June 2013 to May 2014; the choice was made to limit the time range because the number of acute appendicitis cases was huge. All these patients showed an MOD of at least 6 mm on initial US. These patients comprised the PA group. In the children with NA findings, the pathologies were lymphoid hyperplasia, vascular congestion, acute serositis, and periappendicitis. Some of these patients showed an elevated MOD of over 6 mm. We classified them as the NA group and included them in the analysis because we thought that this group would be clinically consistent with the SA group.
US Technique
The appendix protocol of our institution includes conventional supine scanning and left posterior oblique scanning, using a 1-5 MHz curved array, a 5-8 MHz curved array, and a 9 MHz linear transducer of several US machines (LOGIQ E9, GE Healthcare, Chalfont St. Giles, UK; EPIQ 5, Philips Healthcare, Bothell, WA, USA; iU22, Philips Healthcare; HDI 5000, Philips Healthcare). The examination began by identifying the location of the ileocecal valve, followed by the evaluation of the appendix using the graded compression technique described by Puylaert [13]. The MOD was measured under compression in all cases. Both gray-scale and color Doppler images were obtained to evaluate the appendix. The exams were performed by several radiologists, including one senior radiologist with 22 years of experience and more than 10 residents of our Department of Radiology, supervised by the senior radiologist.
US Interpretation
One senior radiologist with 22 years of experience and one resident with 3 years of experience in radiology retrospectively reviewed the US exams, blinded to the original US reports, clinical course, and pathologic results of the individual examinations. Differences of opinion were resolved through consensus. In the analysis of the US features, the MOD, presence of hyperemia on color Doppler US, and the presence of an appendicolith were included. In addition, secondary findings were analyzed, including periappendiceal fat inflammation, mesenteric lymphadenopathy, extraluminal free fluid in the RLQ of the abdomen, and combined inflammation of the bowel, which was classified as terminal ileitis, ileocolitis, or pancolitis. Periappendiceal fat inflammation was defined as globular thickening with increased echogenicity of the periappendiceal adipose tissue, greater than that of other regions of fat within the field of view. Combined inflammation of the bowel was considered to be present when the small and/or large bowel revealed concentric wall thickening with hyperemia on color Doppler US.
Clinical Evaluation
The electronic medical records of each patient at the time of presentation were reviewed. The clinical evaluation was based on the variables of the Alvarado score, which was used for the diagnosis of PA: nausea or vomiting, tenderness or rebound tenderness in the RLQ of the abdomen, fever of 37.3°C or more, leukocytosis of 10,000 white blood cells per microliter in the serum or more, and neutrophilia as defined by a neutrophil percentage of 75% in the serum white blood cell count or more. The presence of pain migration and anorexia was not evaluated due to insufficient data. The laboratory assessment included serum C-reactive protein (CRP) levels, which rise in response to inflammation. We analyzed whether the presence of these symptoms and signs was different among the PA, SA, and NA groups.
Statistical Analysis
Analysis of variance was used to determine whether there were any significant differences in continuous variables, such as the MOD of the appendix and the serum CRP level, among the three groups, followed by Tukey multiple comparison. The Pearson chisquare test was used for the statistical analysis of categorical variables such as presence of clinical symptoms, laboratory findings, secondary US findings associated with appendicitis, and combined bowel inflammation. A P-value <0.05 was considered to indicate a statistically significant difference. SPSS ver. 22.0 (IBM SPSS Statistics, IBM Corp., Armonk, NY, USA) was used for all statistical analyses.
Results
A total of 203 patients were identified through a search for "secondary appendicitis" or "secondary inflammation of appendix" in the US reports on the PACS of our institution. Our search was limited to a range from May 2005 to May 2014, and encompassed pediatric patients under 15 years of age (Fig. 1). Of these patients, 10 (5%) underwent an appendectomy. The pathologic results were lymphoid hyperplasia (n=4), acute early appendicitis (n=3), serosal vascular congestion (n=2), and acute appendiceal serositis (n=1). The symptoms of the other 193 patients (95%) improved with conservative management. Only three of the 203 patients (1.4%) were diagnosed with acute early appendicitis on pathology. In 94 of the patients who were treated with conservative management, the MOD of the appendix was at least 6 mm on the initial US exam. These 94 patients were included in the SA group.
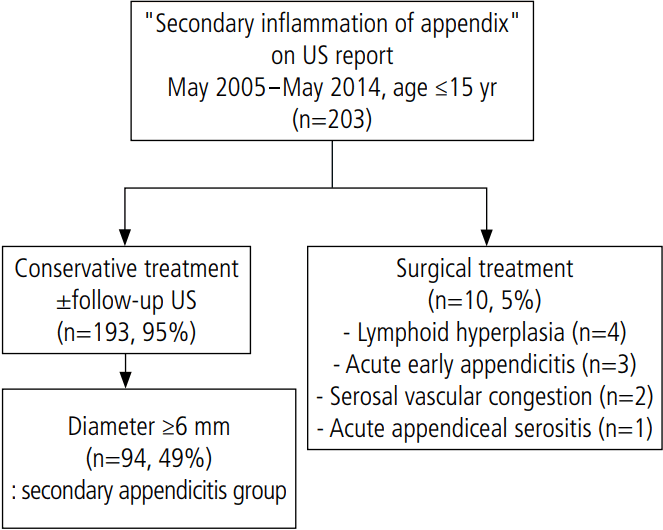
Study population flow diagram.
It shows the results of searching for the term "secondary inflammation of appendix" in ultrasonography (US) reports from May 2005 to May 2014.
A total of 1,414 patients were included on the list of pathologic reports of appendectomy specimens (Fig. 2), of whom 269 patients (19%) were diagnosed using CT and the other 1,145 (81%) were diagnosed using US. Perforation was present in approximately 20% of the cases. The NA rate was approximately 5%. Two cases were diagnosed as a tumorous condition of the appendix (a neuroendocrine tumor and Burkitt lymphoma). From June 2013 to May 2014, there were 99 consecutive patients with acute appendicitis without perforation. These 99 patients were included in the PA group, and the MOD was greater than 6 mm on US in all these cases. Among the 55 patients who received NA reports on pathology, 44 (80%) showed an increased MOD of at least 6 mm on US. These 44 patients were included in the NA group.
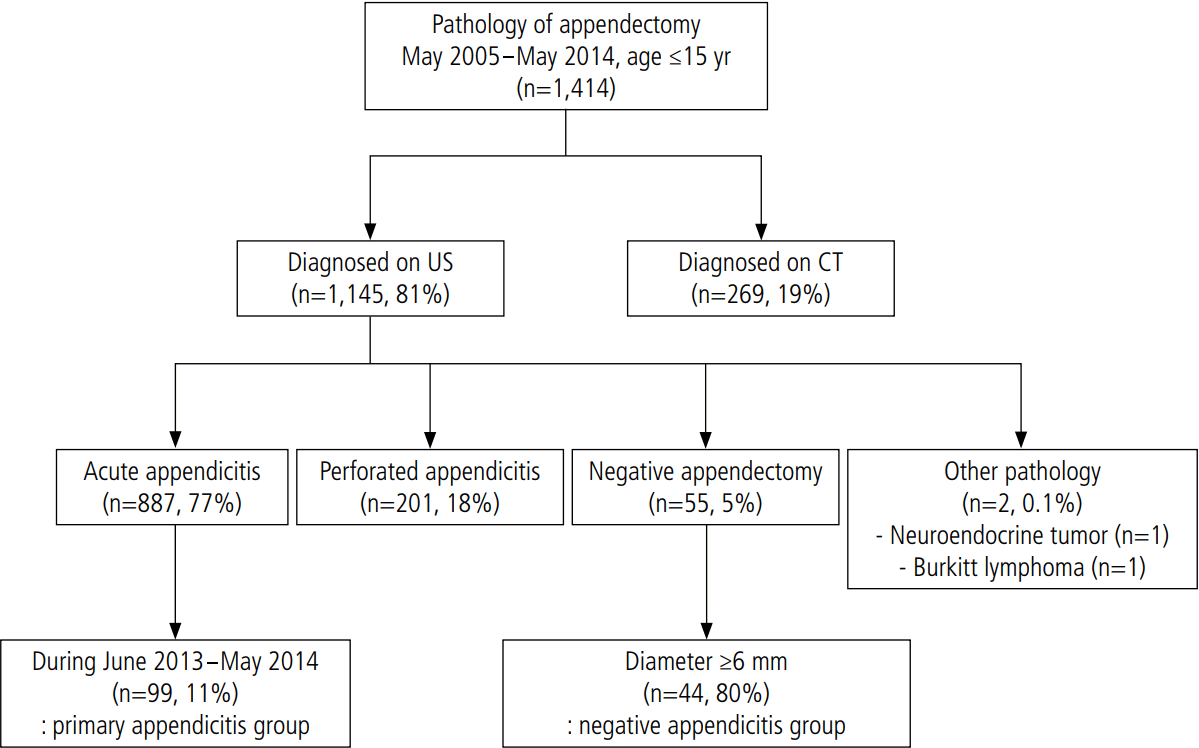
Study population flow diagram.
It shows the pathologic results of appendectomies from May 2005 to May 2014. US, ultrasonography; CT, computed tomography.
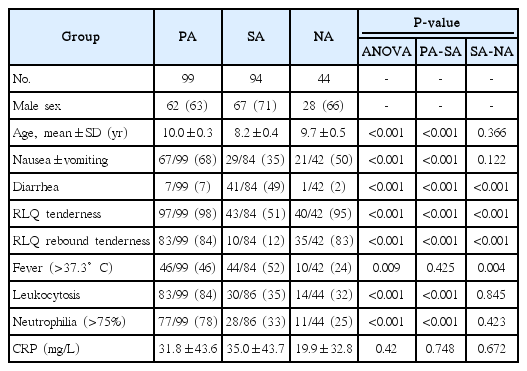
All three groups showed a slight male predominance (Table 1). The mean ages were similar, with no statistically significant difference: 10.0±0.3 years in the PA group, 8.2±0.4 years in the SA group, and 9.7±0.5 years in the NA group.
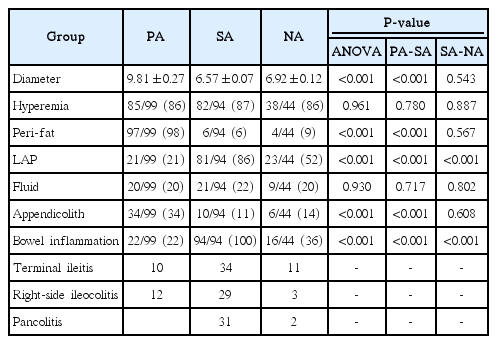
The average MOD was the highest in the PA group, at 9.81±0.27 mm (P<0.001) (Table 2, Fig. 3). The average MODs of the SA and NA groups were within the equivocal range: 6.57±0.07 mm and 6.92±0.12 mm, respectively. Mural hyperemia on color Doppler US was frequently seen in all groups, with no significant intergroup difference; the rate was above 86% in all groups (P=0.961). An appendicolith was more frequently observed in the PA group (34 of 99, 34%; P<0.001) than in the SA and NA groups (10 of 94, 11% and 6 of 44, 14%). There was an obvious difference in the prevalence of periappendiceal fat inflammation (P<0.001); most cases in the PA group showed periappendiceal fat inflammation (97 of 99, 98%) (Fig. 4), whereas it was uncommon in the other two groups (6 of 94, 6% and 4 of 44, 9%, respectively). Mesenteric lymphadenopathy was most frequently seen in the SA group (81 of 94, 86%) (Fig. 5), followed by the NA and PA groups (23 of 44, 52% and 21 of 99, 21%, respectively), and this difference was statistically significant (P<0.001). Extraluminal free fluid was present in approximately 20% of cases in all three groups (P=0.930). All patients in the SA group showed bowel inflammation (94 of 94, 100%). This condition was also often observed in the PA and NA groups (22 of 99, 22% and 16 of 44, 36%) (Fig. 6). One-third of the SA patients with bowel inflammation showed pancolitis, while no patients showed pancolitis in the PA group. Statistically significant differences among the three groups were found in this regard (P<0.001). There were no statistically significant differences between the SA and NA groups in most of the US findings, including the MOD of the appendix (P=0.543), mural hyperemia on color Doppler US (P=0.887), periappendiceal fat inflammation (P=0.567), extraluminal free fluid (P=0.802), and the presence of an appendicolith (P=0.608).

Box plot of the maximal outer diameter of the appendix in the three groups.
The central solid line represents the grand mean, the box represents the interquartile range, and the extensions represent the measured range. PA, primary appendicitis; SA, secondary appendicitis; NA, negative appendectomy.
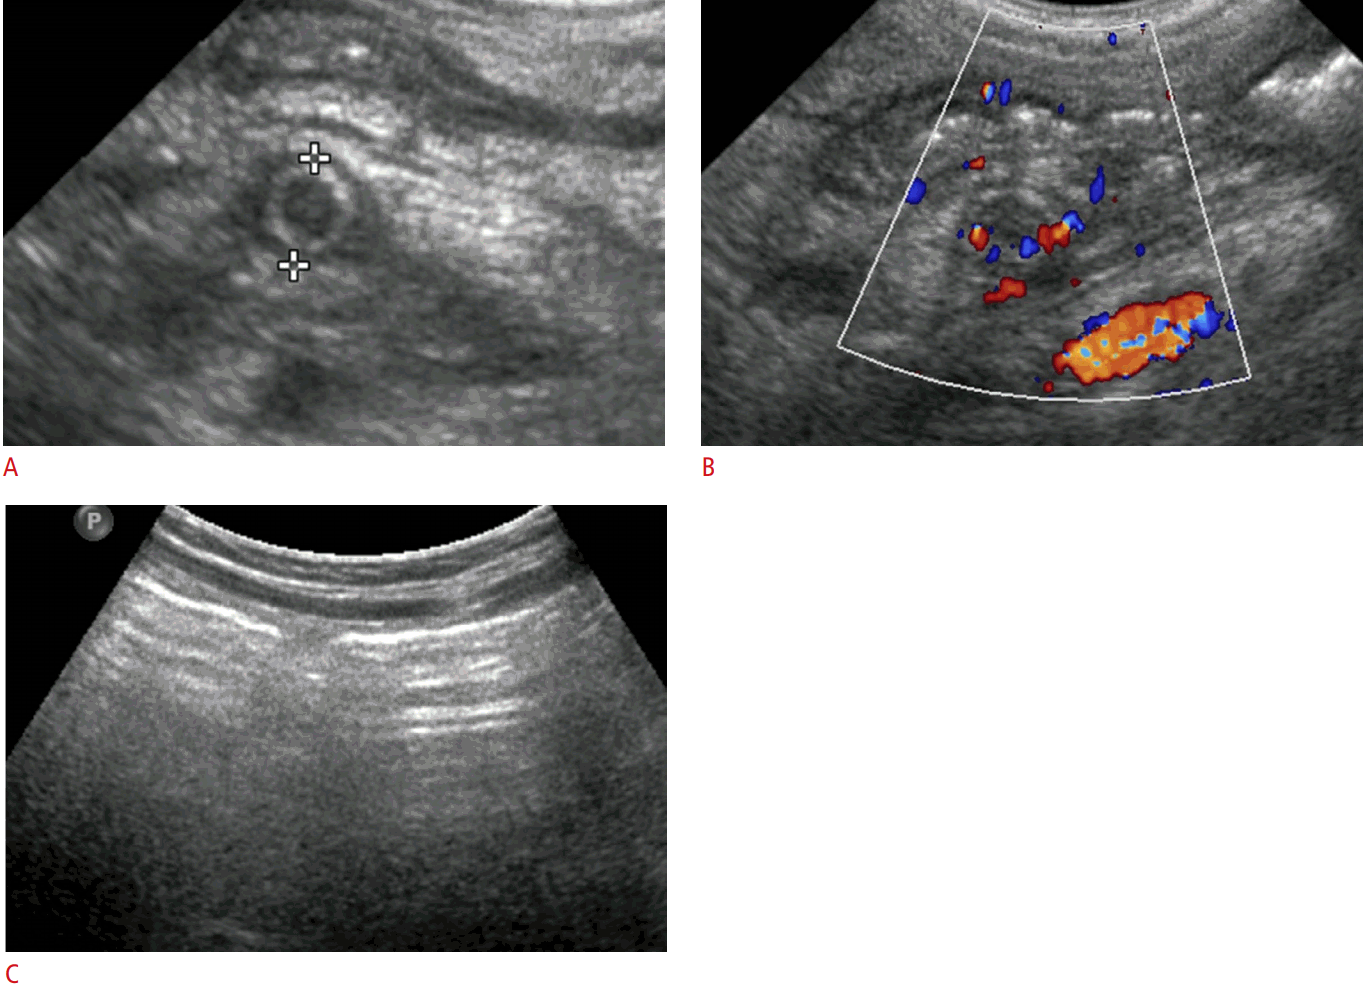
An 8-year-old girl with primary appendicitis.
The laboratory findings showed leukocytosis and an elevated serum C-reactive protein level (52.6 mg/L). A. Gray-scale ultrasonography (an appendiceal transverse scan) shows a non-compressive, round appendix (6 mm) and periappendiceal fat inflammation. B. Color Doppler ultrasonography shows mural hyperemia of the appendix. C. The bowel wall is not thickened. The patient underwent appendectomy and the pathologic result was acute suppurative appendicitis.

A 3-year-old boy with secondary appendicitis.
The laboratory findings showed an elevated serum C-reactive protein level (13.8 mg/L). A. Gray-scale ultrasonography (an appendiceal longitudinal scan) shows an increased maximal outer diameter of the appendix of 7.8 mm with wall thickening and no periappendiceal fat inflammation. B. Color Doppler ultrasonography shows mural hyperemia of the appendix. C. Multiple enlarged lymph nodes are seen in the right lower quadrant of the abdomen, representing mesenteric lymphadenopathy. D. Marked wall thickening of the ascending colon is noted. The patient was diagnosed with ileocolitis and secondary appendicitis. He was treated with conservative management and the follow-up ultrasound showed normalization of the appendix.
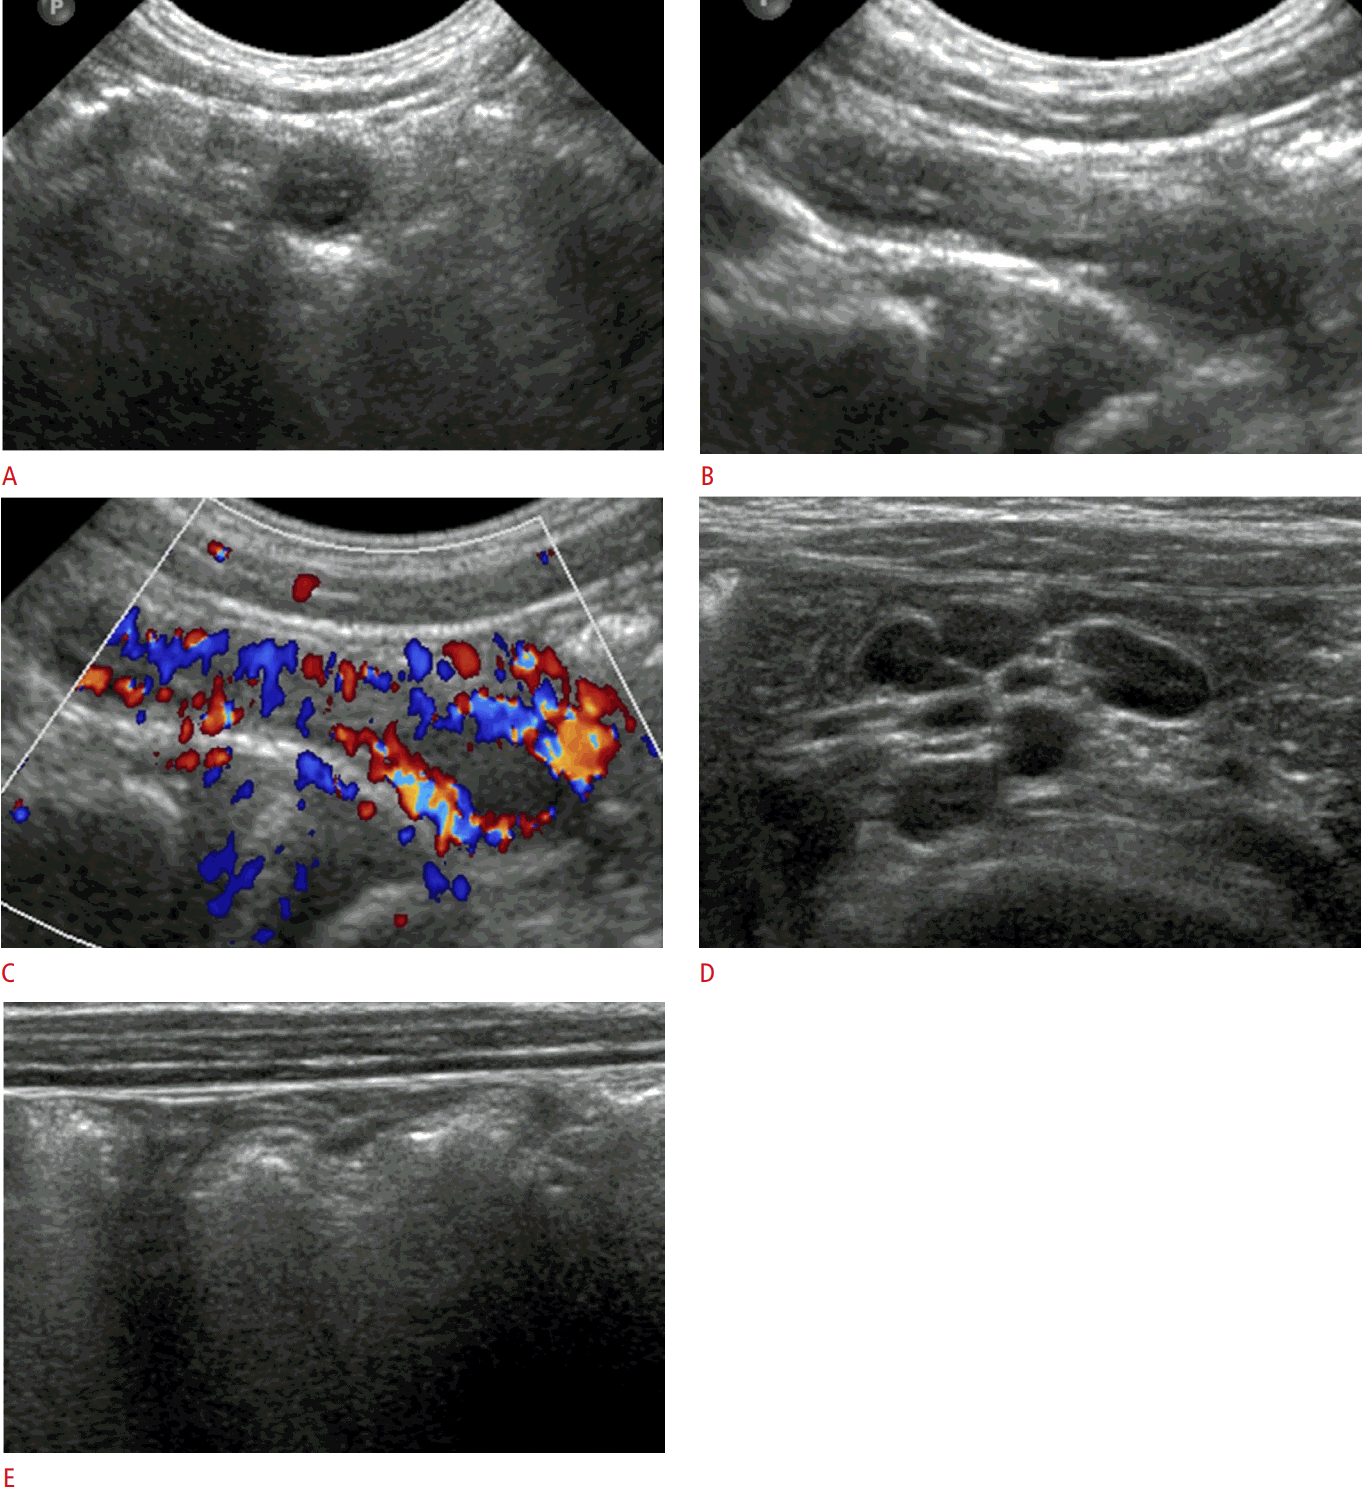
A 4-year-old boy who underwent a negative appendectomy.
The laboratory findings showed an elevated serum C-reactive protein level (42.3 mg/L). A, B. Gray-scale ultrasonography, with appendiceal transverse and longitudinal views, shows a non-compressive, round dilated appendix (7.0 mm) and minimal periappendiceal fat inflammation. C. Color Doppler ultrasonography shows mural hyperemia of the appendix. D. Several mildly enlarged lymph nodes are seen in the right lower quadrant of the abdomen. E. Mild wall thickening of the ascending colon is noted. The patient underwent appendectomy and the pathologic result was reactive hyperplasia of the appendix.
Medical records were obtained for all patients in the PA group, but for some patients in the SA and NA groups, the medical records and laboratory findings were not available (Table 1). In all categories of symptoms and signs, statistically significant differences were found among the three groups. The patients in the PA group more frequently presented with nausea and/or vomiting (67 of 99, 68%) than the patients in the SA and PA groups (29 of 84, 35% and 21 of 42, 50%). Almost all patients in the PA and NA groups showed RLQ tenderness (97 of 99, 98% and 40 of 42, 95%), while half of the SA patients showed it. Most patients in the PA and NA groups (83 of 99, 84% and 35 of 42, 83%) showed RLQ rebound tenderness, in contrast to approximately 10% in the SA group. Half of the patients in the SA group experienced diarrhea (41 of 84, 49%), but diarrhea was uncommon in the other groups (7 of 99, 7% in the PA group and 1 of 42, 2% in the NA group). Fever was present in more patients in the PA and SA groups (46 of 99, 46% and 44 of 84, 52%) than in the NA group (10 of 42, 24%). In a comparative analysis between the SA and NA groups, there were significant differences in all findings, except nausea and/or vomiting.
Leukocytosis and neutrophilia were significantly more common in patients in the PA group (83 of 99, 84% and 77 of 99, 78%, respectively) than in the SA group (30 of 86, 35% and 28 of 86, 33%, respectively) or NA group (14 of 44, 32% and 11 of 44, 25%, respectively) (P<0.001 for both). The average levels of serum CRP showed no statistically significant differences among the three groups (P=0.420). It was 31.8±43.6 mg/L in the PA group, 35.0±43.7 mg/L in the SA group, and 19.9±32.8 mg/L in the NA group. In the comparative analysis of the SA and NA groups, there were no significant differences in any laboratory finding.
Discussion
The size criterion, referring to an increase of the MOD to greater than 6 mm, is the most important diagnostic feature of acute appendicitis in pediatric patients. However, the limitations of the size criterion have been presented in several studies, and debate continues about how to treat appendices with an equivocal diameter [14,15]. In our study, all cases showed a positive MOD, of at least 6 mm. However, these cases showed different clinical courses and different results. We analyzed the US findings in these cases. Most cases in the SA and NA groups showed an equivocal diameter, with a mean MOD of less than 7 mm. Even the third quartile was less than 8 mm in both groups. In such cases with an equivocal MOD, careful US examination should be performed and the operator should consider the possibility of SA, as well as PA.
Compressibility of the appendix is also a helpful US finding in diagnosing appendicitis [3]; the normal appendix is compressible, but in appendicitis, it is non-compressible. In this study, there was a limitation in the analysis of compressibility due to the retrospective study design. However, we think that there was a difference in the compressibility of the appendices between the PA and SA groups. In PA, no or minimal compressibility was found, whereas SA seemed to be associated with slightly more compressibility, but not as compressible as normal.
A remarkably higher incidence of periappendiceal fat inflammation in the PA group (98%) was found in our study. In contrast, only 6% and 9% of the patients in the SA and NA groups showed this finding, respectively (P<0.001). The presence of periappendiceal fat inflammation is a suggestive feature of PA and the main differential finding between PA and SA. It may increase the sensitivity and specificity of diagnosing PA. According to Sim et al. [15], the sensitivity and specificity of fat infiltration for diagnosing appendicitis were 74.1% and 99.6%, respectively, based on CT. We may expect similar diagnostic values even when using US, according to our findings. In other words, if there is no periappendiceal fat inflammation in an equivocally enlarged appendix, the operator should consider another possibility, such as SA, rather than PA. However, some cases of SA may be accompanied by periappendiceal fat.
Mural hyperemia is regarded as a feature that discriminates appendicitis from a normal appendix [16]. We found a high frequency of mural hyperemia in all three groups (above 85%), with no statistically significant difference. Clearly, this feature is effective for distinguishing between appendicitis and a normal appendix. However, SA is not a normal appendix; it is an inflamed condition due to another source of primary inflammation. Therefore, we think that mural hyperemia is a US finding of secondary inflammation. We agree that mural hyperemia is useful for diagnosing and differentiating acute appendicitis, but it does not seem to be useful for differentiating PA and SA, because mural hyperemia accompanies both conditions. Thus, we think that it is important not to diagnose PA based on mural hyperemia in the thickened appendiceal wall. In our opinion, this could be an important pitfall in the diagnosis of PA.
Our study showed a significantly higher incidence of mesenteric lymphadenopathy in the SA group (P<0.001) than in the PA and NA groups. However, a previous study investigating the US findings of lymphoid hyperplasia of the appendix [17] showed no statistically significant difference in the frequency of mesenteric lymphadenopathy between lymphoid hyperplasia and acute appendicitis (P=0.156). Type I error and detection bias may have been present in our study.
In the previous study by Ives et al. [4], the presence of non-appendiceal bowel wall thickening was a predictor of PA, with an odds ratio of 0.4 with statistical significance in univariate analysis. In other word, PA showed non-appendiceal bowel wall thickening less frequently than non-appendicitis cases. In our study, all patients in the SA group showed combined bowel inflammation, compared to only 22% in the PA group. We divided bowel inflammation into three groups according to its extent: terminal ileitis, right-side ileocolitis, and pancolitis. The SA group showed a relatively even distribution of these three groups. One-third of them showed pancolitis, while no patients in the PA group and only two patients in the NA group showed pancolitis. The presence of combined bowel wall thickening, especially if it is pancolitis, is a suggestive finding of SA, rather than PA, in an equivocal appendix.
It is a widespread belief that PA is caused by luminal obstruction followed by a fecalith and secondary bacterial invasion of the appendiceal wall. However, luminal obstruction is only one cause of appendicitis, and a fecalith is not always the primary cause [18]. According to a review article of the pathology of acute appendicitis [19], the diagnostic term acute appendicitis should only be applied to cases in which neutrophils are present in the muscularis propria. In that article, appendiceal inflammation was classified into seven categories: acute intraluminal inflammation, acute mucosal inflammation, acute mucosal and submucosal inflammation, suppurative acute appendicitis, gangrenous acute appendicitis, periappendicitis, and increased mural eosinophils. We think that the categories of suppurative acute appendicitis and gangrenous acute appendicitis correspond to PA in our study. The other categories can be considered to correspond to SA or an early form of PA. They also stated that nonspecific enteric infections can be a cause of acute mucosal inflammation or mucosal and submucosal inflammation of the appendix. In terms of pathology, the characteristic features of suppurative acute appendicitis are transmural inflammation and fibrinopurulent serosal exudate. In contrast, in cases of acute mucosal inflammation or acute mucosal and submucosal inflammation, inflammation is limited only to the mucosal layer or the mucosal and submucosal layer, and no serosal exudate is present. If the appendix shows luminal obstruction and transmural wall thickening, we can suggest PA instead of SA. We suspect that the ultrasonographic findings of early PA and SA can be difficult to distinguish in many cases. However, periappendiceal fat evaluation is helpful for making this distinction. If there is increased echogenicity in the periappendiceal fat and increased vascularity on color Doppler sonography, we can suggest early PA rather than SA. Another parameter for distinguishing between early PA and SA is the associated bowel condition. Considering the pathophysiology of PA and SA, we expect no or minimal inflammation in the terminal ileum and cecum in early PA, but in SA, more prominent inflammation in the terminal ileum and cecum would be noted.
The Alvarado score is a well-known scoring system for predicting PA based on clinical and laboratory findings [20]. The components are as follows: RLQ tenderness, fever over 37.3°C, rebound tenderness, migration of pain to the RLQ area, anorexia, nausea or vomiting, leukocytosis with a count of over 10,000/µL, and a leukocyte shift to the left. This system has been confirmed to have good diagnostic performance and it is effective tool for reducing NA findings [21]. Our results (Table 1) indicate that the Alvarado score is also effective for differentiating between PA and SA. However, in the NA group, RLQ tenderness and rebound tenderness were frequently present, as in the PA group. Leukocytosis and leukocyte shift to the left were significantly more common in the PA group than in the SA and NA groups. The patients in the SA group showed a significantly higher incidence of diarrhea, but diarrhea was still present in fewer than half of these patients. The CRP level showed no significant difference among the three groups. We suspected that combined bowel inflammation would increase the serum CRP level. Again, clinical findings can be used effectively to predict PA, but it is sometimes hard to differentiate SA with only clinical findings.
Lymphoid hyperplasia of the appendix is regarded as one of the most common pathologies in false-positive appendectomies [3]. The appendix normally contains lymphoid follicles in the lamina propria layer. If there is any inflammation in the appendix, as occurs in gastroenteritis and mesenteric adenitis, the lymphoid follicles become hypertrophied in response, resulting in a thickened appendiceal wall [22]. In our study, 41 patients (93%) in the NA group were diagnosed with lymphoid hyperplasia of the appendix on pathology. Four patients who were initially diagnosed with SA on US were diagnosed with lymphoid hyperplasia on pathology (Fig. 1). We suspect that the lymphoid hyperplasia of the appendix was the main pathology causing the increased MOD of the appendix in the SA group. Unfortunately, pathologic confirmation through surgery was not performed in all patients. However, this could be both a weakness and a strength of our study, because we observed symptom improvement without surgery in those patients.
Park et al. [3] described the characteristic US finding of lymphoid hyperplasia of the appendix as a thickening of the hypoechoic lamina propria layer of more than 0.8 mm. Recently, Xu et al. [23] compared the thickness of the lamina propria layer in cases of lymphoid hyperplasia and acute appendicitis. They found an association between the thickness of the lamina propria layer and false-positive ultrasonographic diagnoses of appendicitis with equivocal diameters [23]. We tried to measure the thickness of the lamina propria layer if possible. However, there were some obstacles in measuring it retrospectively. In many cases of PA, the appendiceal layering pattern was obliterated or effaced. The limited resolution, due to the deep location of appendix, obesity of patients, or old-fashioned US machine, impeded precise measurements. With up-to-date ultrasonographic techniques, a prospective investigation may be needed to elucidate the association between the thickness of the lamina propria layer and SA.
This study has some limitations. First, SA was not a pathologic diagnosis, but a clinical diagnosis in our study. No pathologic findings were available because these patients did not undergo an appendectomy. This may be a confusing or controversial concept to some physicians. Our study showed the improvement of SA without appendectomy. It is helpful to be familiar with this possibility to avoid negative appendectomies. Second, we could not exclude the possibility of self-limiting PA, which shows spontaneous resolution without appendectomy, in the SA group [24]. However, delayed appendectomy is relatively common in antibiotic-treated PA [25]. In our study, 95% of the SA group showed symptom improvement without appendectomy and no relapse. Third, this was a retrospective study, and we identified SA patients based on their US reports. US is a highly operator-dependent imaging modality and the initial impression may have an effect on reviewing the images. Fourth, the US exam and physical examinations were performed by several physicians. Possible biases and discordances between them may have distorted the results. Therefore, a further prospective study is needed with a larger number of patients and a more standardized protocol.
In conclusion, among 203 patients with SA at our institution, most patients (95%) showed improvement of their symptoms with conservative management. Only three patients (1.4%) were diagnosed with acute early appendicitis on pathology. The US features of SA were increased diameter and hyperemia of the appendix, as is the case for PA. However, the diameter was commonly in the equivocal range for SA (mean diameter: 6.57 mm), and periappendiceal fat inflammation was rarely present. In a child with suspected appendicitis, if US shows a mildly enlarged appendix, no periappendiceal fat inflammation, and combined bowel inflammation, conservative management and follow-up US are recommended rather than immediate appendectomy, given the possibility of SA.
Notes
No potential conflict of interest relevant to this article was reported.

