Blood flow in intracranial aneurysms treated with Pipeline embolization devices: computational simulation and verification with Doppler ultrasonography on phantom models
Article information
Abstract
Purpose:
The aim of this study was to validate a computational fluid dynamics (CFD) simulation of flow-diverter treatment through Doppler ultrasonography measurements in patient-specific models of intracranial bifurcation and side-wall aneurysms.
Methods:
Computational and physical models of patient-specific bifurcation and sidewall aneurysms were constructed from computed tomography angiography with use of stereolithography, a three-dimensional printing technology. Flow dynamics parameters before and after flow-diverter treatment were measured with pulse-wave and color Doppler ultrasonography, and then compared with CFD simulations.
Results:
CFD simulations showed drastic flow reduction after flow-diverter treatment in both aneurysms. The mean volume flow rate decreased by 90% and 85% for the bifurcation aneurysm and the side-wall aneurysm, respectively. Velocity contour plots from computer simulations before and after flow diversion closely resembled the patterns obtained by color Doppler ultrasonography.
Conclusion:
The CFD estimation of flow reduction in aneurysms treated with a flow-diverting stent was verified by Doppler ultrasonography in patient-specific phantom models of bifurcation and side-wall aneurysms. The combination of CFD and ultrasonography may constitute a feasible and reliable technique in studying the treatment of intracranial aneurysms with flow-diverting stents.
Introduction
Flow-diverting stents, such as the Pipeline embolization device (PED), have been established as a primary endovascular treatment for intracranial aneurysms (abnormal swellings of blood vessels in the brain). The aneurysm occlusion rate of flow-diverter treatment compares favorably with coil embolization, and has been recommended as a first-line treatment for selected patients [1,2]. The accurate prediction of patient-specific alterations in flow dynamics after treatment may have a strong clinical impact by enabling clinicians to determine which aneurysms are suitable for flow-diverter treatment. Such findings may also help explain the pathophysiology of aneurysms that are refractory to treatment or experience rupture after flow diversion [3,4].
In recent years, computational fluid dynamics (CFD) simulations have been extensively employed in studies of aneurysms. The merits of CFD simulations include their relatively low cost, noninvasive nature, and the ability to estimate important quantities that are otherwise difficult to measure, such as pressure, shear stress, and shear stress gradients [5,6]. Most CFD simulations make certain simplifying assumptions to treat an inherently complex threedimensional hemodynamic flow field, such as modeling blood as a Newtonian fluid. Therefore, it is desirable to obtain experimental verification of CFD studies and predictions.
Various experimental techniques such as particle image velocimetry, laser Doppler velocimetry, and volumetric threecomponent velocimetry have been employed in earlier studies of untreated aneurysms [7-11]. Despite the growing interest in using CFD simulations to predict the treatment outcome after the placement of a flow-diverting stent, the reliability and accuracy of CFD simulations in estimating the complex hemodynamics related to the deployment of flow-diversion devices has not yet been securely established. The aim of this study was to validate a CFD simulation of flow-diverter treatment with Doppler ultrasonography measurements in patient-specific models of bifurcation and sidewall aneurysms.
Materials and Methods
Patient-Specific Aneurysm Models
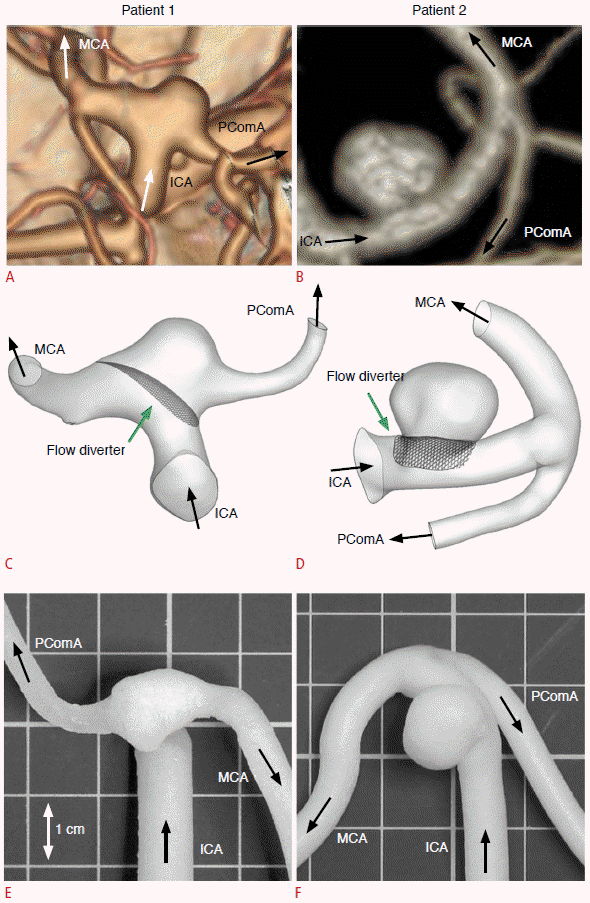
This study, involving two patients with cerebral aneurysms, was approved by the Institutional Review Board of the University of Hong Kong and Queen Mary Hospital. Consent of the patients was obtained. Patient 1 had a bifurcation aneurysm at the posterior communicating artery (Fig. 1A). Patient 2 had a side-wall aneurysm located at the distal internal carotid artery (ICA) (Fig. 1B). Geometrically accurate three-dimensional computational models were reconstructed from computed tomography (CT) angiography with Mimics (Materialise, Leuven, Belgium) for CFD analysis (Fig. 1C, D).

Two intracranial aneurysms and the corresponding phantom models.
A, B. Computed tomography angiograms illustrate the configurations of a posterior communicating artery aneurysm in a 60-year-old woman (patient 1) (A) and a distal internal carotid artery aneurysm in a 71-year-old woman (patient 2) (B). C-F. These angiograms were used to generate computational fluid dynamics models (C, D) and physical phantom models (E, F). ICA, internal carotid artery; MCA, middle cerebral artery; PComA, posterior communicating artery.
The precise vessel diameters of the ICA, middle cerebral artery, and posterior communicating artery were 5.6 mm, 2.7 mm, and 1.6 mm, respectively, for patient 1. For patient 2, the vessel diameters of the proximal ICA and distal ICA were 5.6 mm and 4.4 mm, respectively. While the internal diameters of the vessels in both the numerical and physical models matched the dimensions obtained from the patients, the wall thickness of the phantom model was necessarily larger than that of the actual vessel to ensure structural rigidity. Using the computer-aided design software Solidworks (Dassault Systèmes, Velizy, France), the phantom models with a uniform wall thickness of 0.8 mm (the smallest value practically feasible without breaking the tube) were printed by a highresolution stereolithography machine (Eden 350V, Objet Geometries, Rahovot, Israel). A photopolymer (FullCure 930, Objet Geometries) and removable supporting photosensitive resin (FullCure 705, Objet Geometries) were used for the phantom models (Fig. 1E, F) [12].
CFD Simulations
A virtual flow-diverting stent based on the specifications of the PED (ev3 Endovascular Inc., Plymouth, MN, USA) was deployed in both aneurysm models in the Solidworks platform, with the dimensions of the pores resembling those of the PED in fully deployed conditions. The computational mesh was generated with Gambit 2.4.6 (ANSYS, Canonsburg, PA, USA) and numerical simulations were performed by Fluent 6.3 (ANSYS).
The simulations were performed following a protocol similar to those previously described in the literature [13,14]. The unsteady solver in Fluent was used to solve the three-dimensional fluid flow as governed by the continuity equation and the Navier-Stokes equations. The residual error was taken as 10-6. Blood was assumed to be a Newtonian fluid, with a density of 1,037 kg/m3 and a viscosity of 0.004096 kg/(m·sec). Tetrahedral or hybrid elements with a spatial grid size of 0.3 mm were employed. The mesh independence test was performed on both models, ensuring that doubling the number of grid points led to a change of 2% or less in all hemodynamic quantities and parameters.
Validated pulsatile mean flow rate and pressure profiles of the ICA were imposed as boundary conditions at the inlet and outlets, with a peak systolic flow rate of 6 mL/sec and blood pressure of 120/80 mm Hg [15]. The walls were assumed to be rigid. This assumption was valid, as experimental observations showed negligible expansion and constriction in the aneurysms. No-slip conditions were imposed. The cardiac period was taken as 0.8 seconds, corresponding to a heart rate of 75 beats per minute. The corresponding bulk velocity at peak systole was 0.24 m/sec at the inlet. With a diameter of 5.6 mm, the maximum Reynolds number at peak systole was 340. The third cycle of the computations was taken for further analysis, as a periodic output can be generated after two cycles of computations. Properties reported reflect values in the systolic phase unless otherwise specified.
Ultrasonography Measurements in the Physical Models
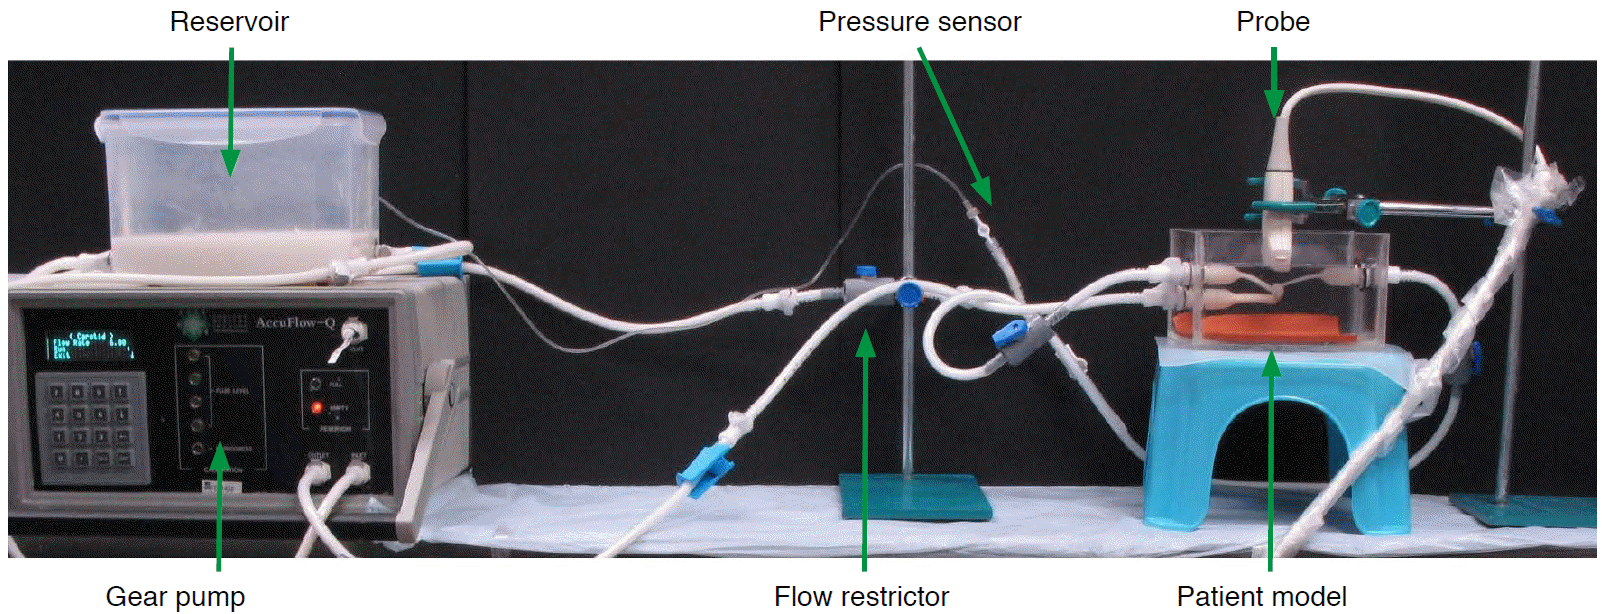
A single appropriately-sized PED was deployed across the aneurysm neck in both aneurysm models using the procedures employed in a standard surgical operation. In patient 1, the posterior communicating artery was covered by the PED. In patient 2, only the aneurysm was covered. The models were mounted on a custommade clear acrylic casing and aligned to prevent geometric error (Fig. 2). These were connected to a circuit that simulated ICA circulation with pulsatile flow at 120/80 mm Hg generated by a computercontrolled gear pump (AccuFlow-Q, Shelley Medical Imaging, London, ON, Canada). A blood-mimicking fluid with acoustic scattering strength and acoustic speed of 1,548 m/sec (Shelley Medical Imaging) was used as the flow medium [16].

Diagram of the experimental setup.
The physical phantom models were mounted on a custom-made clear acrylic casing. They were connected to a circuit simulating the internal carotid artery circulation with pulsatile flow at 120/80 mm Hg generated by a computer-controlled gear pump.
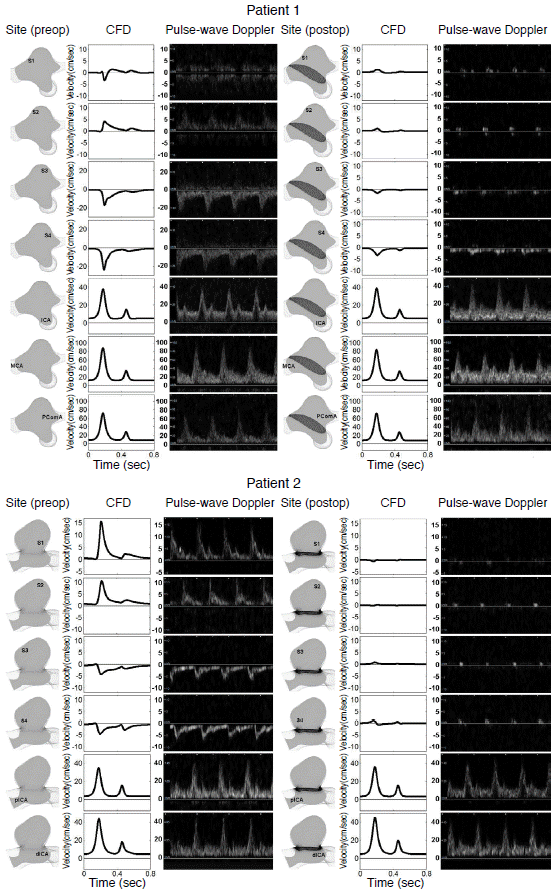
An ultrasound scanner (SonixTouch, Ultrasonix, Richmond, BC, Canada) with a linear array transducer (L14-5, Ultrasonix) transmitting an ultrasound frequency at 5 MHz was used for flow measurement in the aneurysms. The transducer was positioned 1 cm above the aneurysm apex under distilled water, and the imaging plane was chosen in order to maximize the visualization of flow inside the aneurysmal sac and parent vessel. The axial flow velocities at the four quadrants of the aneurysmal sac (labeled S1 to S4 in Fig. 3) and angle-corrected flow velocities at the inlet and outlet of the parent vessel were measured with pulse-wave Doppler imaging over 30 cardiac cycles. Color Doppler imaging was used to capture the global axial flow profile inside the aneurysm and parent vessel, as represented with a two-dimensional color map. The aneurysm models were studied before and after the placement of the flow-diverting stent. In order to facilitate a fair comparison and good visualization of the aneurysm models before and after the placement of the flow-diverting stent, the pulse repetition frequency was set to be 1.3 kHz and 2.0 kHz for patient 1 and patient 2, respectively, with a 31-Hz wall filter for both. Different pulse repetition frequencies were used to prevent aliasing. Lower pulse repetition frequencies can distinguish slower flows from faster ones, and hence 1.3 kHz (range, ±9.6 cm/sec) was used for patient 1. However, the same choice for patient 2 would have led to aliasing at the entrance of the aneurysmal sac, since the flow was rushing into the sac at a high speed. Thus, a higher pulse repetition frequency of 2.0 kHz (range, ±15.0 cm/sec) was employed. A wall filter of 31 Hz corresponds to 0.5 cm/sec high pass filtering, meaning that all Doppler signals <0.5 cm/sec are dropped to remove low-frequency noise. The flow profiles obtained from ultrasonography were then compared with the CFD estimations.

Computational fluid dynamics (CFD) simulations and pulse-wave Doppler spectrograms of patient 1 and patient 2 before and after Pipeline embolization device deployment.
The simulations and spectrograms show the velocity field at different points near and inside the aneurysm. S1 through S4 represent four quadrants within the aneurysmal sac. The flow waveforms and amplitudes of the velocity field obtained by pulse-wave Doppler ultrasonography at the inlet and outlet vessels, as well as the four quadrants of the aneurysm, are consistent with computer simulation results for both patients. Preop, preoperative; Postop, postoperative; ICA, internal carotid artery; MCA, middle cerebral artery; PComA, posterior communicating artery; pICA, proximal internal carotid artery; dICA, distal internal carotid artery.
Results
Simulations with CFD
In patient 1, a major portion of the inlet flow entered straight into the aneurysmal sac before PED treatment, as the inlet ICA was almost perpendicular to the plane of the neck of the aneurysm. In patient 2, who had a side-wall aneurysm, the inlet flow impinged on the distal neck of the sac, created a pattern of streamline separation, and generated a vortical flow inside the aneurysm cavity. Inside both aneurysms, the velocity fields decelerated in the ascent phase (Fig. 3, S1-2) and changed direction in the descent phase (Fig. 3, S3-4).
After PED treatment, the flow patterns in both models were altered drastically. In patient 1, the mean volume flow rate into the aneurysm was decreased by 90% from 598.2 mm3/sec to 59.9 mm3/sec. The maximum shear stress in the aneurysm wall was reduced from 18.0 N/m2 to 14.5 N/m2, while the maximum pressure was reduced from 124.6 mm Hg to 123.6 mm Hg. For patient 2, the mean volume flow rate into the aneurysm dropped by 85% from 201.8 mm3/sec to 30.1 mm3/sec. The maximum wall shear stress was reduced from 33.0 N/m2 to 24.8 N/m2, while the maximum pressure remained at 120.0 mm Hg (Table 1). The mean volume flow rate was calculated as the absolute value of the influx volume, as the aneurysm is a blind sac and the mass of fluid must be conserved.
Validation with Ultrasonography
The hemodynamic profiles produced through CFD simulations closely matched the corresponding flow profiles obtained from ultrasonography measurements in the physical aneurysm models, both before and after PED treatment. For patient 1, the mean and standard deviation of the peak systolic velocity measured with pulse-wave Doppler ultrasonography at the inlet ICA and the first quadrant of the aneurysm (S1) before PED treatment were 37.3±2.6 cm/sec and -4.3±1.2 cm/sec, respectively. The corresponding results from CFD simulations were 38.2 cm/sec and -3.5 cm/sec at the same locations. After PED treatment, the peak systolic velocity in the ICA and the first quadrant of the aneurysm were 37.9±2.4 cm/sec and 1.8±0.8 cm/sec, concurring with CFD predictions of 39.0 cm/ sec and 1.3 cm/sec after virtual PED treatment (Table 2).

The corresponding computational fluid dynamics simulation and pulse-wave ultrasonography measurement results for patient 2 before and after virtual PED deployment
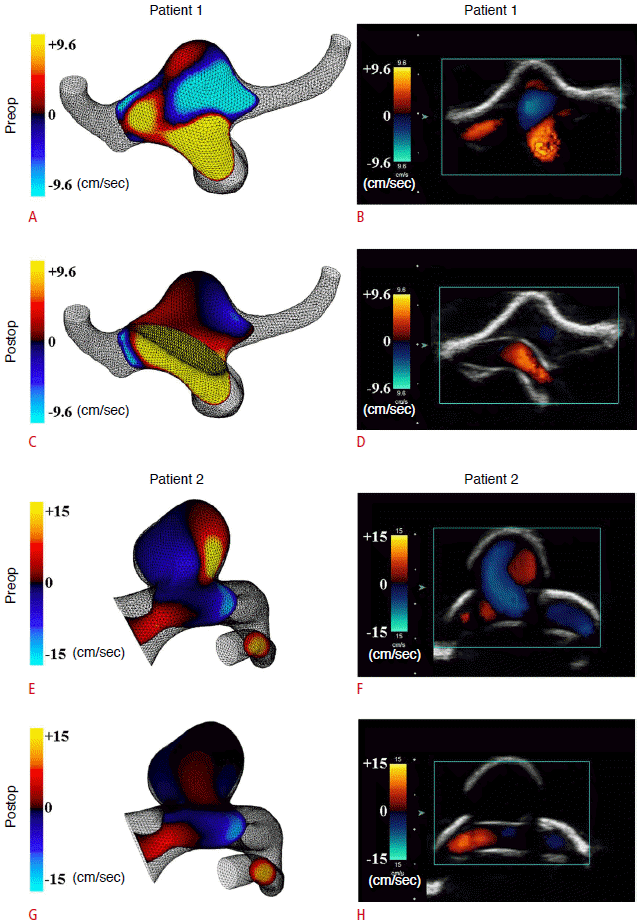
In patient 2, the measured peak systolic velocities in the inlet ICA and the first quadrant of the aneurysm before PED treatment were 36.9±1.3 cm/sec and 15.2±1.5 cm/sec, respectively, corresponding to results of 35.0 cm/sec and 15.5 cm/sec from CFD simulations at the same locations. After PED treatment, the peak systolic velocities at ICA and the first quadrant of the aneurysm became 39.6±1.5 cm/sec and <1.0 cm/sec, again concurring with CFD predictions of 35.9 cm/sec and -0.6 cm/sec after virtual PED treatment (Table 2). Similar agreements were found at the outlet vessels and all four quadrants of both aneurysms (Table 1). We can thus conclude that the flow waveforms and amplitudes of the velocity field obtained by pulse-wave Doppler ultrasonography at the inlet and outlet vessels, as well as the four quadrants of the aneurysms, were consistent with CFD results in both patients (Fig. 3). Further measurements with color Doppler ultrasonography demonstrated a marked reduction in intra-aneurysmal flow after PED deployment in both patients (Fig. 4B, D, F, H), which were qualitatively and quantitatively similar to the CFD simulations (Fig. 4A, C, E, G).

Computational velocity contour plots and color Doppler ultrasonography before and after flow-diverter treatment.
Compared to the values before treatment (A, B, E, F), the measurements taken with color Doppler ultrasonography after flow-diverter deployment demonstrate a dramatic reduction in intra-aneurysmal flow (D, H). These results are qualitatively and quantitatively similar to those obtained in the computer simulations (C, G) for both patients. Preop, preoperative; Postop, postoperative.
Discussion
We have verified the CFD-estimated hemodynamic effect of a flowdiverting stent in patient-specific aneurysms by flow measurements using Doppler ultrasonography in a realistic physical phantom model. Remarkable agreement between CFD simulations and experimental measurements was found in both the local and global flow dynamics in terms of the velocity profile and magnitude. The actual therapeutic effect of flow-diverter stents in both side-wall and bifurcation aneurysms, as measured in the vascular model, was accurately predicted by CFD simulations after virtual PED treatment using commercially available computer-aided design software.
CFD simulations have emerged as a popular technique in studying aneurysm pathophysiology and estimating treatment efficacy. Despite the growing number of publications dealing with CFD in clinical journals, clinicians have challenged the applicability of such simulations to daily practice due to the inherent limitations and assumptions of CFD modeling techniques [17]. Attempts to improve the accuracy of flow-diverter simulations in animal studies include employing patient-specific boundary conditions and precisely modeling the deployed configuration of the stent with micro-CT [18-20]. The boundary conditions are important because the flow is mainly driven by a pressure differential between the inlet and outlet(s) of the aneurysm system. The pressure inside the sac and the volume influx into the sac have no direct correlation in terms of mechanics. In a recent study, the flow-diverter effects obtained by a CFD simulation showed good agreement with digital subtraction angiography findings in experimentally created aneurysms in rabbits [21]. The present study is a unique joint CFD and ultrasonography investigation of flow alterations after flow-diverter stent treatment in patient-specific bifurcation and side-wall aneurysms. Our results provide further validation of CFD predictions in human aneurysm models treated with flow-diverting stents.
Doppler ultrasonography is familiar to most clinicians treating diseased blood vessels, with applications including the diagnosis of cerebral vasospasm [22], studies of atherosclerosis near the carotid artery [23], and the treatment of endoleaks in large vessels [24]. We utilized this technique to verify the hemodynamic changes that take place after flow-diverter treatment in realistic aneurysm models. The merits of ultrasonography include its noninvasive nature, affordability, and its potential usage in an in vivo setting. Doppler ultrasonography only provides a two-dimensional imaging plane, which limits the ability to assess the full-flow picture in a three-dimensional aneurysm. Nevertheless, with proper alignment of the measurement plane and the CFD model, ultrasound data sampling at the parent vessels and the aneurysmal sac concurred with CFD predictions remarkably well. Our experimental verification could, in principle, also be performed using velocity data obtained from transcranial Doppler studies on human subjects. Moreover, the detailed flow pattern can also be assessed using phase-contrast magnetic resonance imaging (MRI) angiography techniques, although such techniques may not be widely available in routine clinical practice.
We have thus demonstrated that, along with particle image velocimetry and laser Doppler velocimetry, which have been used in earlier in vitro aneurysm studies, ultrasonography is feasible for assessing the results of treating aneurysms with flow-diverter stents [7,8,11]. Furthermore, the present ultrasonography technique does not require an injection or placement of particles in the fluid/blood stream. With the development of flow-quantifying techniques in high frame-rate angiography or three-dimensional cine phase-contrast MRI, the in vivo study of flow dynamics before and after aneurysm treatment may lead to further clinical insights. While previous papers have employed an analogous combined computation-measurement approach to aneurysms before the placement of a flow-diverter stent [25], relatively few studies have reported on joint CFD-experimental findings after the deployment of a stent graft or a PED.
In the specific cases studied here, the mean volume flow rate across the aneurysm neck was reduced by 90% and 85% in the bifurcation and side-wall aneurysms, respectively, confirming the drastic effect of a single flow-diverter shown in previous CFD studies [26-29]. Clinically, the aneurysm of patient 2 obliterated completely 6 months after treatment, but patient 1 still had persistent filling of the aneurysm after 2 years despite a technically successful flowdiverter placement. For comparison, in a meta-analysis of 1,654 aneurysms treated with flow-diverting stents, the complete occlusion rate was 76% [2]. The predictive factors leading to flow-diverter failure remain elusive, and treatment strategies for refractory aneurysms are limited.
Advancements in patient-specific CFD simulation studies in the near future may enable clinicians to determine the best treatment for a specific patient. Chong et al. [3] compared the flow dynamics in successful and failed flow-diverter treatments, suggesting that higher post-treatment volume flow in the aneurysm was associated with persistence of the aneurysm. In contrast, Kulcsar et al. [27] studied eight aneurysms treated with flow-diverters, and found that the velocity reduction after flow-diverter placement in the failed aneurysms was similar to that found in other successfully treated aneurysms. In the present study, although the mean volume flow rate and the maximum velocity inside the aneurysm were reduced dramatically in patient 1, the aneurysm was refractory to flowdiverter treatment clinically.
The salient flow parameter in predicting treatment outcome is thus still unclear. Intuitively, a reduction in mean volume flow rate in the aneurysm corresponds to flow stagnation and aneurysm obliteration. The vortex dynamics, streamline patterns, and the pressure within the aneurysm after treatment might provide valuable clues regarding the risk of rupture [4,11]. In practice, clinical outcomes do not match perfectly with the predictions of CFD simulation; hence, further studies involving a larger cohort are needed to confirm these hypotheses. The success of this initial-phase study should encourage further works in theoretical areas such as the correlation of vortex dynamics with the clinical outcomes of various endovascular treatment strategies. Clearly, the success of flow-diverter treatment depends on other variables such as the thrombotic tendency of the blood, endothelial biology, and other factors in the microenvironment around the stentaneurysm interface that cannot be accounted for in flow analyses. Although CFD simulations may be an adequate platform to study the underlying flow dynamics, translating such knowledge to clinical decision-making is not straightforward.
Recent works have started to relax certain assumptions commonly used in CFD simulations, by, for instance, incorporating non- Newtonian effects [30,31]. The magnitude of the shear stress is affected substantially by such changes, but there does not seem to be any definitive trend regarding the flow influx into the aneurysmal sac. Further investigations are necessary to assess these findings.
In conclusion, CFD estimations of the velocity field and flow reduction in aneurysms treated with a flow-diverting stent were verified by Doppler ultrasonography measurements in patientspecific phantom models, using proper ranges of hemodynamic parameters such as density and viscosity [16,30]. This combination of CFD and ultrasonography may constitute a feasible and reliable technique for predicting flow diversion in intracranial aneurysms after flow-diverter treatment, proving again that ultrasonography is a valuable technique in the cardiovascular system as well as the gastrointestinal setting [32]. In order to establish correlations with clinical outcomes, further studies are required to identify the precise modifications in the flow and the hemodynamics after a flowdiverter stent graft or PED is deployed.
Notes
No potential conflict of interest relevant to this article was reported.
Acknowledgements
This work was supported by the Seed Funding Program for Basic Research of the University of Hong Kong, and the Government of the Hong Kong Special Administrative Region through the Innovation and Technology Fund contract ITS/011/13. We wish to thank Synapse Therapeutic Limited (Hong Kong) for donating the Pipeline embolization device used in this study.

