

 Print
Print facebook
 twitter
 Linkedin
 google+

Introduction
Severe acute respiratory syndrome coronavirus 2 infection, which causes coronavirus disease 2019 (COVID-19), has continued as a pandemic posing major health issues in many countries worldwide for over a year [1]. COVID-19 can be transmitted by droplets. It can be treated on an outpatient basis in many patients, although approximately 20% may need to be hospitalized. COVID-19 primarily involves respiratory system symptoms, which progress from mild symptoms to pneumonia and acute respiratory distress syndrome, with the risk of severe outcomes depending on patientsŌĆÖ demographic characteristics and comorbidities [2]. Lung imaging methods are important in the context of COVID-19, as the disease mainly affects the respiratory tract, and pulmonary findings are common. In addition to the conventional methods of computed tomography (CT) and chest radiography, lung ultrasonography (LUS) can be used in the diagnosis and follow-up of COVID-19 [3]. The sensitivity of CT was found to be 90%-97.2%. While the early-stage finding specific to COVID-19 is ground-glass opacity, this finding may be accompanied by interlobular septal thickening and a paving stone appearance in advanced stages [4-6].
The role of LUS during the COVID-19 pandemic has been described in various studies in the literature, which have demonstrated that it can be used for diagnosis and follow-up [7]. The main advantages of LUS over CT have been reported in the literature as its portability, the lack of a radiation dose, the ability to perform LUS without the need for auxiliary personnel, and its reproducibility [7]. The ultrasonographic findings related to COVID-19 are similar to those of viral pneumonia; however, pleural irregularities, abnormalities in B lines, and unique findings have also been detected [8]. As a result of differences in the areas observed in previous studies and the type of probe used, standardization has yet to be achieved. A few authors have presented methods and discussed the necessity of administering standard procedures [9]. Evaluation of 12- and 14-zone study areas are two prominent methods. It is thought that the 14-zone examination method can provide a more detailed examination of the posterior lung regions. The fact that pneumonia caused by COVID-19 mostly affects the lower lung regions may underscore the importance of this method [9].
The present study aimed to determine the effectiveness of two different LUS methods for the diagnosis of COVID-19 and to investigate their correlations with CT.
Materials and Methods
Compliance with Ethical Standards
This prospective, randomized, single-blind study included 65 patients who were admitted to the intensive care unit with the diagnosis of COVID-19, with approval from the ethics committee (No. 2021/01-21). Informed consent was obtained from all individual participants included in the study. All procedures performed in studies involving human participants were in accordance with the ethical standards of the institutional and/or national research committee and with the 1964 Helsinki declaration and its later amendments or comparable ethical standards.
Patients
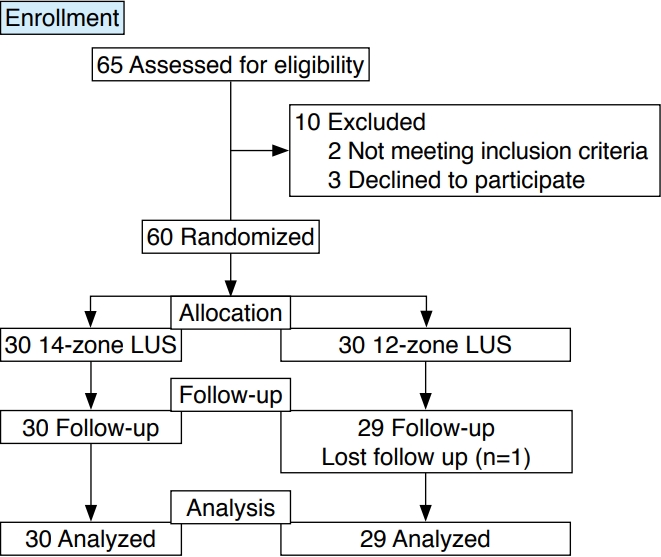
The study included patients between 18 and 85 years of age who were hospitalized in the intensive care unit, administered a reverse-transcription polymerase chain reaction (RT-PCR) test, and underwent thoracic CT due to suspected COVID-19. A medical history of lung operation, thoracic wall abnormalities, and interstitial lung disease were used as the exclusion criteria. Subsequently, 60 patients who agreed to participate in the study and provided written consent were randomized using a table of random numbers to the 12-zone (n=30) and 14-zone (n=30) groups (Fig. 1).
Radiological Evaluation: CT Procedure
CT imaging was performed on patients using a standard method in the supine position with a 128-row detector (120 kVp, with a reference mAs setting of 81, a range of 1.0-1.5, and a collimated width of 0.625-1.0 mm) (SOMATOM Definition AS+, Siemens Healthineers, Erlangen, Germany) [10]. The evaluation of thoracic CT was reported by the radiology department, unaware of the LUS findings, and it was scored by physicians in the Anesthesiology and Reanimation clinic (DKY, ES, and CSA). Thin-section CT was used to determine the CT scores [11]. Individual calculations were made for each lung lobe. During the calculation, the finding of no lesions was scored as 0% (0 points,) the presence of lesions involving 1%-5% of the lobe was scored as 1 point, the presence of lesions involving 5%-25% of the lobe was scored as 2 points, the presence of lesions involving 25%-50% of the lobe was scored as 3 points, the presence of lesions in more than half of the lobe (50%-75%) was scored as 4 points, and the presence of lesions in more than 75% of the lobe was scored as 5 points. Calculations were made for each lung lobe, the right and left lungs, and both lungs [11].
LUS Protocol
LUS was performed with a convex ultrasound probe (2-6 MHz) after protective measures were taken by the researcher, who was experienced in lung ultrasonography. The period of time between LUS and CT was 12 hours. The specialist who performed the LUS, did not have information about laboratory test values, the medical history of the patient, the results of the CT scan results, or the results of the RT-PCR test.
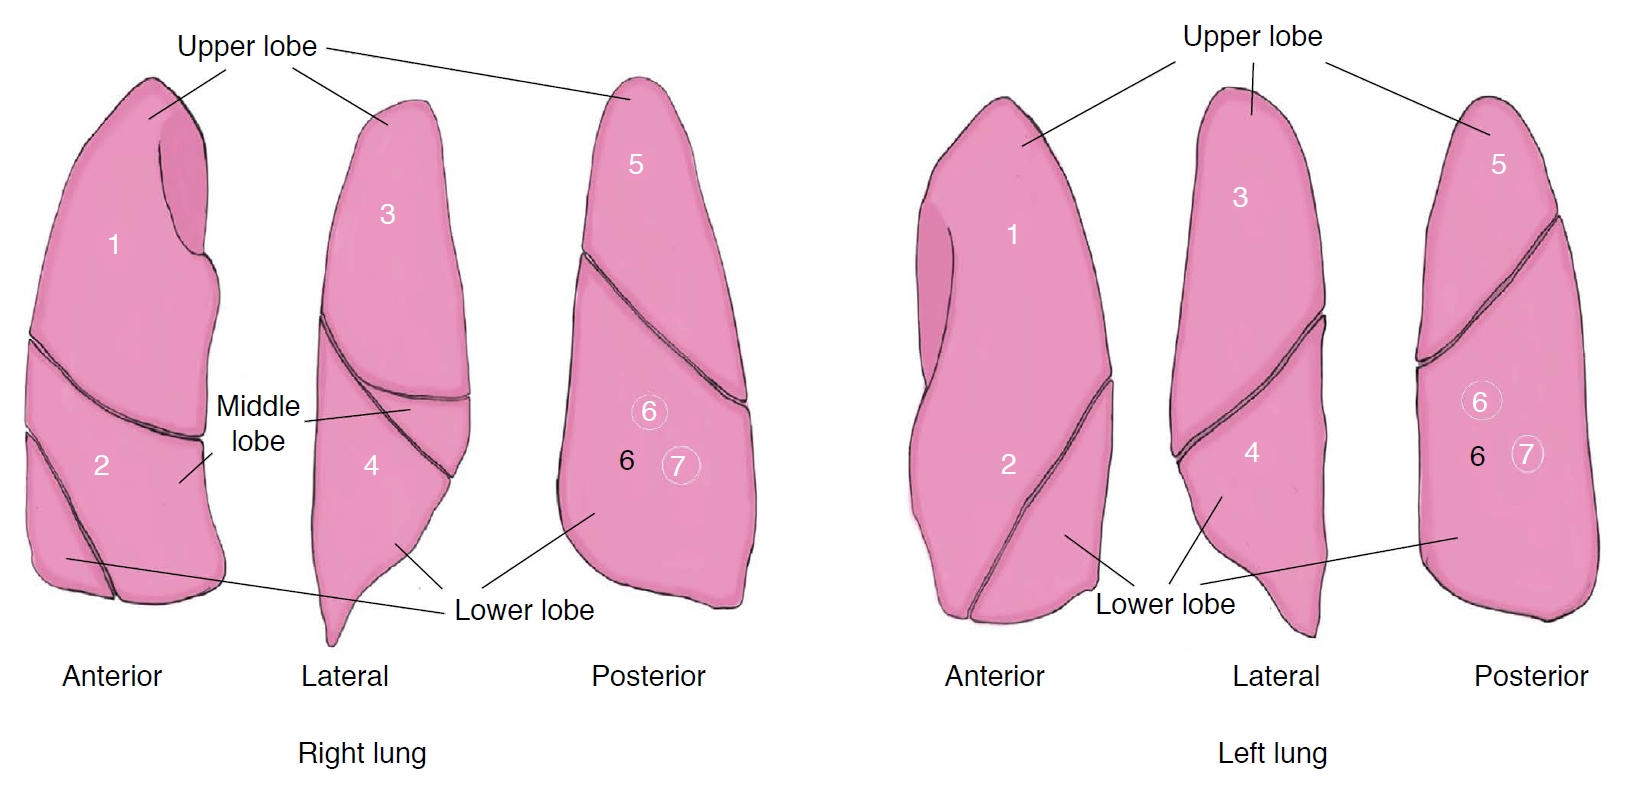
The examination of the 12 zones consisted of a 12-zone protocol including six zones in the right lung and six zones in the left lung, as previously defined [12] (Fig. 2, Supplementary Data 1). The measurements involved zones 1, 3, and 5 for the right upper lobe LUS score, zones 2 and 4 for the right middle lobe LUS score, zones 4 and 6 for the right lower lobe LUS score, zones 1, 3, and 5 for the left upper lobe LUS score, and zones 2, 4, and 6 for the left lower lobe LUS score.
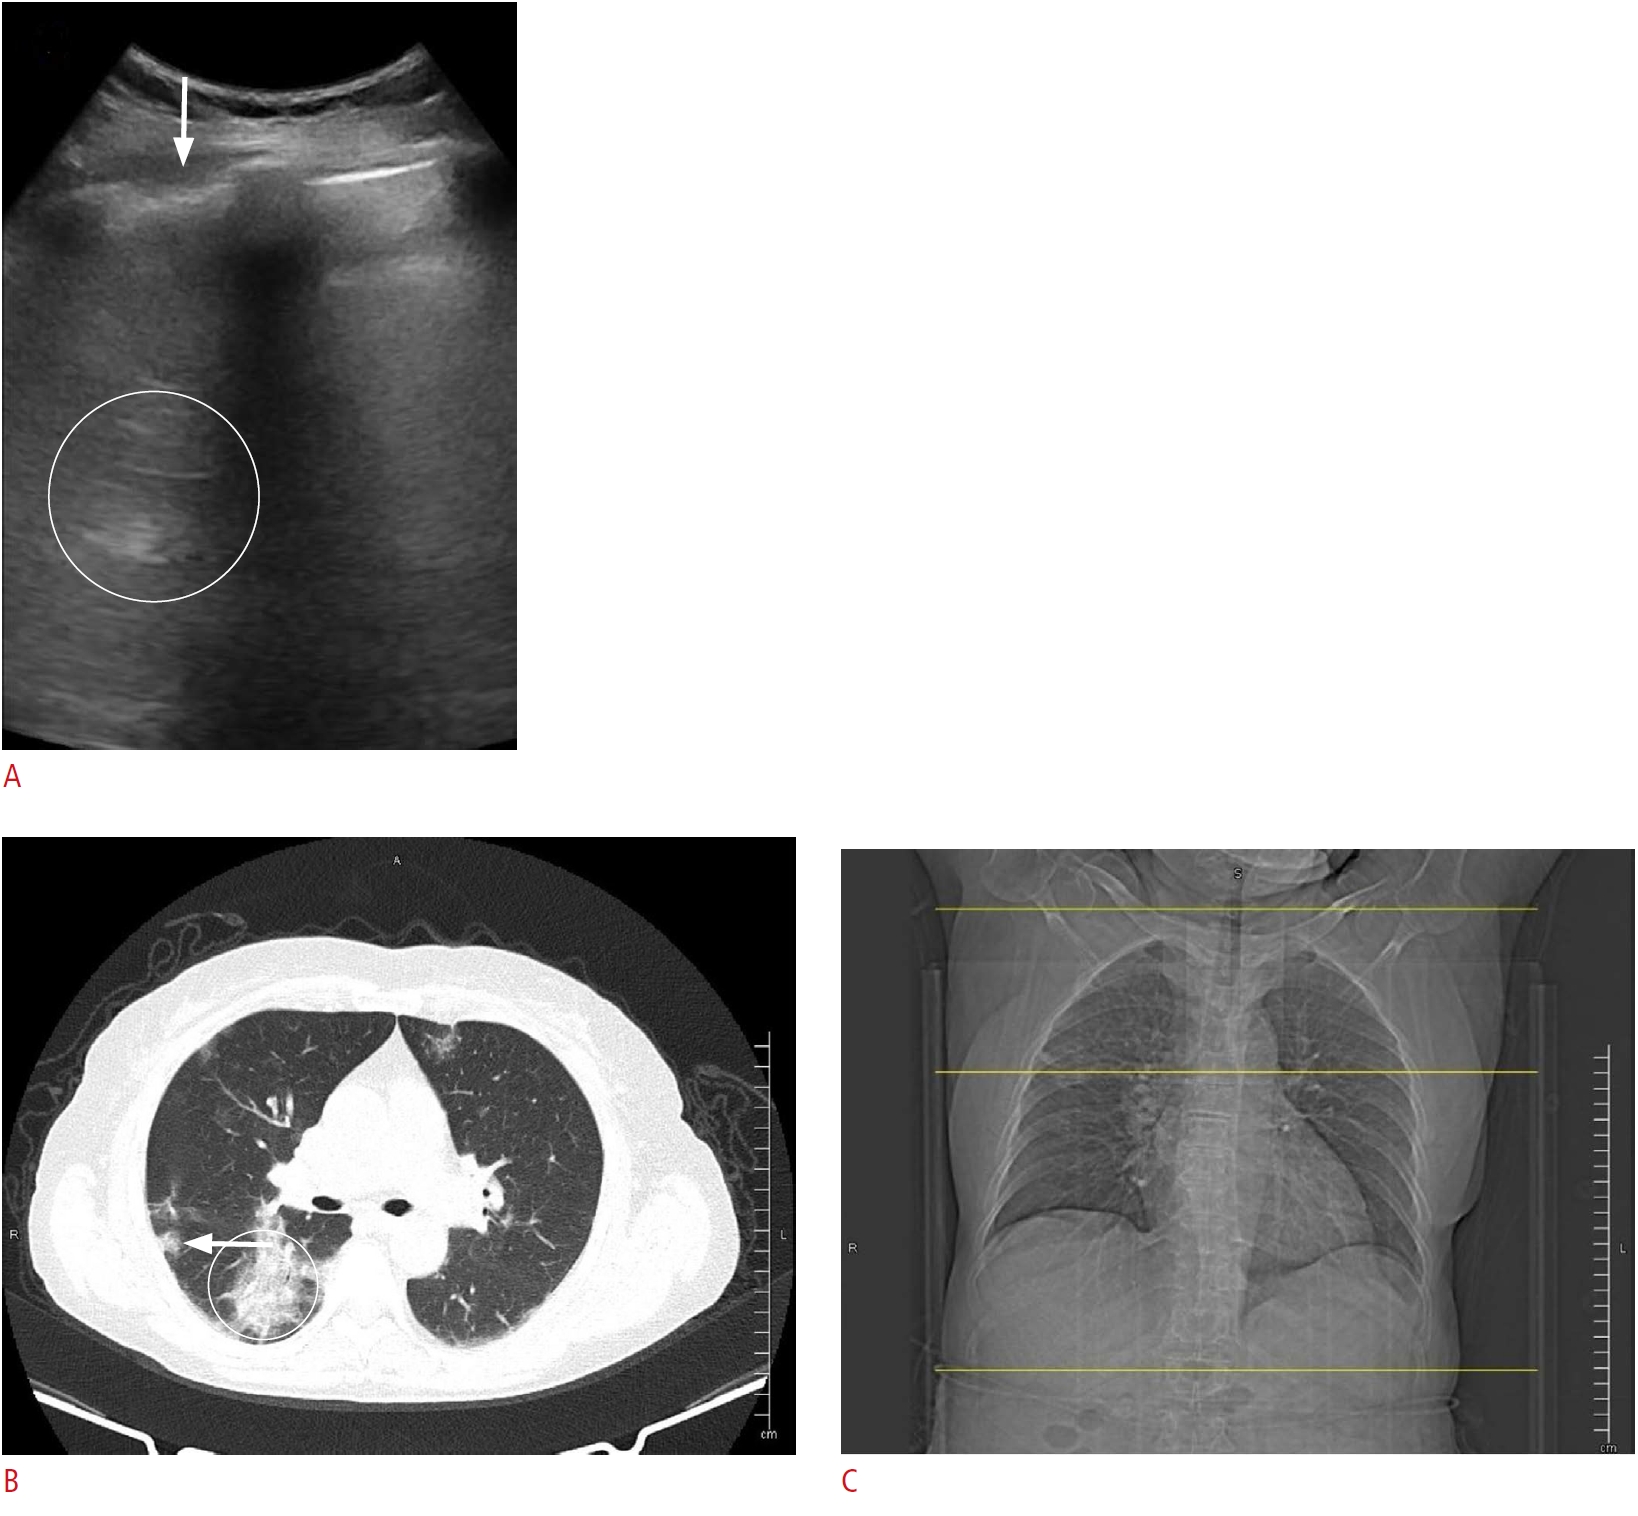
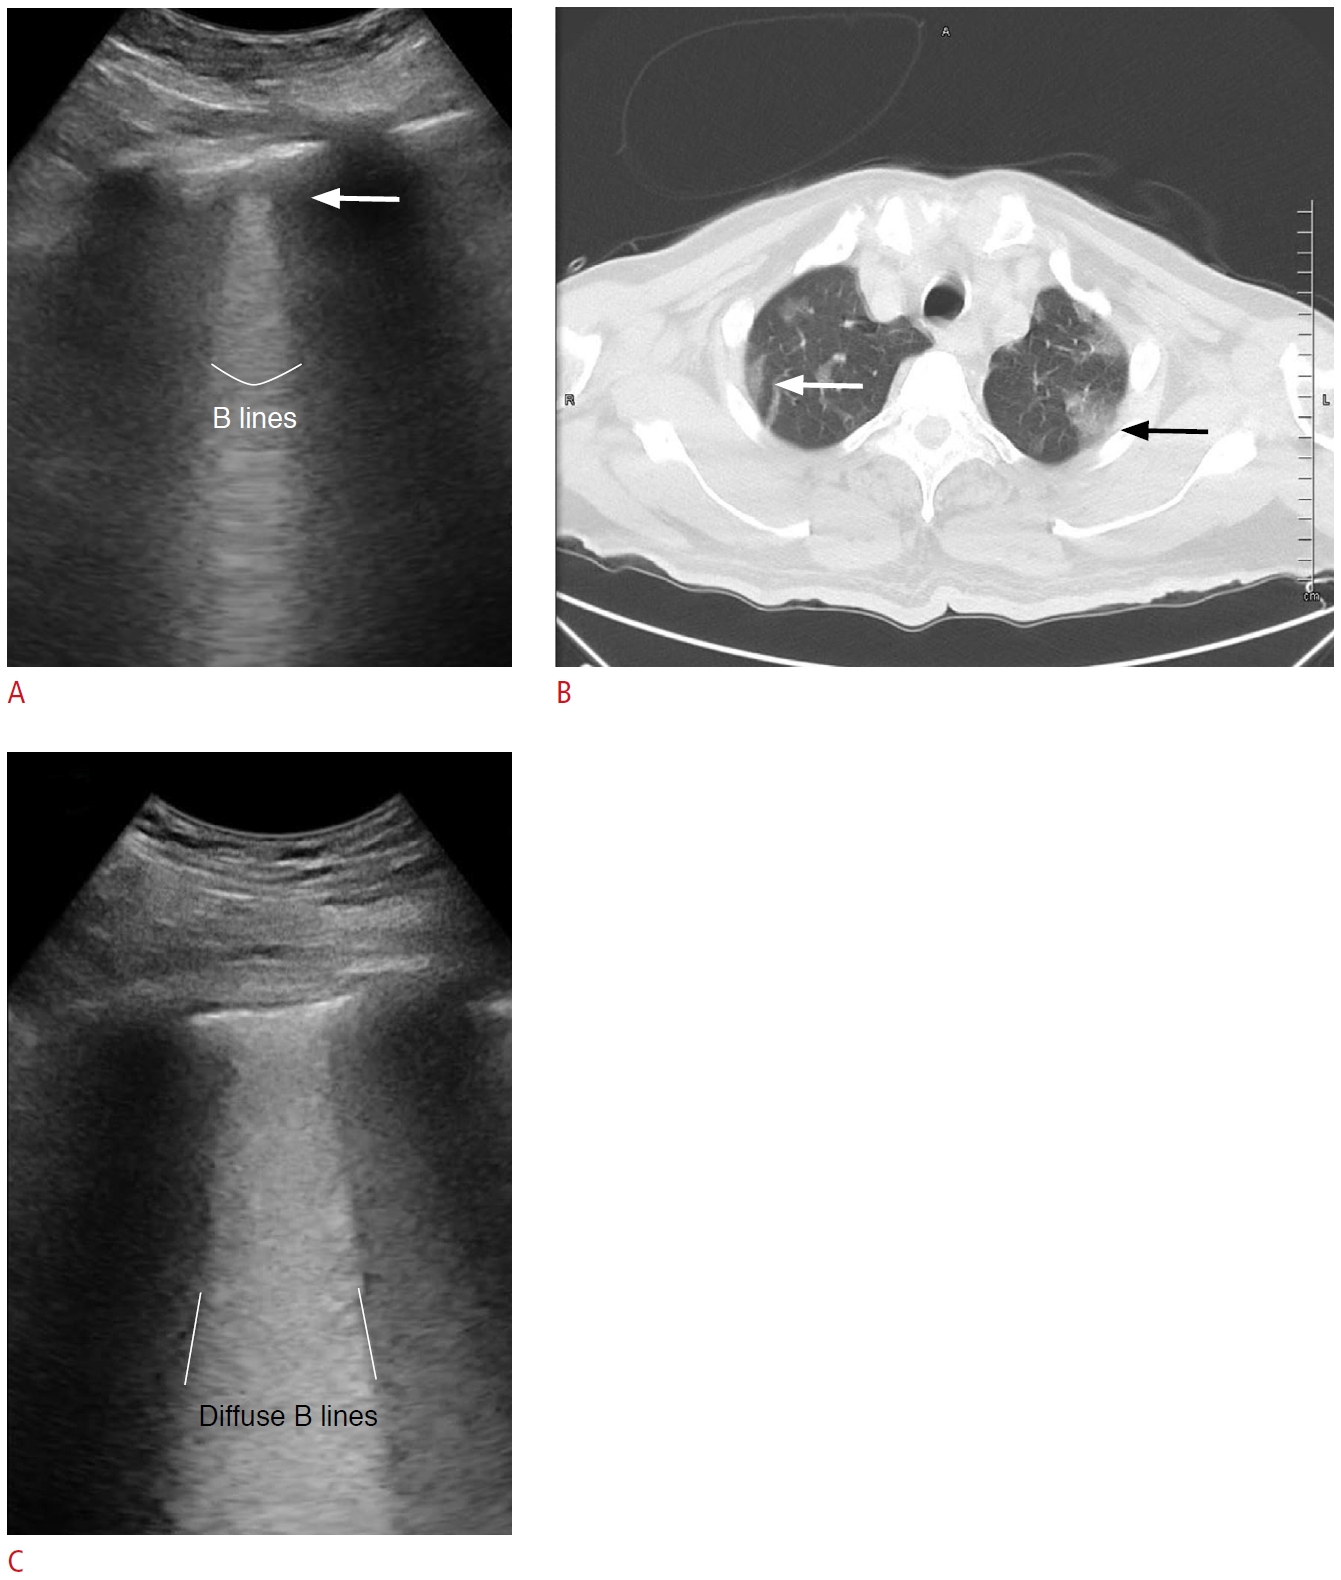
The examination of the 14 zones consisted of a 14-zone protocol including seven zones in the right lung and seven zones in the left lung [9] (Fig. 2, Supplementary Data 1). The measurements involved zones 1, 3, and 5 for the right upper lobe LUS score, zones 2 and 4 for the right middle lobe LUS score, zones 4, 6, and 7 for the right lower lobe LUS score, zones 1, 3, and 5 for the left upper lobe LUS score, and zones 2, 4, 6, and 7 for the left lower lobe LUS score. Pleural lines, B lines, consolidations, pleural effusion, and all abnormal findings were recorded during the examination of each zone. A score between 0 and 3 was given for each zone. In scoring, A lines and less than three B lines were scored as 0 points, conjoined B lines in less than 50% of the intercostal region were scored as 1 point, B lines (white lung) covering more than 50% of the intercostal region was scored as 2 points, and the detection of consolidation or pleural effusion was scored as 3 points (Figs. 3, 4) [13].
Outcome Measures
The primary outcome measure was the correlation between the results of LUS and thoracic CT. The secondary outcome measures were the characteristic features of the findings on thoracic CT and LUS, as well as correlations between physical examination findings (Acute Physiology and Chronic Health Evaluation II score) and laboratory results (ferritin, C-reactive protein, saturated oxygen [%], and lymphocyte count) with the LUS score.
Statistical Analysis
Data are presented as mean┬▒standard deviation, and categorical data are presented as percentages. The distribution of the data was evaluated using the Shapiro-Wilk test. The independent-samples t-test was used for comparing the normally distributed data. The Pearson correlation test was used to evaluate the correlations between LUS scores and CT scores. The relationship was considered significant if the P-value was <0.05. SPSS version 22.0 (IBM Corp., Armonk, NY, USA) statistical software was used for data analysis.
Power Analysis
In studies that previously evaluated 12 zones of the lung, a strong correlation of 0.85 was found between the LUS score and the CT score [10]. Considering a bilateral value of ╬▒=0.05 and a power of 85%, the number of patients required to detect a 10% difference between group correlations was determined to be 58. It was planned to enroll 60 patients in the study, anticipating the possibility of some deaths during the study.
Results
The study was completed with a total of 59 patients (14-zone examination group, n=30; 12-zone examination group, n=29) (Fig. 1), since one patient in the 12-zone examination group died before LUS was performed. The demographic characteristics, physical examination findings, and laboratory results of the patients are presented in Table 1. There was no statistically significant difference in the values between the groups (P>0.05). All patients were classified as having been diagnosed with COVID-19 based on RT-PCR, CT, and clinical findings before hospitalization.
When the thoracic CT results were examined, bilateral lung involvement was found in 54 patients and single lung involvement in five patients (three patients with right lung involvement, two patients with isolated left lung involvement). The CT and LUS findings of the 12-zone and 14-zone study groups are presented in Table 2. There were no statistically significant differences between the groups in terms of the lesion types detected in patients using P>0.05. The total CT score of 59 patients included in the study was calculated as 11.9┬▒6.3. The total CT score of the left lung was found to be significantly lower in the 14-zone examination group (3.9┬▒2.5) than in the 12-zone group (5.8┬▒2.9, P=0.013) (Table 3). The CT score of the left lower lobe was found to be significantly lower in the 14-zone examination group than in the 12-zone group P=0.019 (Table 4). The correlations between the CT and LUS scores, both for the total scores and for each of the lung lobes, are presented in Tables 3 and 4. Moderate and high correlations were found between the CT and LUS scores in the 12-zone and 14-zone examination groups, respectively. The left lower lobe CT and LUS scores were highly correlated in the 14-zone group (P<0.001, r=0.902). The physical examination and laboratory results were moderately and strongly correlated, respectively, with the LUS score in both groups (P<0.05) (Table 5).
A receiver operating characteristic curve analysis showed that the area under the curve (AUC) for LUS was higher than that for RT-PCR for the detection of CT abnormalities in both groups. In the 12-zone group, the AUC of LUS was 0.895 (95% confidence interval [CI], 0.711 to 1.000; P<0.001), while that of RT-PCR was 0.703 (95% CI, 0.457 to 0.949; P=0.132), and in the 14-zone group, the AUC of LUS was 0.908 (95% CI, 0.746 to 1.000; P<0.001), while that of RT-PCR was 0655 (95% CI, 0.412 to 0.899; P=0.132) (Fig. 5).
For the total CT scores, inter-observer variability showed good consistency, with an intraclass correlation coefficient of 0.968 (95% CI, 0.933 to 0.985).
Discussion
A moderate and high degree of agreement was found between LUS and thoracic CT scores using 12 and 14 zones, respectively. The ground-glass appearance detected on CT can be screened for using both imaging protocols with findings such as pleural lines and B-line abnormalities in LUS.
Three major radiological methods can be used in the diagnosis and follow-up of COVID-19 pneumonia. Among these methods, the routine use of chest radiography has not found a major place in clinical practice during the pandemic, since it has weaknesses in the early-stage diagnosis of COVID-19 [14]. CT, the second method, is considered to be the most sensitive technique for diagnosing the disease at an early stage, evaluating the size and morphology of the detected lesions, and identifying small lesions that cannot be detected on chest radiography [15]. LUS, as the third method, has been reported to have a high sensitivity for diagnosing pulmonary interstitial involvement associated with COVID-19 [16,17]. When compared to CT, the main reason for its high sensitivity is thought to be the ability of LUS to detect the subpleural lesions in COVID-19 pneumonia, especially involvement in the lower and middle lobe of the lung [16,17]. In the literature, studies have used the BLUE protocol and modified versions of LUS in the diagnosis and follow-up of pulmonary involvement of COVID-19 [8]. The differences in the examination zones used in these protocols are noteworthy. Similar results were obtained in studies of LUS examinations performed with different protocols in previously defined zones of the lung. Methods involving 8, 10, 12, and 14 zones have been used to examine the anterior, lateral, and posterior lung areas in the thoracic wall [8,9,16,17].
Dacrema et al. [18] used a rapid and simplified scanning method referred to as LUSCOP, which includes six regions (apex, middle, and basal), to evaluate 130 patients. They reported an achievement rate of 99.2% in identifying COVID-19 pneumonia [18]. Other research using the 12-zone examination method compared the diagnostic success of LUS to CT [19]. The mean LUS score was determined to be 10.6 in a study that included 51 patients. In the same study, the CT score was calculated as 7.48, and its correlation with the LUS score was found to be 0.803. The researchers reported that the LUS findings observed in their study included pleural line and B-line abnormalities, similar to the results of other studies [19]. In a study using the same number of examination zones in intensive care patients, the correlation between LUS scores and CT scores was 0.87, and it was found that there was a good degree of agreement [20]. In addition, the researchers reported that LUS yielded similar results regardless of whether six or 12 zones were evaluated. Although these results need to be confirmed, the researchers stated that the results were similar to data in the literature and the results of studies using the BLUE protocol [20]. Due to the presence of studies in the literature using different methods of examination, Soldati et al. created a LUS protocol with the aim of developing international standardization and presented their opinions about a 14-zone imaging method as part of their protocol. It was emphasized that the imaging method should definitely include the posterior regions, since the posterior lung is more extensively involved in COVID-19 pneumonia [9]. Mento et al. investigated the results of different protocols when administered to the same patients. They analyzed the results of LUS protocols involving 4, 8, 12, and 14 zones in data obtained from 88 patients, who had been diagnosed with COVID-19, and reported that the 12-zone LUS protocol achieved a good balance between the duration of the procedure and accuracy. They found that the inclusion of posterior areas in the protocols increased the level of agreement between the modified systems. As mentioned in the literature, they emphasized the importance of examining the posterior areas in order to detect important findings in patients with COVID-19 [21]. A study analyzing a protocol using 14 landmarks during the admission and follow-up of intensive care patients reported that this protocol could be used in intensive care units to predict the clinical course of COVID-19 pneumonia and decide upon a treatment strategy [22].
In the present study, a score was calculated for each lobe by matching the lung lobes with the imaging zones. The authors suggest that this strategy enabled a more detailed examination of the scores and lesions of each lobe. The 14-zone examination has a greater scope for the evaluation of the lesions in the lower lobe of the lung. The higher incidence of COVID-19 pneumonia in the lower lung lobes is the reason why this method is advantageous [9]. In addition, despite the lower CT scores detected in the left lower lobe in patients who underwent 14-zone examinations, higher correlation values were found with the LUS scores in the same zones. This finding supports the view that has been presented in the literature that reducing the number of imaging zones in patients affected by COVID-19 would increase the probability of missing important findings [23,24]. In diseases with a high risk of transmission such as COVID-19, the balance between the duration of the procedure and the level of data collection during LUS can make it difficult for clinicians to decide which protocol to use. We believe that further data will clarify the principles of the LUS procedure over time.
The fact that LUS examinations were performed only during hospitalization led the researchers to select only patients diagnosed with COVID-19 who were receiving treatment in the intensive care unit. The limitations of this study include the general weaknesses of ultrasonography such as its technical characteristics, the variability depending on the specialist responsible for performing LUS, and the use of only a convex probe during the examination. In addition, since LUS was performed one time in each patient by a single user, the inability to measure intra- and inter-observer variability is a limitation.
The results of our study indicated that the two different LUS examination methods performed in different patients had similar findings in terms of the diagnosis and their correlations with CT results. Extensive data in the literature have been reported regarding the role of LUS in the diagnosis of pneumonia associated with COVID-19. The authors suggest that the method to be selected and the procedure will become clearer with further studies and the inclusion of learning-based systems [11].

 Download Citation
 PDF Links
 PubReader
 ePub Link
 Full text via DOI
 Full text via PMC


