

 Print
Print facebook
 twitter
 Linkedin
 google+

Introduction
Kidney transplantation is the best possible treatment option for end-stage renal disease [1,2]. As the shortage of donors becomes more severe, kidney transplantation using expanded-criteria donors (ECDs) or marginal donors has been introduced to address the organ shortage. However, this practice leads to an increase in the incidence of delayed graft function (DGF) or graft primary non-function, and affects patients’ long-term survival [3]. A reliable and valid pre-transplant organ quality assessment to minimize unnecessary discards and maximize graft and patient survival has thus become an urgent priority. The Kidney Donor Risk Index (KDRI) is the most widely used model to predict graft survival [4]. The Kidney Donor Profile Index (KDPI), based on the KDRI, has been implemented in the new Kidney Allocation System since 2014 and has become the most validated scoring system for assessing individual kidney risk in deceased donors in the United States [5]. However, because this score is highly dependent on donor age, the KDPI label may lead to inappropriate and almost automatic discarding of kidneys with a high KDPI, potentially even an increased incidence of DGF. Indeed, the discard rate has not changed compared to that of the "ECD" era [6,7], and the validation results outside North America have not been satisfactory [8].
Contrast-enhanced ultrasonography (CEUS) is a safe, convenient, and cost-effective imaging modality that uses microbubbles to enhance tissue perfusion detection at the microvascular level; therefore, it is widely used in clinical specialties. CEUS enables an accurate assessment of renal microvascular perfusion dynamically in real time [9], and allows a quantitative assessment of perfusion in selected areas by generating time-intensity curves (TICs). Studies have shown that early CEUS after kidney transplantation predicts early acute rejection, DGF, long-term renal function, and the degree of pathological damage [10-13]. However, CEUS was performed post-transplantation in those studies, while CEUS performed on cadaveric donor kidneys pre-procurement to predict recipient prognosis post-transplantation has not been reported. In addition, renal perfusion observed on CEUS provides information for the detection of early renal injuries in certain renal diseases (e.g., diabetic nephropathy) [14,15]. Therefore, the hypothesis of this study was that CEUS would be able to assess early graft function pre-procurement in kidney transplantation from donors after brain death.
The purpose of this study was to quantify microcirculatory perfusion in brain-dead donor kidneys using CEUS, and to develop a model to predict early graft function in kidney transplantation.
Materials and Methods
Compliance with Ethical Standards
The protocol for this prospective, single-center study was approved by the local Institutional Review Board (Ethics Committee of Zhongshan City People's Hospital [ID: K2019-058]) and complied with the revised Declaration of Helsinki. All donors' families were informed of the procedure and possible risks 24 hours prior to the examination and provided signed informed consent. All recipients also provided signed informed consent.
Study Design and Sample
In this prospective study, kidney donors maintained in the organ procurement organization of the authors’ center from August 2020 to November 2022 were recruited (Fig. 1). The inclusion criteria were brain-dead donors. Kidney donors from August 25, 2020 to June 13, 2022 were recruited for the training group. CEUS was performed in all donors 24 hours prior to organ procurement, with a total of 64 donor kidneys examined. Two kidneys were excluded due to pathology suggestive of severe hypertensive nephropathy, and two kidneys were excluded due to a final refusal to donate. The validation group included 32 donor kidneys from June 15, 2022 to November 24, 2022. One kidney was excluded due to pathology suggestive of glomerulosclerosis, and one kidney was excluded due to renal hilar ectropion malformation. The validation group underwent the same studies as the training group. The remaining patients were divided into DGF and non-DGF groups based on early post-transplant graft function, with DGF defined as the use of dialysis therapy in the first postoperative week [16,17]. Patients with stage 5 chronic kidney insufficiency were scheduled to undergo kidney transplantation. All kidney transplants were performed by a surgeon (C.G) with decades of experience.
Ultrasound Examinations
CEUS was completed for all kidneys within 24 hours prior to organ procurement. The donor was placed in the supine position for ultrasound examination, and all examinations were performed using a Philips ultrasound machine (EPIQ5, Philips Corp., Reedsville, PA, USA) and a convex transducer C5-1 ultrasound probe. All ultrasound images were analyzed by two radiologists, each with more than 10 years of experience in CEUS (Y.X. and X.L.). The primary gain, focus position, temporal gain compensation, and other preset values were kept constant while performing CEUS. The machine index was set to 0.06L and 0.75F. The longitudinal section of the kidney was chosen as the fixed section for CEUS. After preparing the contrast agent sulfur hexafluoride microbubbles for injection (SonoVue, Bracco Imaging B.V., Amsterdam, Netherlands) according to the manufacturer’s instructions, 2.4 mL was pushed through a new cephalic vein and 5 mL of saline was used to flush the tube after each push. Following the injection of SonoVue, the patient was disconnected from the ventilator (45-60 seconds), and the CEUS images were recorded immediately for 3 minutes. The whole process was assisted by intensive care unit doctors and nurses. CEUS was performed on the right kidney first, followed by the left kidney at an interval of 30 minutes. Fast Fourier transform (FFT) analysis of Doppler ultrasound signals and measurement of kidney size were performed before CEUS. The largest coronal section of the kidney was used as the standard section to measure the length, width, and cortical thickness. The peak systolic maximum velocity, end-diastolic flow velocity, and resistance index of the kidney segmental artery (KA) were measured in all patients. All images were stored in the Digital Imaging and Communications in Medicine (DICOM) format for subsequent analysis.
TIC Analysis
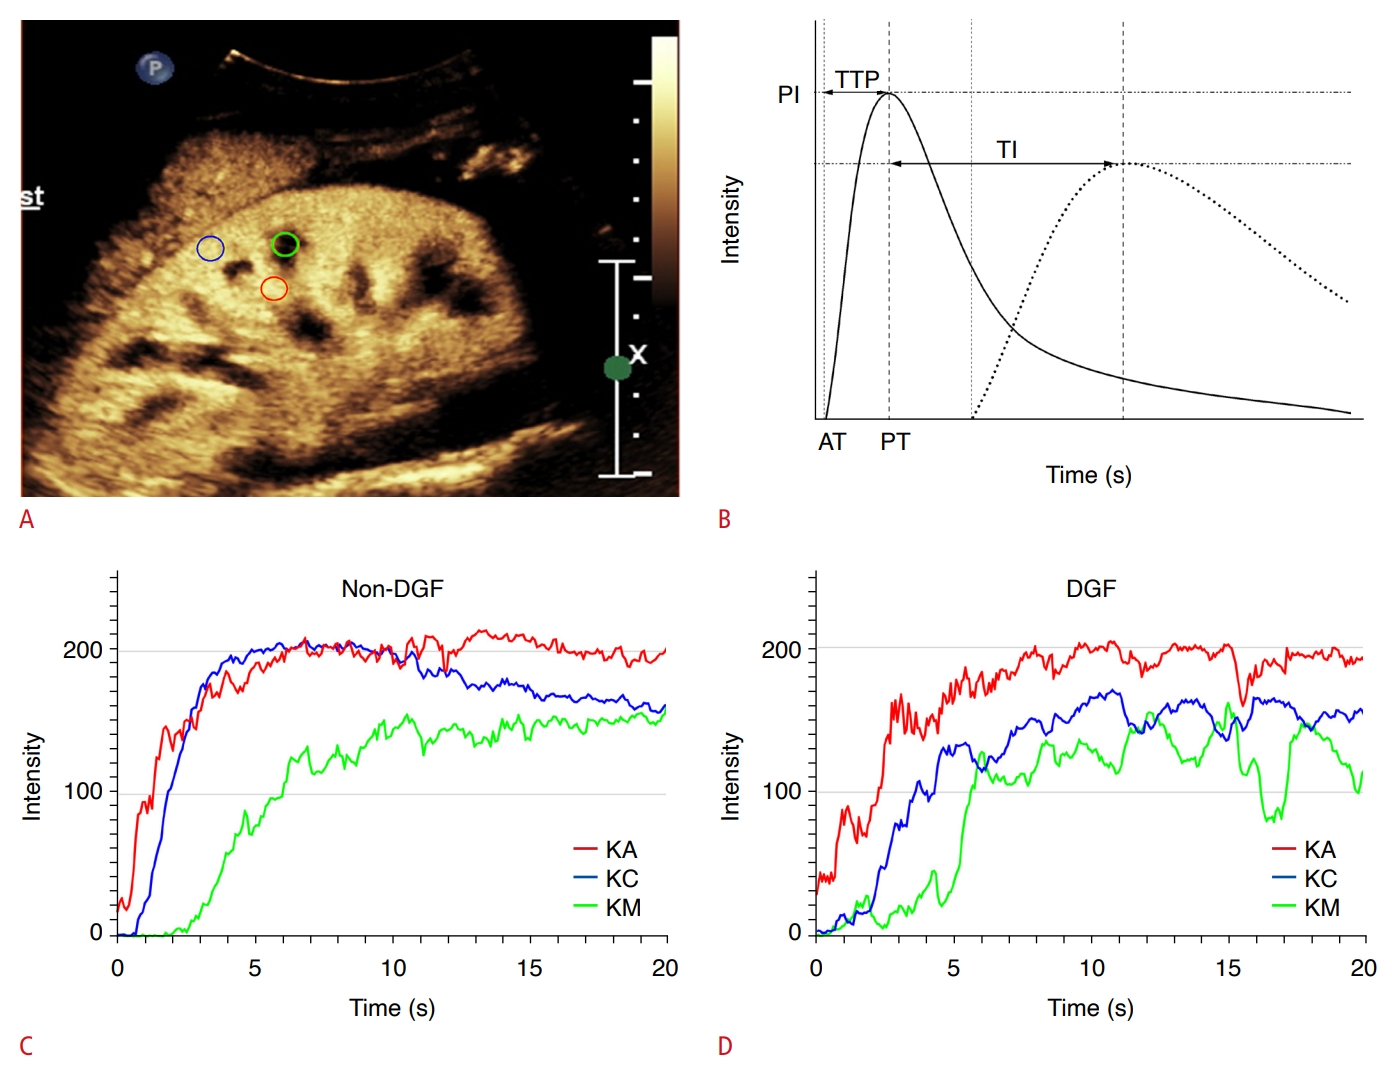
TIC analysis was performed using an offline personal computer and an image analysis software program (ImageJ, National Institutes of Health, Bethesda, MD, USA). First, images saved in the DICOM format were decompressed into uncompressed Audio Video Interleave (AVI) files. In each uncompressed AVI file, the interval of each frame was 1/12 of a second. Twelve grayscale images per second were processed using ImageJ software. Contrast images were viewed frame by frame, and the time of the first echogenic microbubble observed in the kidney segmental renal artery was set as the initial time. A circular region of interest (ROI) with a diameter of 5 mm was created within the KA, kidney cortex (KC), and kidney medulla (KM) (Fig. 2A). To ensure optimal comparability, the location of the ROIs drawn had to be consistent; therefore, all ROIs were drawn at a central location (i.e., the middle third of the kidney). Intensity values were measured automatically using ImageJ, with each pixel having an intensity value expressed as a minimum of 0 and a maximum of 255. After measuring the intensity values of the ROI, a TIC with a time of 20 seconds was created using Excel (Microsoft, Redmond, WA, USA), starting from the arrival of the contrast agent at KA, and the arrival time (AT) was recorded (Fig. 2B). Time to peak (TTP) and peak intensity (PI) were evaluated according to the TIC. The time intervals (TI) between the TTP of the KA and KC [TI(KA-KC)], KA and KM [TI(KA-KM)], and KC and KM [TI(KC-KM)] were then calculated.
Statistical Analysis
Statistical analysis was performed using the R language (version 4.1.2, R Foundation for Statistical Computing, Vienna, Austria) and associated data packages. Numerical data were expressed as the mean (±standard deviation [SD]) or median (interquartile range [IQR; 25th-75th percentile]) according to the distribution of variables, and the Student t-test or Mann-Whitney U test was used to compare the differences in laboratory data and CEUS parameters between patients with and without DGF. Categorical variables are expressed as numbers (percentages), and the Pearson chi-square test or Fisher exact test was used to compare the differences between parameters. Intraobserver and interobserver agreement were assessed by calculating intraclass correlation coefficients (ICCs). Logistic regression analysis was used to identify the factors associated with DGF and to develop a predictive model. The regression model was tested for multicollinearity using the variance inflation factor (VIF), with a VIF >10 suggesting the presence of multicollinearity. If multicollinearity existed, multiple stepwise regression bidirectional elimination was used to develop a predictive model. Receiver operating characteristic curves were constructed, and the area under the receiver operating characteristic curve (AUC) was calculated to determine the predictive performance of CEUS parameters for clinical outcomes. P<0.05 was considered statistically significant.
Results
Participants’ Baseline Demographic and Clinical Characteristics
In total, 90 donor kidneys were finally included in this study (training group, n=60; validation group, n=30). In training group, the mean age of donors was 45.52±9.56 years, and the majority were men (85.7%). Sixty patients with stage 5 chronic kidney insufficiency underwent kidney transplantation. The mean age of the recipients was 45.03±12.86 years, and 41 (68.3%) were men. Multiple immunosuppressants were administered to all recipients, including tacrolimus, mycophenolate mofetil, methylprednisolone and basiliximab. Donors’ clinical background information and the most recent laboratory data before procurement for the DGF and non-DGF groups are summarized in Table 1. Clinical background information, preoperative laboratory data, and surgery-related information for the recipients are shown in Supplementary Table 1. The serum creatinine levels showed a statistically significant difference between the DGF and non-DGF groups (P<0.001). The KDPI was calculated based on the donors' clinical background information and laboratory data. The KDPI of the DGF group (median, 0.48; IQR, 0.30 to 0.57) was significantly higher than that of the non-DGF group (median, 0.25; IQR, 0.10 to 0.36; P=0.002).
Comparison of FFT and CEUS Parameters
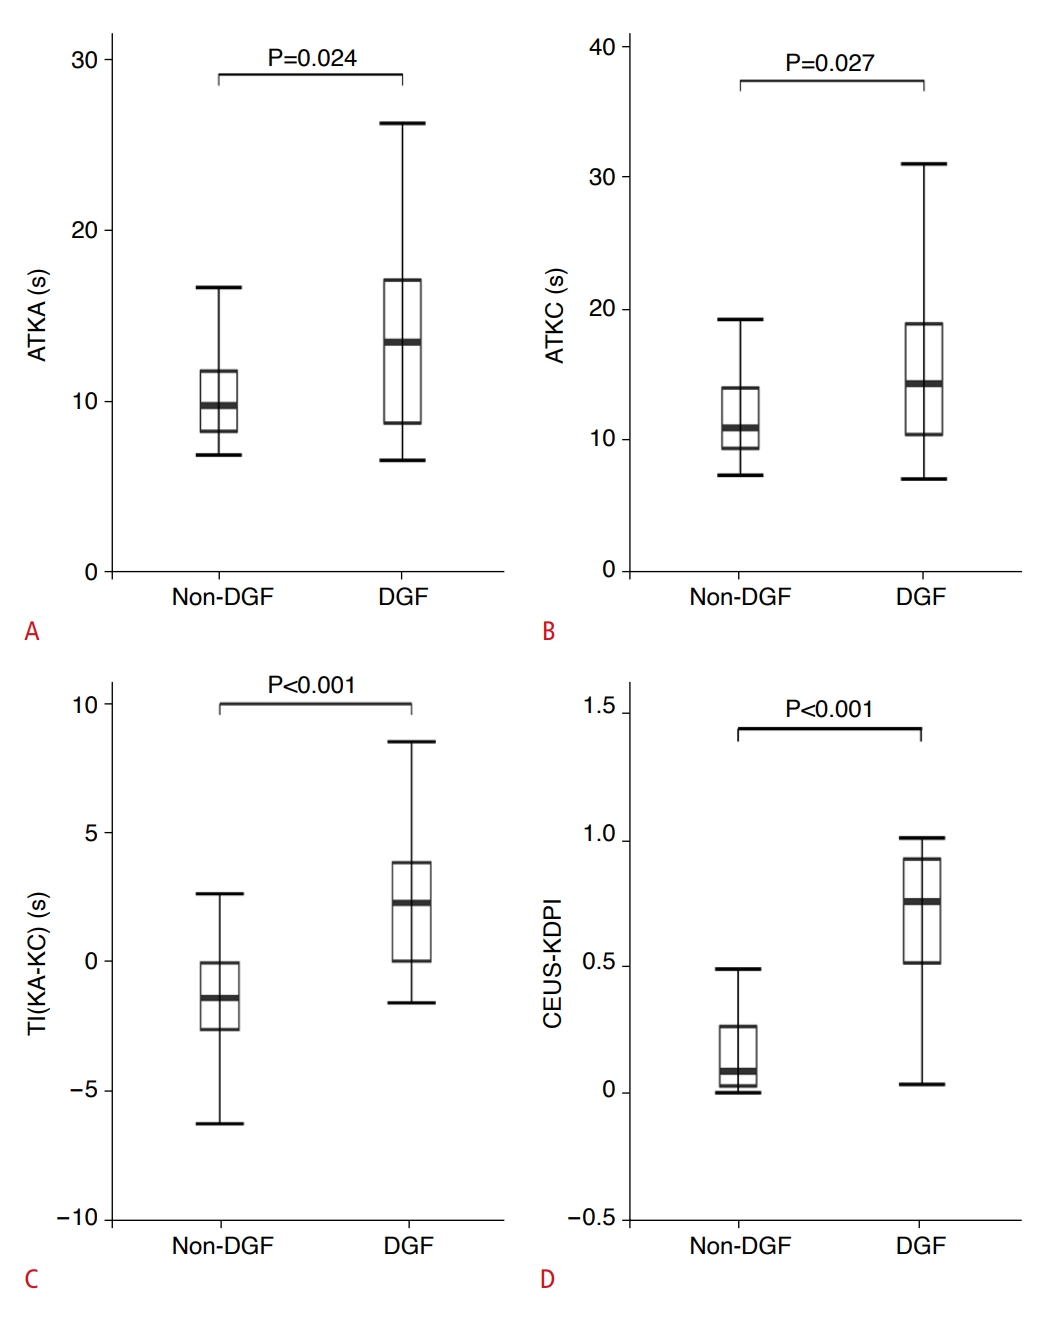
Table 2 shows the comparison of the TIC, FFT parameters, and renal size between the DGF and non-DGF groups. In the non-DGF group, ATKA (P=0.024) (Fig. 3A), ATKC (P=0.027) (Fig. 3B), ATKM (P=0.027), TTPKC (P=0.049), TI(KA-KC) (P<0.001) (Fig. 3C), and TI(KA-KM) (P=0.032) were significantly shorter than in the DGF group. Kidney segmental arterial time to peak (TTPKA; P=0.034) was significantly higher in the non-DGF group than in the DGF group. No significant differences were found in PI, FFT parameters, or renal size between the DGF and non-DGF groups.
Intraobserver and Interobserver Agreement for TIC Parameters
The intraobserver and interobserver ICCs for the TIC parameters are shown in Supplementary Table 2. The ICCs for all TIC parameters had good intraobserver agreement, except for the KM-related time parameter, which had poor interobserver agreement. All other parameters had acceptable interobserver agreement.
Predictors Associated with DGF in Univariate and Multivariate Regression Models
Univariate regression analysis identified predictors of DGF based on laboratory data and ultrasound parameters, revealing that serum creatinine (odds ratio [OR], 1.01; 95% confidence interval [CI], 1 to 1.02; P=0.006), cause of death (cerebrovascular/other) (0.31; 0.10 to 0.97; P=0.043), ATKA (1.23; 1.06 to 1.42; P=0.006), ATKC (1.17; 1.03 to 1.34; P=0.015), ATKM (1.17; 1.04 to 1.31; P=0.010), TTPKC (1.19; 1 to 1.41; P=0.047), TI(KA-KM) (1.14; 1.01 to 1.29; P=0.039), and TI(KA-KC) (1.64; 1.24 to 2.17; P=0.001) were important parameters for predicting DGF. Subsequently, multivariate regression analysis showed that TI(KA-KC) (OR, 1.58; 95% CI, 1.03 to 2.44; P=0.037) was the only independent predictor of DGF (Table 3). Multicollinearity testing suggested that multicollinearity existed in the CEUS parameters (Supplementary Table 3). Three variables were identified as independent predictors when these factors were analyzed using multiple stepwise regression bidirectional elimination: ATKA (OR, 3.22; 95% CI, 1.26 to 10.29; P=0.025), ATKC (OR, 0.34; 95% CI, 0.12 to 0.84; P=0.027) and TI(KA-KC) (1.74; 95% CI, 1.24 to 2.71; P=0.005).
A new indicator for a joint prediction model using these three variables, CEUS-KDPI, was developed based on the results of multiple stepwise regression analysis and expressed by the following equation:
z=–3.6964+1.2287ATKA–0.8919ATKC+0.6068TI(KA-KC)
CEUS-KDPI=ez/(1+ez).
CEUS-KDPI was significantly higher in patients with DGF than in non-DGF patients (median [IQR], 0.75 [0.51 to 0.92] vs. 0.08 [0.03 to 0.26]; P<0.001) (Fig. 3D).
Diagnostic Value of CEUS Parameters and KDPI for Predicting DGF
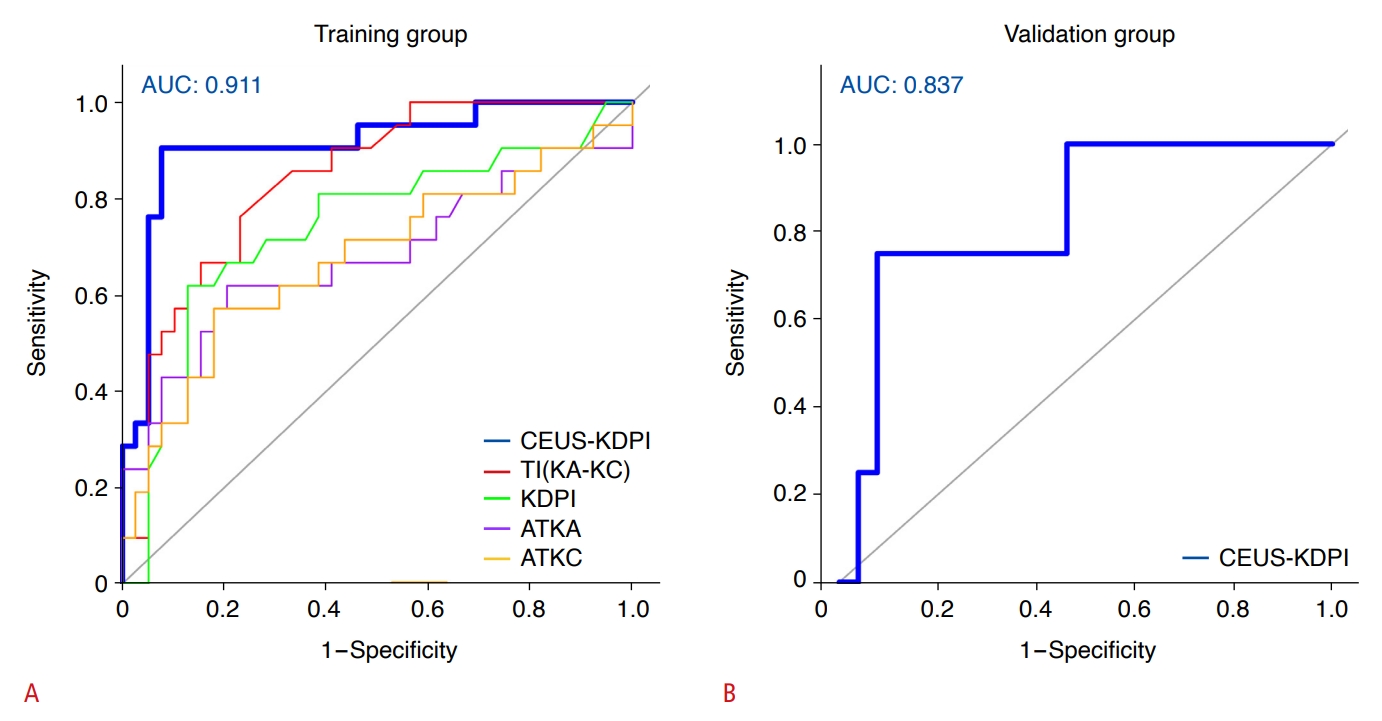
Receiver operating characteristic curves were constructed for CEUS-KDPI, three independent risk factors, and the KDPI of the donors for DGF (Fig. 4A). The AUCs of CEUS-KDPI, TI(KA-KC), KDPI, ATKA, and ATKC for predicting DGF were 0.91, 0.84, 0.74, 0.68, and 0.68, respectively (Table 4). The AUCs of CEUS-KDPI and TI(KA-KC) were significantly higher than that of KDPI, and the most appropriate cutoff value of CEUS-KDPI for predicting DGF was 0.42. The sensitivity, specificity, positive predictive value, and negative predictive value were 90.5%, 92.3%, 86.4%, and 94.7%, respectively. In addition, the Akaike information criterion (AIC) value of the multivariate optimal ensemble obtained with multivariate stepwise regression analysis was 52.003, and the AIC value of the multifactor logistic regression model was 59.023. The AIC value of the multivariate optimal set obtained by multiple stepwise regression analysis was smaller, and the AUC value was higher, indicating that the prediction performance was better.
Validation of the New Index
The clinical characteristics and CEUS parameters of participants in the validation group are summarized in Tables 1 and 2. Similar to the derivation group, TI(KA-KC) (mean±SD, -1.26±2.23 seconds vs. 1.03±1.39 seconds; P=0.038) was significantly shorter in the non-DGF group than in the DGF group. CEUS-KDPI was significantly higher in the DGF group than in the non-DGF group (median [IQR], 0.23 [0.20 to 0.32] seconds vs. 0.08 [0.02 to 0.13] seconds; P=0.033) (Supplementary Fig. 1). Finally, the AUC is shown in Fig. 4B (AUC, 0.84 [95% CI, 0.62 to 1]; P=0.020). The sensitivity and specificity were 75.0% (3 of 4 DGF cases) and 92.3% (24 of 26 non-DGF cases) when optimal cutoff values were applied (Supplementary Table 4).
Discussion
To the best of the authors’ knowledge, this is the first prospective study to quantify microcirculatory perfusion in brain-dead donor kidneys using CEUS with TIC analysis and to investigate the utility of CEUS as a prognostic indicator. The present study showed specific changes in donor kidney perfusion based on pre-procurement CEUS in patients with post-transplantation DGF compared to non-DGF patients. To date, donor kidney quality has been assessed using imaging data, including dynamic contrast-enhanced magnetic resonance imaging (MRI), contrast-enhanced computed tomography (CT), and various types of angiography [18-20]. However, the inability to perform these methods at the bedside of brain-dead donors has limited their application. In contrast, CEUS-KDPI, established for the first time in the present study, is a noninvasive, potential predictor of DGF that can be performed pre-procurement for brain-dead donor kidney transplantation.
DGF is a common early complication after deceased donor kidney transplantation, with an incidence between 5% and 50%, and it is associated with an increased risk of early postoperative acute rejection, prolonged hospital stay, and decreased long-term graft survival [17,21]. DGF is mainly due to acute post-ischemic tubular necrosis caused by ischemia-reperfusion injury before and during transplantation, with the involvement of inflammatory responses and immune factors [17,22,23]. In addition, risk factors for DGF include donor factors (e.g., age, brain-dead donor kidney, and excessive cold ischemia time, etc.) and recipient factors (e.g., male sex, body mass index >30 kg/m2, African-American race, history of diabetes, anti-human leukocyte antigen immunity, and length of pre-transplant dialysis) [24]. There are few tests or markers available to detect and predict DGF, and the risk prediction model developed by Irish et al. [25] using multivariate logistic regression analysis helps to assess the risk of DGF in the population, but does not assess individual DGF risk. Therefore, there is a need for a convenient and accurate method to detect and predict DGF. Compared to other imaging modalities, CEUS better demonstrates microvascular circulation, tubular flow, and overall renal perfusion, providing a pathophysiological basis for its ability to better characterize early post-transplant renal parenchymal disease such as DGF [26].
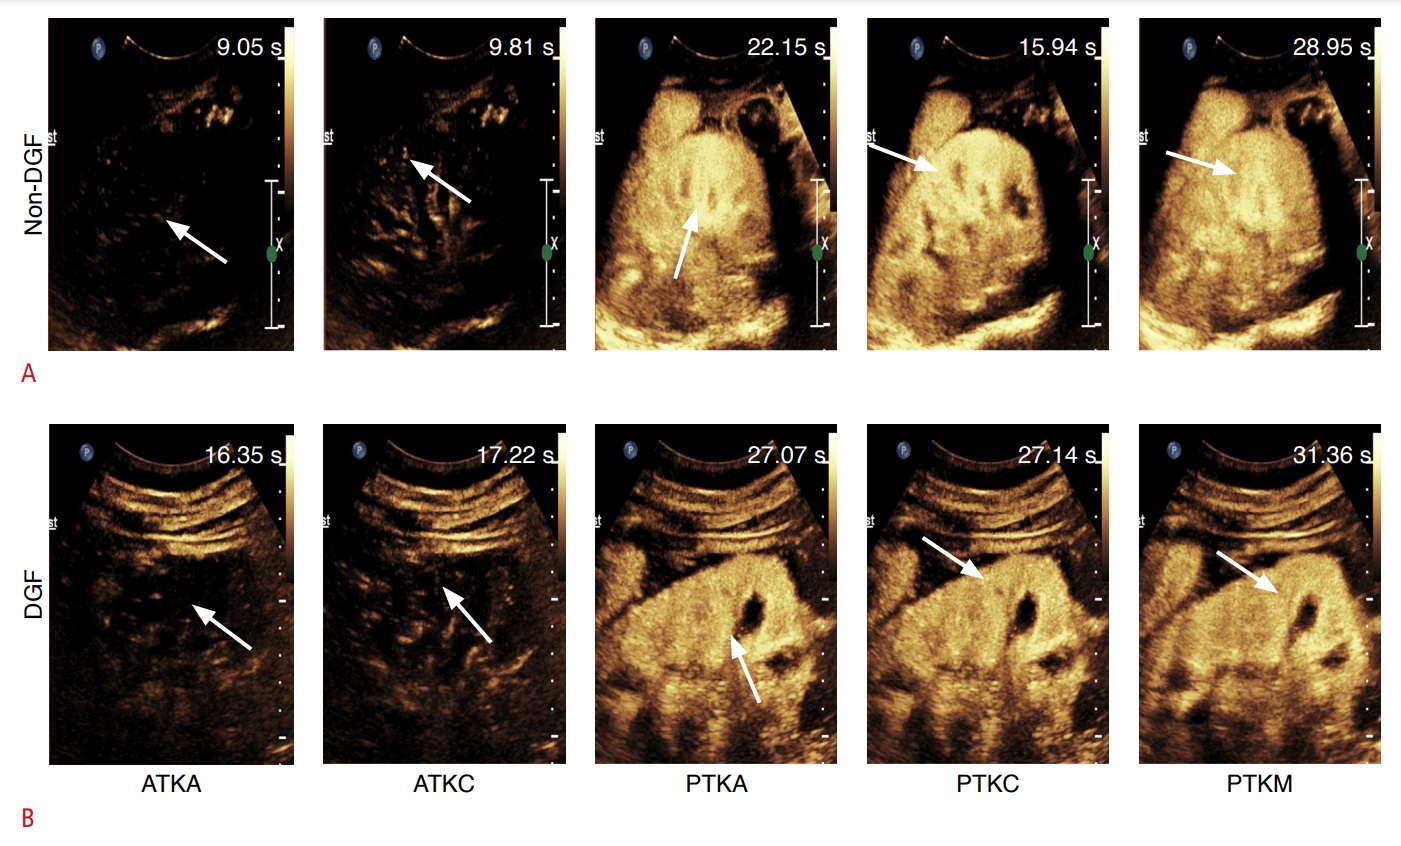
The results of the present study showed a delay in the AT of SonoVue to kidney segmental arteries and cortex in patients with DGF compared to those without DGF (Fig. 5). Kidney arterial vasoconstriction or ischemic injury may result from an inflammatory response triggered by brain death, which then causes a decrease in blood flow to the kidneys. This feature is similar to that described in the study by Grzelak et al. [27], who found delayed renal cortical and medullary contrast inflow in patients with DGF, which they attributed to vascular compression resulting from medullary swelling and graft destruction due to an inflammatory response. However, that study was performed post-transplantation and was not able to clarify whether ischemic kidney injury occurred pre-procurement or post-procurement, whereas the present study was performed before organ procurement.
The present study also found that TI(KA-KC) was an independent risk factor for predicting DGF. This parameter indicates the TI between the TTPKA and the TTPKC. TTP reflects the enhancement process of the ROI in the kidney, which directly corresponds to the perfusion of the contrast agent in the kidney and is considered to be a sensitive indicator of renal perfusion. TI(KA-KC) was significantly longer in the DGF group than in the non-DGF group, which indicates a delay in the TTP in the KC of the DGF group. This likely reflects kidney-related factors of the donor that have affected the quality of the donor kidney, such as a microcirculatory disorder and inadequate perfusion of the KC. Under normal physiological conditions, the blood supply to the KC remains within a relatively stable range; as kidney insufficiency increases, cortical perfusion gradually decreases, the flow of contrast medium into the KC decreases, and the TTP is prolonged. This process is consistent with that described in the recent study by Song et al. [28], in which PI of the cortex had higher specificity as an independent predictor of DGF than the specificity of other parameters.
The perfusion of the kidney is directly reflected by the signal intensity of CEUS, but the intensity parameters are influenced by several factors, including the parameter settings of the ultrasound machine, organ depth, and the patient’s body mass index. In this study, the differences between the PI of ROIs were not statistically significant.
CEUS-KDPI (AUC, 0.91) predicted DGF more accurately than KDPI (AUC=0.74), with higher sensitivity (90.5% [19 of 21 DGF cases]) and specificity (92.3% [36 of 39 non-DGF cases]) than KDPI (61.9% [13 of 21 DGF cases] and 87.2% [34 of 39 non-DGF cases], respectively). In addition, the AUC, sensitivity, and specificity of CEUS-KDPI for predicting postoperative DGF were all significantly higher than those of ATKA, ATKC and TI(KA-KC) alone; an explanation for this might be that CEUS-KDPI incorporated information on both prerenal and renal factors in donors.
To validate the accuracy of CEUS-KDPI, a validation group was included. CEUS-KDPI was equally accurate in the validation group (AUC, 0.84; sensitivity, 75% [3 of 4 DGF cases], specificity, 92.3% [24 of 26 non-DGF cases]), which further demonstrates the reproducibility and reliability of the new index developed herein for predicting DGF.
This study has several limitations. First, although the study had the advantage of being prospective, it was a single-center study with a small sample size, which limits the generalizability of the results to other populations. Larger prospective clinical studies or external research data are still needed to further confirm the findings of this study. Second, unlike the commonly used dynamic CT and MRI, CEUS is an operator-dependent examination, and measurement heterogeneity is a common limitation of all uses of CEUS to quantify organ perfusion. However, this study included ATKA, ATKC, and TI(KA-KC), all three of which are time-parametric metrics and are less influenced by ultrasound machine factors, thereby minimizing heterogeneity. Third, due to the limited number of kidney transplantation cases, the validation group was rather small, and a power analysis was not performed. Finally, DGF is influenced by many factors, and the influence of potential biases cannot be denied.
The present study has demonstrated for the first time that pre-procurement CEUS accurately assesses microcirculatory perfusion in brain-dead donor kidneys, and that CEUS-KDPI, which combines three parameters [ATKA, ATKC, and TI(KA-KC)] measured by CEUS and TIC analysis, has a greater predictive value than KDPI or each individual parameter for DGF after transplantation. CEUS may be a potential noninvasive tool for pre-procurement bedside examinations, with the potential ability to predict early renal function after kidney transplantation from donors after brain death.

 Download Citation
 PDF Links
 PubReader
 ePub Link
 Full text via DOI


