

 Print
Print facebook
 twitter
 Linkedin
 google+

Introduction
Ovarian cancer is the seventh most common cancer among women worldwide and the eighth most common cause of cancer deaths [1]. Among gynecological tumors, ovarian cancer has the third-highest incidence rate [2] but the highest mortality rate [3,4]. In 2022, the National Cancer Institute reported an estimated 5-year survival rate of approximately 49.7% among patients with ovarian cancer between 2012 and 2018 [5]. Ultrasonography is the first-choice diagnostic tool in the examination of ovarian-adnexal masses [6,7].
Accurately identifying the characteristics of benign and malignant ovarian tumors is extremely important for the subsequent treatment of patients, especially for the management of patients with benign and malignant masses without obvious symptoms, as this can reduce the need for surgery and reduce expenditures for patients [8,9]. Many methods are used to evaluate ovarian tumors by ultrasonography. For example, the International Ovarian Tumor Research Group (IOTA) proposed the Simple Results (SR) preoperative classification system. The SR system comprises 10 ultrasound features to differentiate benign masses from malignant ones, wherein a mass is classified as malignant if it has at least one malignant feature and no benign features and vice versa. Although the SR system is simple, nearly 20% of ovarian tumors cannot be classified by these criteria alone [10]. In 2014, Van Calster et al. [11] developed a risk prediction model, the Assessment of Different Neoplasia in the Adnexa (ADNEX), to distinguish between benign, borderline, invasive in stage I, invasive in stages II-IV, and secondary metastatic ovarian tumors preoperatively. The variables in the ADNEX model do not contain blood flow signals, which is a limitation for assessing malignancies with a more abundant blood supply [12]. In 2018, the American College of Radiology (ACR) ultrasound working group published a set of white papers related to standardized ultrasound terminology [13]. Based on this information, Ovarian-Adnexal Reporting and Data System Ultrasound (O-RADS US) was proposed [14]. The advent of O-RADS US compensates for the shortcomings of the above approach and standardizes the template for ultrasound reports. Moreover, suggestions were made for the follow-up management of masses. O-RADS US deserves recognition in diagnosing the nature of ovarian-adnexal masses [15,16], but it is not widely used in China. Additionally, the clinical application of this method needs further external validation and optimization [17-20].
MV-Flow utilizes spatially and temporally coherent information to extract data on low-speed blood flow. Tissue motion artifacts are removed by a wall filter to observe the hemodynamics and blood perfusion of the microvascular structures and to quantitatively show the vascular index (VI). It has extremely high temporal and spatial resolution. MV-Flow has unique advantages for displaying the microvasculature of lesions [21]; it allows the quantitative analysis of the tissue blood supply from different stages (for example, before and after treatment) and from different lesions. Previously, some researchers estimated whether fetuses had growth restriction using MV-Flow [22], and some researchers compared the different color Doppler and MV-Flow ultrasound images after chemotherapy in liver cancer patients [23]. Benign and malignant ovarian-adnexal masses present different blood supply characteristics: in malignant compared with benign masses, the blood supply is rich, the main blood vessels are wide with multiple branches, the shape is tortuous, the diameter is uneven, and the distribution is complex. The shape and distribution of the mass blood vessels are highly useful as reference values for judging benign and malignant lesions. By using the sensitivity of MV-Flow for vessel display and capturing the morphological features of low-speed, tiny vessels, combined with the vascular growth characteristics of malignant tumors, it is possible to judge the nature of the mass. The vascular index from MV-Flow (VIMV) represents the area proportion of the blood vessels within the target region, which can be obtained through direct measurements using MV-Flow. In the absence of a fixed criterion for MV-Flow International, VIMV can be used as a judgment index for MV-Flow. To date, there are no reports of MV-Flow being used for the diagnosis of benign and malignant ovarian-adnexal tumors.
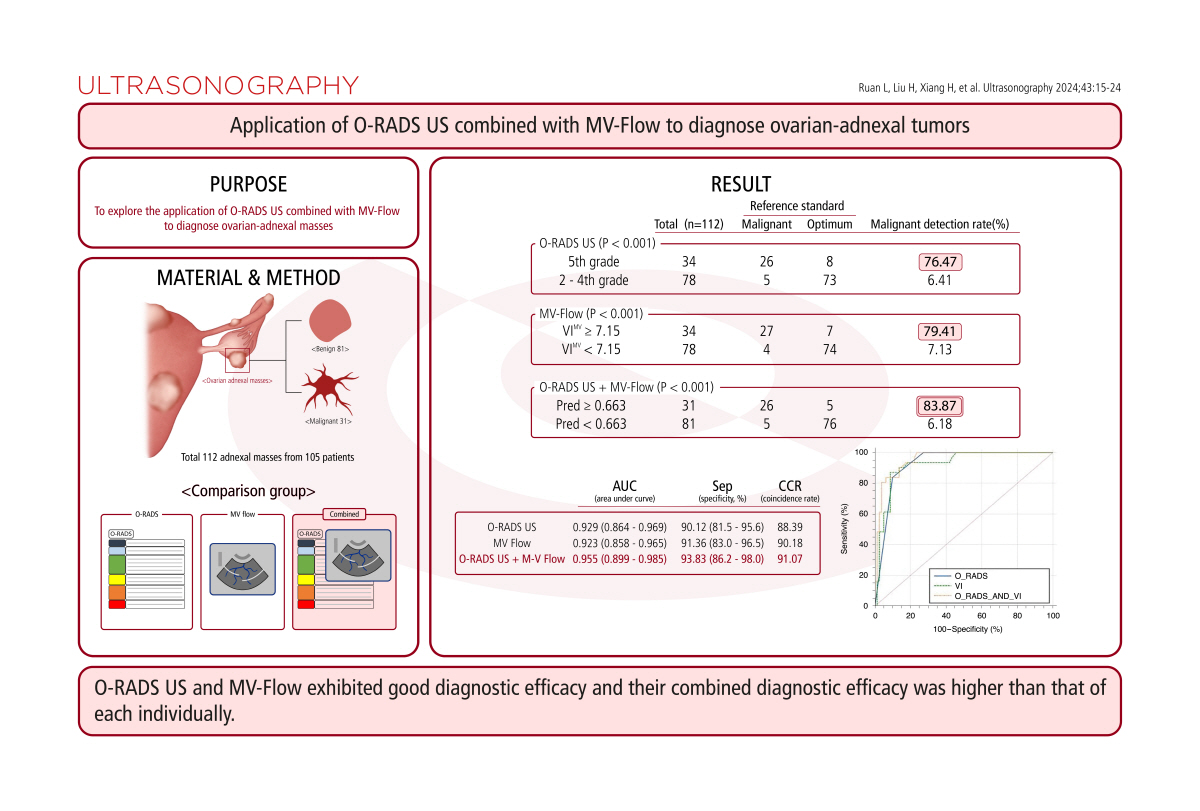
The purpose of this study was to explore the clinical value of combining O-RADS US with MV-Flow to diagnose ovarian-adnexal masses.
Materials and Methods
Compliance with Ethical Standards
This research project was approved by the ethics committee of the First Affiliated Hospital of Xinjiang Medical University in May 2021 (No. K202105-16). All patients signed informed consent forms.
Study Sample
This is a prospective diagnostic trial conducted at The First Affiliated Hospital of Xinjiang Medical University from June 2021 to July 2022.
Masses classified as O-RADS US 0 (unclear display due to intestinal gas interference) and 1 (follicle or corpus luteum, etc.) were excluded. No preoperative treatment was performed. All tumors were examined by transvaginal ultrasonography within 7 days before the operation, and MV-Flow images were retained. All patients underwent surgical treatment, from which pathological results were obtained, or had lesions confirmed to be benign during follow-up (patients were followed up at least three times until the lesions were resolved).
Instruments and Image Analysis
Ultrasound images were collected by an obstetrician and gynecologic sonographer who had worked for more than 8 years. A SAMSUNG HERA W10 special diagnostic instrument (Samsung Medison Co., Ltd., Seoul, Korea) for obstetrics and gynecologic ultrasound was used, and a transvaginal probe was used for fan-shaped exploration with 3-10 MHz transducers. All images and patient information were stored on the machine and on the picture archiving and communication system.
Sonographers were uniformly trained and guided through O-RADS US by gynecological ultrasound experts, and preliminary experiments were conducted before the start of this study to ensure that the two sonographers had the same understanding of diagnosis and treatment. Two experienced sonographers (L.R. and Y.F.) collected and analyzed two-dimensional color Doppler and VIMV images of the mass. The whole process was carried out in a blinded manner. Two doctors analyzed the images of all cases alone, and they did not know the final pathological results of the mass. When a difference in analysis occurred between two physicians, the final judgment was made by a gynecological tumor ultrasound expert (H.X.). Finally, the O-RADS US and VIMV data were analyzed for consistency.
According to the standardized ultrasound terms of the 2018 ACR White Paper, the characteristics of an ovarian-adnexal mass were described as follows: unilateral or bilateral (note the right, left, or both sides); the maximum diameter in any plane (mm); the regular outer margin or nonuniform outer margin; whether the external contour and the inner margin of the lesion are smooth or irregular; whether the mass is cystic, solid, or solid-appearing; the internal echoes and the acoustic shadowing situation of the cyst; whether there is a septum (note the number of septa, whether the septum is complete or incomplete, and the thickness of the septum); whether the cyst contains solid components (<3 mm in height) or papillary projections (solid components Ōēź3 mm in height); the echogenicity inside the solid mass (hypoechoic, isoechoic, or hyperechoic); the presence or absence of calcification and acoustic shadowing within the solid mass; the color score (1-4 points); the extraovarian findings, including whether it presents with ascites and cul-de-sac fluid; and whether the surrounding tissue demonstrates peritoneal thickening or nodularity.
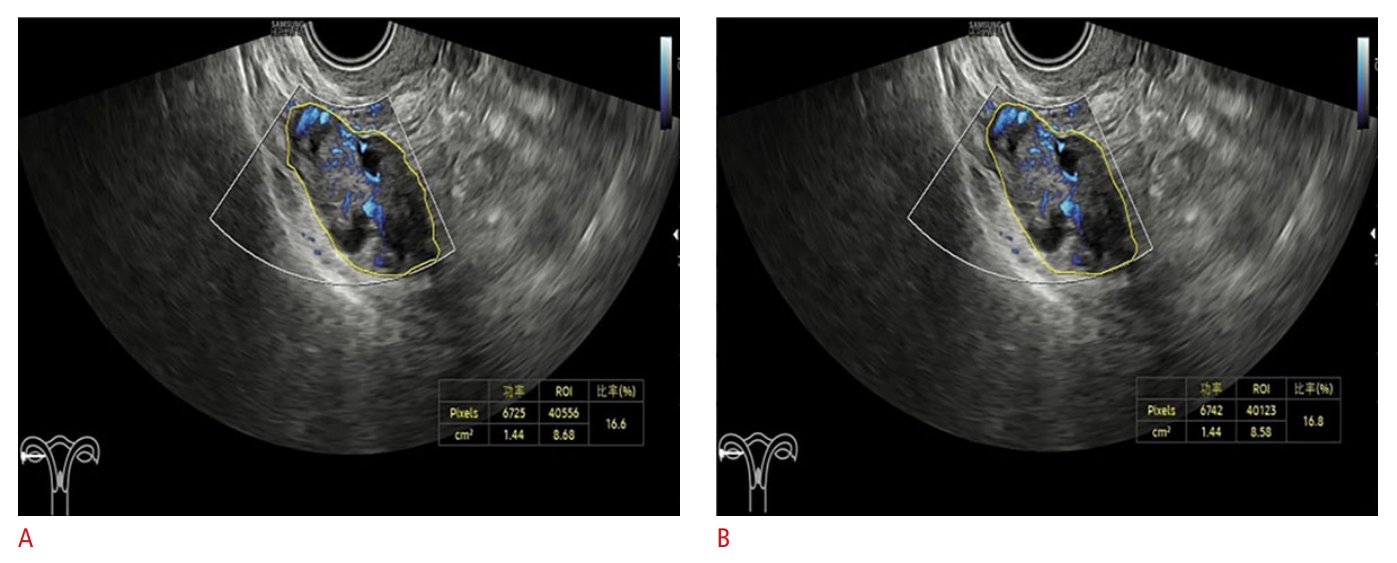
There are three ways to measure VIMV: rectangular, elliptical, and manual tracing methods. Because there are many types of ovarian-adnexal masses and they have different morphologies [24,25], the manual tracing method was used uniformly to avoid errors. When placing the MV-Flow sampling box, the entire mass was wrapped, and if the mass was too large to enfold completely, the maximum area was selected; regardless, the image had the most abundant blood flow signal. The division of the VIMV region of interest (ROI) varies between cystic, solid, or solid-appearing lesions. For measurements of cystic and solid mass VI (n blood/n total), the ROI was noted along the outer margin of the mass in the sampling frame. For cystic masses containing solid components, when the region with solid echogenicity occupied less than 50% of the mass, the maximum VIMV value of the solid component was measured; however, when the region with solid echogenicity occupied at least 50% of the mass, the maximum VIMV value of the whole mass was measured. Regardless of the mass, the operator measured at least three VIMV values and took the maximum as the final result, and the operator strictly measured the VIMV at least three times as described above, taking the maximum value as the final result. Fig. 1 shows the VIMV images measured twice by a physician.
When sorting patient data, the following information was recorded: age, hospitalization number, menstrual history, duration of menopause, previous related medical history, pathological findings, follow-up results, clinical stage, and histology type (the reference standard was the International Federation of Gynecology and Obstetrics (FIGO) classification, as published in 2014) [26], with or without lymph node metastasis, using pathological results and long-term follow-up results as reference standards. At the time of analysis, borderline tumors were judged as malignant.
Statistical Analysis
SPSS version 26.0 for Windows (IBM Corp., Armonk, NY, USA) and MedCalc version 19.0 (MedCalc, Mariakerke, Belgium) were used to analyze the data. The measurement data did not conform to a normal distribution and are expressed as the median (interquartile range). Count data are expressed as number (%). The consistency between the two physicians and intragroup consistency were evaluated by the kappa coefficient (with a kappa value >0.75 showing good agreement, 0.4-0.75 showing moderate agreement, and <0.4 showing poor agreement) and intraclass correlation coefficient (ICC, with the ICC range being 0-1, where ICC=0 indicated no agreement, ICC<0.4 indicated poor agreement, ICC>0.75 indicated good agreement, and 1 indicated complete agreement). Taking pathological and long-term follow-up results as the reference standards, receiver operating characteristic (ROC) curves with 95% confidence intervals (CIs) for O-RADS US and MV-Flow were constructed separately and jointly, and the areas under the curve (AUCs) were calculated. Furthermore, the sensitivity, specificity, positive predictive value, negative predictive value, positive likelihood ratio, negative likelihood ratio and coincidence rate were calculated, and the AUCs were compared using the Z test. For all analyses, a two-sided P-value <0.05 was considered statistically significant.
Results
Between June 2021 and July 2022, a total of 115 masses met the inclusion criteria, three masses were excluded because the patients were lost to follow-up, and 105 consecutive patients with 112 ovarian-adnexal masses were finally included in the study. The mean age of the patients was 40 (32-51) years. Fig. 2 shows the inclusion process of the masses.
The pathology and long-term follow-up results of the 112 masses are shown in Table 1. Among the 112 masses, 31 malignant masses had pathological results obtained through surgery (27.68%, 31/112), most of which were serous carcinoma. Eighty benign masses had pathological results (71.43%, 80/112), most of which were endometrial implantation cysts (25.89%, 29/112) and mature teratoma of the ovary (14.29%,16/112); and one was diagnosed as an accessory ovary through long-term follow-up (0.89%, 1/112) (after three follow-up visits, the lesion eventually resolved).
As shown in Table 2, the different diagnostic modalities identified benign and malignant masses at different proportions. Specifically, the number identified by O-RADS US as 5 was 34, and the number identified by O-RADS US as 2-4 was 78. Furthermore, the number of malignant masses identified by O-RADS US as 2-4 was significantly lower than that identified by O-RADS US as 5 (P<0.001). When VIMV was used to diagnose benign and malignant adnexal masses, 7.15 was obtained as the cutoff value based on the ROC curve. The numbers of masses with VI Ōēź7.15 and VIMV <7.15 were 34 and 78, respectively, and the number of malignant masses with VIMV <7.15 was significantly lower than that with VIMV Ōēź7.15 (P<0.001). At the time of the joint diagnosis, predictive values (Pred) were calculated by a binary logistic regression analysis; the numbers of masses with Pred Ōēź0.663 and Pred <0.663 were 31 and 81, respectively, and the number of malignant masses with Pred <0.663 was significantly lower than that of masses with Pred Ōēź0.663 (P<0.001).
During the O-RADS US judgment process, two physicians assigned different grades to two different cases of masses: one case was a borderline tumor, and the other case was a clear cell carcinoma. The kappa coefficient for the O-RADS US grade was 0.974. For the VIMV measurement, observers performed intergroup and intragroup consistency analyses separately. The ICC for consistency analysis between the two physicians was 0.986. The physician within-group consistency analysis yielded an ICC of 1. All the above consistency analyses showed good results.
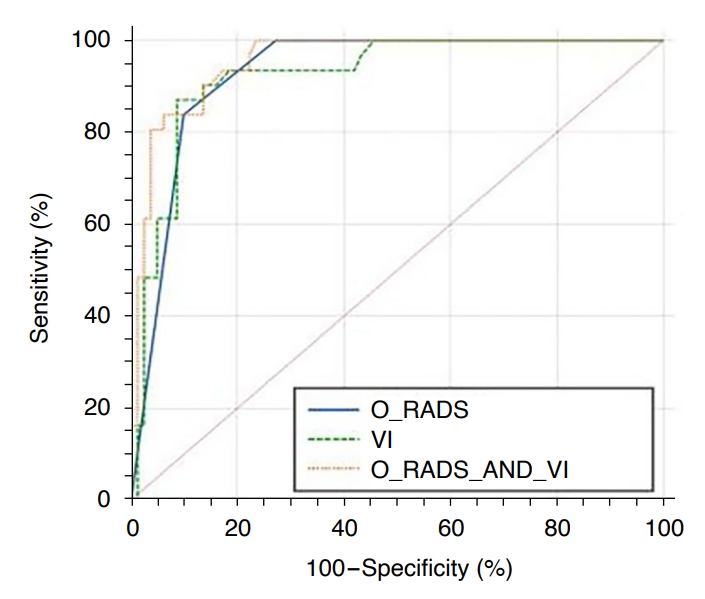
Table 3 and Fig. 3 show the diagnostic efficacy of the three methods. The AUCs of O-RADS US alone, MV-Flow alone, and their combination were 0.929 (95% CI, 0.864 to 0.969), 0.923 (95% CI, 0.858 to 0.965), and 0.955 (95% CI, 0.899 to 0.985), respectively. The O-RADS US and VIMV cutoffs were 5 and 7.15, respectively. When malignant masses were defined as O-RADS US 5 and VIMV Ōēź7.15, the Pred of the O-RADS US and MV-Flow combination was Ōēź0.663. With this definition, the differences among the three diagnostic methods in judging benign and malignant masses were significant (P<0.001). As shown in Table 3, the sensitivity values of the three diagnostic methods were 83.87%, 87.10%, and 83.87%; the specificity values were 90.12%, 91.36%, and 93.83%; the positive predictive values were 76.47%, 79.41%, and 83.87%; the negative predictive values were 93.59%, 94.87%, and 91.57%; the positive likelihood ratios were 8.49, 10.08, and 13.59; the negative likelihood ratios were 0.18, 0.14, and 0.17; and the coincidence rates were 88.39%, 90.18%, and 91.07%, respectively. Among the three diagnostic methods, the combination of diagnostic methods had the highest AUCŌĆöthat is, the combination of O-RADS US and MV-Flow had the highest diagnostic efficiency and was better than each method alone (P<0.05). There was no significant difference between O-RADS US and MV-Flow in diagnostic efficacy (P>0.05).
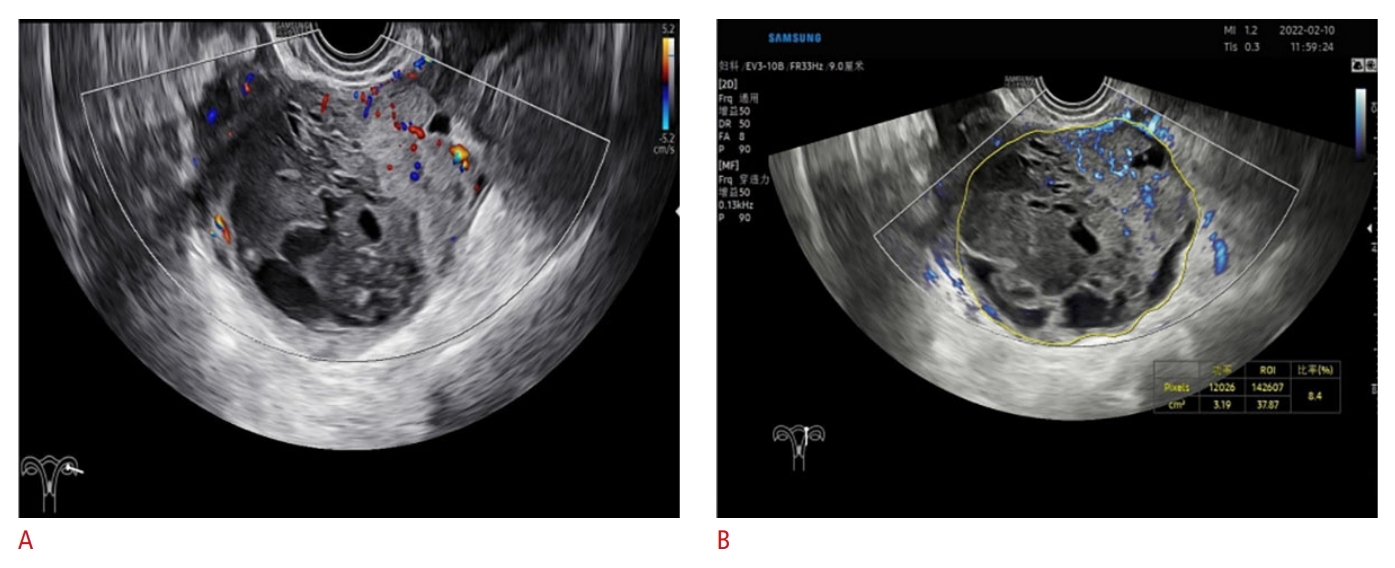
During the judgment process, there was a tendency toward disagreement regarding masses classified as O-RADS US grades 4 and 5. One of the main reasons for this disagreement was the different blood flow grading by different operators, which was related to the subjective judgment of physicians. In addition, judgments regarding the regularity of the mass, the number of papillary processes, and the internal echo of the mass were also slightly different. MV-Flow is good at capturing low-speed blood flow, which not only vividly shows the internal vascular diameter, distribution, and tiny branches, but can also quantitatively display the vascular content in a certain area. Ovarian-adnexal masses have different properties on MV-Flow images. Benign masses are characterized by less blood supply, simple deformation, and more blood vessels are distributed in the periphery or partition of the masses, mostly punctate or a few strips, while malignant masses are characterized by rich blood supply, more complex shape and more branch vessels, and more main vessels are distributed near the center or within the solid components. In the results of this experiment, the VI value of malignant tumors was significantly higher than that of benign tumors, directly reflecting the difference in internal blood supply distribution. The combination of O-RADS US and MV-Flow can make the O-RADS US classification clearer and facilitate the corresponding risk stratification of the mass; at the same time, it enhances the confidence of diagnostic ultrasound physicians. Figs. 4, 5, and 6 show typical cases when the two methods were used in combination.
Discussion
The results of this study showed that O-RADS US had good diagnostic efficacy in the identification of benign and malignant ovarian-adnexal masses. When MV-Flow (VIMV) was used to identify benign and malignant tumors, both the sensitivity and specificity improved, and there was no significant difference between the overall diagnostic efficacy of MV-Flow and O-RADS US (P>0.05). When the above two methods were combined, the O-RADS US was increased or unchanged; for VIMV Ōēź7.15, the O-RADS US classification was upgraded, but for VIMV <7.15, the classification remained unchanged. The combined diagnostic model of O-RADS US and MV-Flow (VIMV) performed better in the diagnosis of the tumor type. Although vascular abundance is higher in malignant tumors, masses with fewer blood vessels also account for a certain proportion of malignancies [27], so there is still a need for research on the diagnosis of malignancies with a low blood supply by either O-RADS US or MV-Flow.
Several researchers have demonstrated that O-RADS US has high reliability, with an AUC of 0.91-0.98, in predicting malignancy risk in adnexal areas [28], and those data are within the scope of the present studyŌĆÖs data. This indicates that O-RADS US can be an effective means for the diagnosis and treatment of ovarian-adnexal masses. The data from this analysis show that masses judged as O-RADS 3 or below were clearer, and the risk of malignancy within this level was relatively low, indicating that O-RADS US has a better evaluation value in excluding malignant ovarian-adnexal tumors.
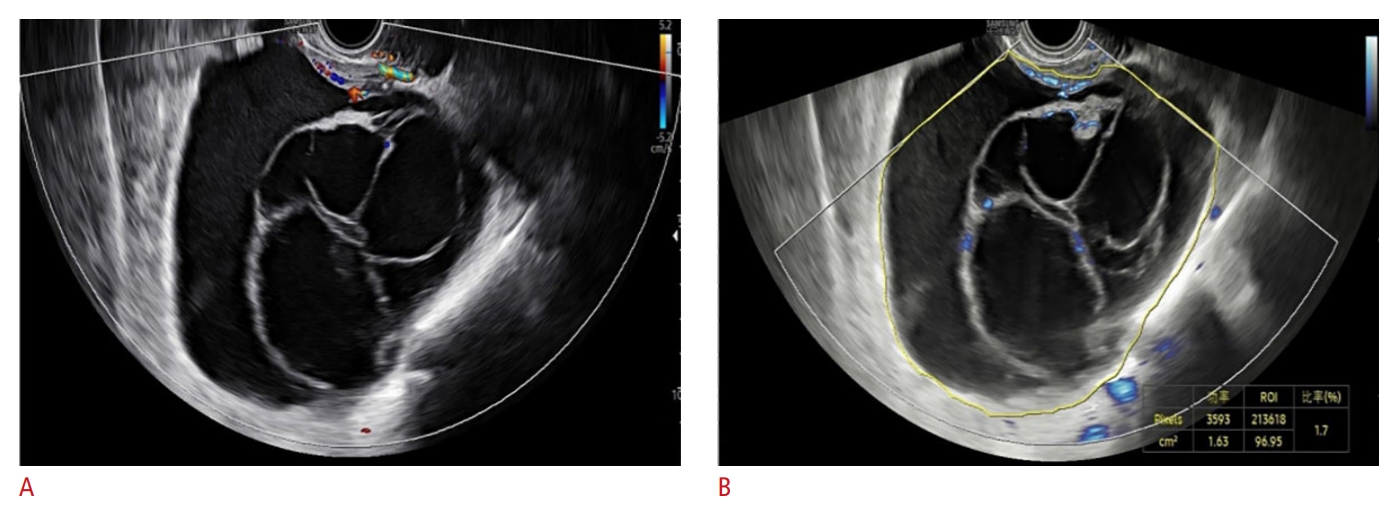
Some borderline tumors were classified as O-RADS US 4 or 5, with an O-RADS US 4 malignant risk coefficient of 10%-50%, which is a wide range. The O-RADS US 4 and 5 diagnostic treatment protocols are different, which illustrates the need for a detailed classification of masses. If the contribution of MV-Flow to O-RADS US 4 is high, it can also be a focus for sonographers. It should be emphasized that there is no unified judgment criterion for MV-Flow, and this experiment only used VIMV as a diagnostic index and ultrasonic images of adnexal masses with multiplicity and complexity. In clinical practice, in addition to VIMV, the overall blood supply distribution of the mass is also an important consideration. For example, using MV-Flow, obvious punctate strips of blood flow separated the mass and the surrounding area (Fig. 6), and the area of solid echogenicity in the mass also clearly showed the vascular morphology. The mass grading can be adjusted from O-RADS US 4 to O-RADS US 5, and postoperative pathology confirmed clear cell carcinoma. The VI of this case was 1.7; if VIMV Ōēź7.15 was only used as the diagnostic criterion for malignant masses, a diagnostic error would result. This example shows that the VIMV cutoff (VI=7.15) can serve as a reference; however, special cases should be analyzed in detail when they occur. Therefore, MV-Flow has a positive adjuvant effect on the subsequent diagnosis and treatment of masses.
O-RADS US in combination with MV-Flow can identify benign and malignant ovarian-adnexal tumors, and this experiment affirmed its diagnostic value. There are no related studies on this topic, so this diagnostic approach is the innovation of this study.
The O-RADS US classification criteria involve the mass size; the larger the mass is, the higher the classification of the O-RADS US risk stratification system and the greater the risk of malignancy will be. At the time of the data measurement, VIMV for smaller masses (MV-Flow sampling box fully included) has strong predictive ability. Regarding MV-Flow images with low interference and high clarity, compared with that of relatively large masses, the measurement of small masses has certain advantages. Under this condition, the authors suspect that the improved diagnostic effect of this combination is associated with an improvement in the benign and malignant diagnoses of small masses. There were 21 cases of small masses in this experiment. It is suggested that MV-Flow will be a novel noninvasive ultrasound-assisted technique for the diagnosis of early ovarian cancer.
When the color Doppler score is 1 or 2 in O-RADS US, MV-Flow mostly shows punctate or short bar blood flow signals, and the VI is significantly <7.15. Meanwhile, when the color Doppler score is 3 or 4, MV-Flow mostly has a long strip or network distribution; especially when the score is 4 and the VI is obviously >7.15, MV-Flow can add some data that the color Doppler technology cannot provide (e.g., VI). Furthermore, MV-Flow can show the small branches of blood vessels more clearly than the color Doppler technique.
There are advantages and disadvantages of this study. First, the test operation process is less affected by the pathological results. Ultimately, this study involved both separate and combined diagnoses, using pathological and long-term follow-up results as the reference criteria. The three diagnostic methods were verified and compared by means of consistency testing, and the test showed consistency and highlighted O-RADS US as one of the latest methods for predicting ovarian-adnexal malignancy risk. Its combination with the new MV-Flow technology compensates for the deficiencies of color Doppler as an important index of malignant tumors.
The two examination methods are easy to operate, involve no radiation, and require no additional cost. The study population was Chinese female patients in general hospitals. The cancer rate may be lower than the data from tumor centers, and it is not possible to rule out regional factors. The O-RADS US diagnosis depends on two-dimensional and color Doppler ultrasound evaluation, and its inherent limitations still exist [29]. MV-Flow has no international classification standard. At present, the role of MV-Flow in O-RADS US cannot be directly represented by vascular morphology (dot shape, strip shape, mesh shape, etc.) or distribution (marginal type, center type, mixed type, etc.).
In the future, it is hoped that large-scale, multicenter laboratories will conduct relevant longitudinal prospective studies to verify the value of MV-Flow as a diagnostic tool alone and in combination with the O-RADS US risk stratification system for its clinical application.
The results of this study showed that O-RADS US and MV-Flow are effective methods for diagnosing benign and malignant ovarian-adnexal masses. MV-Flow has a unique advantage in displaying micro-blood flow. The above two methods have good consistency among different physicians. The combination may further improve the diagnostic efficacy, thus providing more reliable evidence for the diagnosis and stratified management of masses in the adnexal area.


 Download Citation
 PDF Links
 PubReader
 ePub Link
 Full text via DOI


