

 Print
Print facebook
 twitter
 Linkedin
 google+

Introduction
Focused ultrasound (FUS) techniques deliver highly focal acoustic pressure waves to region-specific areas of the body in a non-invasive fashion [1,2]. For transcranial application, a frequency range of 200-700 kHz, which is much lower than the frequencies used in diagnostic imaging applications (3-4 MHz), is typically adopted to allow acoustic transmission through the intact skull [3,4]. The ability to apply mechanical or thermal energy to deep brain areas with excellent spatial selectivity by transcranial FUS [5] has conferred promising translational potentials in functional neurosurgery, neuromodulation, and drug delivery [6-8].
Insonification to fluidic media imparts an acoustic radiation force to the fluid, which induces localized and directional net displacement, an effect known as acoustic streaming [9,10]. In microfluidic devices, where controlled fluid transport along capillary-sized channels is a challenge, the acoustic streaming effect has been used in fluid propulsion and particle-mixing [11], biological sample preparation and analysis [12,13], and the manipulation of cells/particles [14,15]. The clinical utility of acoustic streaming has been explored in ultrasound imaging, such as cystic fluid detection, and in enhancing drug delivery to the brain when conjunctionally used with convection-enhanced techniques [16,17].
The brain is considered moderately porous (~14% in gray matter and ~5% in white matter) [18], and its porosity is partially contributed by leptomeningeal fenestrations and the wide network of perivascular space (PVS) that lines the intricate brain vasculature [19,20]. The brain is immersed in cerebrospinal fluid (CSF) and interstitial fluid (ISF), the mutual exchange of which plays an important role in waste transport and removal [21-23]. The feasibility of using acoustic streaming for non-invasive enhancement of convective bulk flow in the CSF and ISF has been demonstrated by transporting bromophenol blue dye through soft tissue-mimicking porous media via FUS sonication [24], supported by a numerical framework according to Eckart’s solution [25]. The ability to enhance brain solute transport through ultrasound-induced acoustic streaming may lead to important future applications, such as countermeasures against aberrant waste clearance associated with many neurological disorders (e.g., Alzheimer’s disease, dementia, multiple sclerosis) and aging [26-28]. Recent studies have found that application of FUS can deliver intrathecally injected macromolecules and pharmaceutical agents to the brain parenchyma, as well as facilitate CSF/interstitial solute transport, all without disrupting the blood-brain barrier [29-31]. Despite promising potential in neurotherapeutics, these in vivo studies were conducted using a limited range of pulsing parameters and frequencies, without evaluations in media phantoms that mimic brain porosity.
Particle transport induced by acoustic streaming involves nonlinear mechanisms that are challenging to predict within highly non-homogeneous media such as the brain [15,32-34]. Therefore, the effects of FUS parameters, including intensity, frequency, and pulse duration (PD), on fluid/solute movements in the brain are largely unexplored, warranting further evaluation of the range of frequencies and low acoustic intensities that are suitable for transcranial application. Existing numerical models may provide useful information, especially regarding the fluid velocity exposed to the acoustic field; however, the pressure threshold in creating detectable streaming [15,35], combined with the nonlinear streaming behavior with respect to the frequency and pulsing scheme [15,36], are difficult to model by numerical approaches alone and demand experimental assessment in porous phantoms prior to in vivo studies.
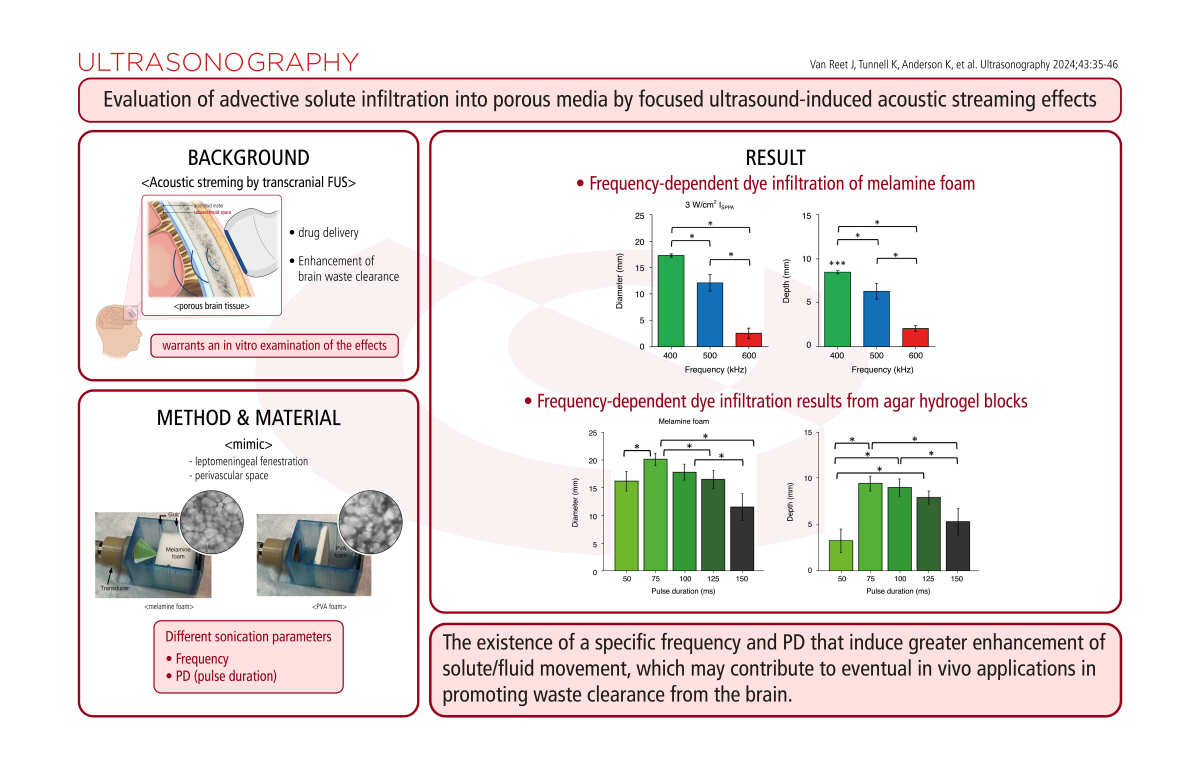
The present study examined the effects of frequency (400, 500, and 600 kHz) and different acoustic intensities (spatial-peak pulse-averaged intensities, ISPPA, of 3 W/cm2 and 4 W/cm2) on propelling toluidine blue O (TbO) dye into porous melamine foam (pore diameter 150-200 µm) by measuring dye dispersion dimensions (depth and diameter). The porosity of agar hydrogel (pore diameter of 40-80 nm, mimicking the porosity of dense neuropil) [37], made it possible to examine whether acoustic streaming would affect the diffusional transport component. Upon determining the frequency and intensity that maximized dye infiltration to the melamine foam, sonication was applied using different PDs (50-150 ms with 25-ms steps) to both melamine and polyvinyl alcohol (PVA) foams to examine the effects of PD on dye infiltration using a constant spatial-peak temporal-average intensity (ISPTA) of 0.4 W/cm2. The average pore diameter of the PVA foam (~80 µm) approximates the dimension of the PVS in the brain (~40-100 µm) [20], thereby providing better biomimicry than the melamine foam.
Materials and Methods
Ultrasound Transducer Characterization
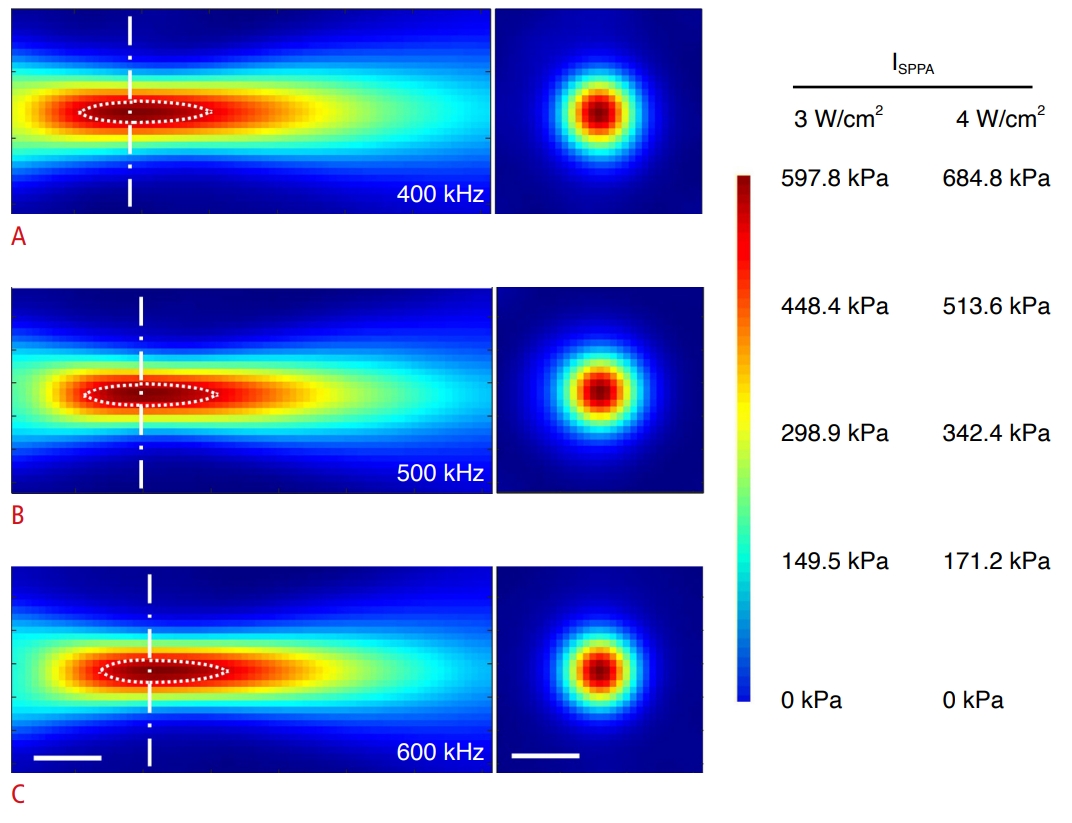
A FUS transducer (WS100-0.5-P38, Ultran Group, State College, PA, USA) was actuated by a sinusoidal electrical waveform (function generator, 33500B, Keysight, Santa Rosa, CA, USA) that was amplified by a linear power amplifier (240L, Electronics and Innovations, Rochester, NY, USA) with impedance matching. The acoustic pressure profiles across the three different fundamental frequencies (400, 500, and 600 kHz) were mapped with a needle hydrophone (HNC-200, Onda Corp., Sunnyvale, CA, USA) mounted to a 3-axis robotic linear stage (Bi-Slides, Velmex Inc., Bloomfield, NY, USA), in a water tank degassed to <2 ppm oxygen (K-7512 ChemMets kit, Chemetrics, Midland, VA, USA), using an established method [38]. The pressure profile longitudinal to the center of the sonication path was mapped over a 7×3 cm area in 1-mm steps, with a 5-mm gap from the exit plane of the transducer (the colormap represents the range of acoustic pressure corresponding to the two acoustic intensities used in the present study) (Fig. 1). The gap was introduced to avoid potential contact of the hydrophone tip with the transducer surface. The location of the maximum pressure was identified as the focal coordinate, and the area perpendicular to the sonication axis was also mapped covering 3×3 cm. The focal dimension (i.e., length and diameter of the focus defined in the area bound by full width at half-maximum of the pressure) and the focal distance across different frequencies are listed in Table 1. To depict the area proximal to a focal center, the spatial profile encompassing the full width at 90% maximum of the pressure was delineated with dotted lines across the frequencies (Fig. 1). The magnitude of acoustic pressure at the acoustic focus with respect to input voltage was also measured at each frequency using a hydrophone that was separately calibrated across the frequencies (HNR-0500, 2.5-mm probe diameter, Onda Corp.). The frequency calibration was needed to circumvent the need for estimating the frequency response function and sensitivity for the transducer and electronic system. To provide equivalent pressure amplitude across three fundamental frequencies at the focus, the tip of a calibrated hydrophone was placed at the focal center, and the input voltage to the transducer was adjusted until the desired level of voltage value from the hydrophone was recorded at each frequency.
Preparation of Melamine/PVA Foam Blocks and Agar Hydrogel
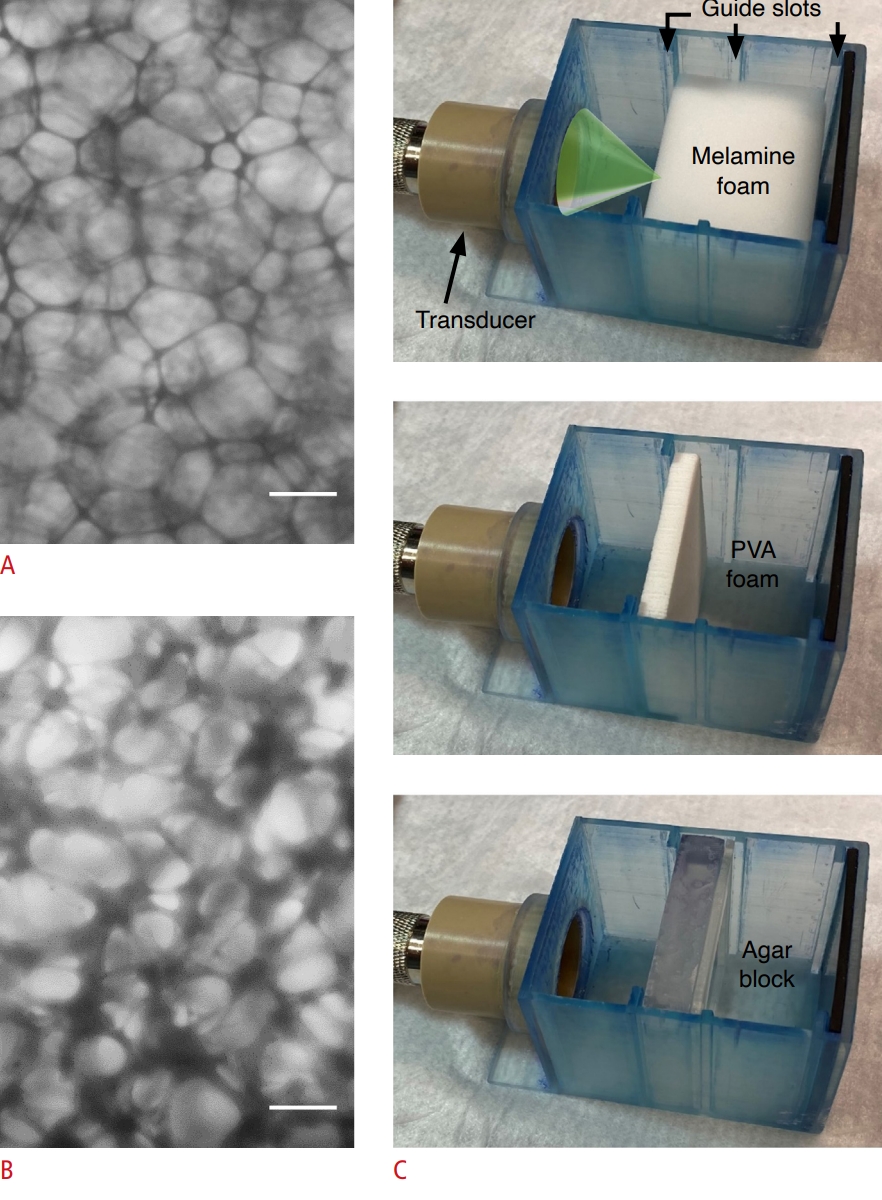
Three types of media having different porosities were used. Melamine foam blocks (IEXL21, Sponge Outlet, Kenmore, NY, USA), having a pore size ranging between ~150-200 µm (Fig. 2A), were cut to 50×45×35 mm (width×height×thickness) dimensions and hydrated in phosphate-buffered saline (PBS; Thermo Fisher, Waltham, MA, USA). A dehydrated PVA foam (AION Co. Ltd., Osaka, Japan), with a smaller porosity than the melamine foam (~80-100 µm) (Fig. 2B), was cut thinner (48×48×6 mm) than the melamine foams (to promote hydration in PBS using a vacuum chamber). The hydration increased the thickness of the PVA blocks to ~7 mm. To make agar hydrogel blocks, low gelling-temperature agar (A4018, Millipore Sigma, Burlington, MA, USA) was dissolved in PBS at 2.5% weight concentration (50°C) and poured into a 30×30×10 mm mold to gel in room temperature, mimicking the porosity of neuropil [37,39]. After preparation, the various media blocks were individually inserted into a 3D-printed chamber (Form3, Formlabs, Somerville, MA, USA) containing the TbO dye solution (T3269, Millipore Sigma, prepared in a 25 µg/mL concentration in PBS). The chambers were designed with slots to accommodate the different focal distances to position the acoustic focus on the front surface of the media blocks (Fig. 2C). The wall of the chamber was lined with a 2.5-mm-thick rubber pad to absorb acoustic energy.
Frequency-Dependent Dye Infiltration to Melamine Foam and Agar Hydrogel Blocks
FUS was applied in a pulsed manner (with a PD of 100 ms) every second for 10 minutes across the frequencies of 400 kHz, 500 kHz, and 600 kHz. The initial values for PD and repetition frequency (1 Hz) were chosen based on the previous study that examined the acoustic streaming effects on TbO dye infiltration in melamine foam at 200 kHz [29]. Two sets of data were collected using an ISPPA of 3 W/cm2 and 4 W/cm2 (corresponding to 597.8 and 684.8 kPa peak-to-peak pressure, respectively). Thus, the maximum mechanical index used in this part of experiment was 0.54 (in the case of 400 kHz given at 4 W/cm2 ISPPA). Factoring in a 10% duty cycle operation, the spatial-peak temporal-averaged intensities (ISPTA) were 0.3 W/cm2 and 0.4 W/cm2, respectively. Ten measurements were taken for each parameter in a randomized and balanced fashion, with 30% volume of fresh dye solution replaced in-between. The temperature in the PBS-dye bath was recorded (4425 Traceable Workhorse Thermometer, Traceable Products, Webster, TX, USA) at the beginning and end of sonication. The process was repeated for trials involving agar hydrogel blocks.
Examination of the Effect of PD on Dye Infiltration into Melamine/PVA Foam at 400 kHz Frequency
Based on the frequency that yielded the highest dye infiltration to the melamine foam (400 kHz at 4 W/cm2 ISPPA; see Frequency-dependent degree of dye infiltration to melamine foam in "Results"), the effect of variable PDs on dye infiltration was assessed by sonicating melamine and PVA foam blocks. Agar gel was not used in this part of the experiment because the agar gel did not allow any detectable dye infiltration, being dominated by a passive diffusional process (see Dye infiltration to agar hydrogel blocks in "Results"). Five PDs were used (50, 75, 100, 125, and 150 ms) with a repetition frequency of 1 Hz. An ISPTA of 0.4 W/cm2 was maintained across the measurement, and accordingly, the ISPPA was varied to 8, 5.3, 4, 3.2, and 2 W/cm2, respectively (corresponding o pressure levels of 972.8, 792.1, 684.8, 615.3, and 489.1 kPa peak-to-peak) whereby the maximum mechanical index was 0.77 (in the case 50 ms PD at 8 W/cm2 ISPPA). To allow visible dye infiltration, accounting for the smaller pores in the PVA foam, the overall sonication duration was extended to 15 minutes, and the process was repeated across the five different PD conditions (n=10 for each condition).
Image Acquisition/Analysis and Statistical Analysis
Upon completion of sonication, the foam/agar blocks were imaged with the sonicated surface down over a high-resolution flatbed photo scanner (Epson Perfection V600 Photo, Epson, Suwa, Japan) to measure the diameter of dye infiltration at the focal location. The blocks were then cut along the center of the acoustic focus and re-imaged on the inner sectional surfaces to measure the depth of infiltration (example shown in Fig. 3). Measurement analysis was conducted through ImageJ software (version 1.53i, https://imagej.nih.gov/ij/). The color image was split into red-green-blue channels and an 8-bit red-channel grayscale image (bit depth ranging from 0 to 255, inverted range) having a value ≥40 was used to visualize the area of dye infiltration. Kruskal-Wallis one-way analysis of variance (ANOVA) was performed to compare dye infiltration (in terms of depth and diameter) across the frequencies and PDs, followed by the Tukey honest significant difference (HSD) post-hoc test for multiple comparisons (MATLAB R2021b, MathWorks, Natick, MA, USA). In addition, a paired-sample permutation test was conducted to evaluate changes in bath temperature observed across experimental conditions (MATLAB R2021b; number of permutations=10,000).
Passive Cavitation Detection
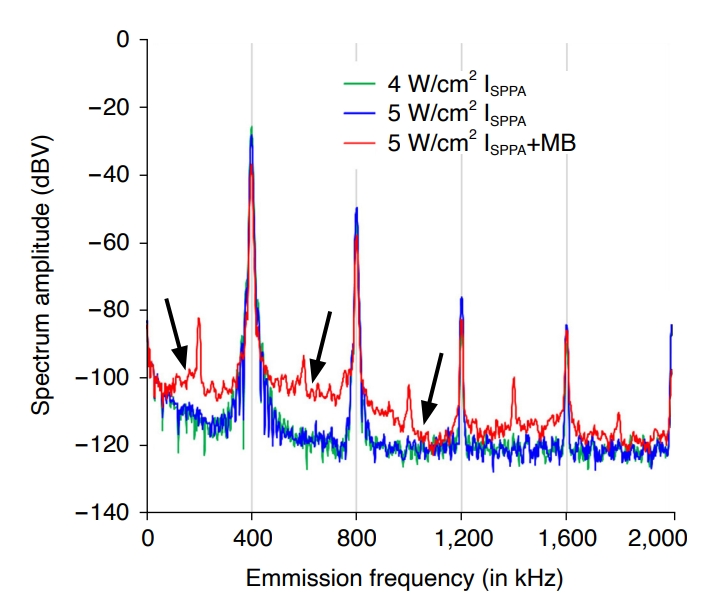
Despite the use of an extremely low acoustic intensity in the current experimental setting, the PBS-dye solution was not degassed and thus may have been susceptible to the possibility of cavitation. Therefore, acoustic emission detection (AED) was employed to detect the presence of cavitation that might have affected the dye infiltration during the application of FUS. To do so, a broadband ultrasound transducer (0.5 MHz, V318-SU, Olympus NDT, Waltham, MA, USA) was placed in the PBS bath (~10 ppm oxygen content, not degassed), 10 mm away toward the site of target focus, and continuous sonication (400 kHz) was applied at 4 and 5 W/cm2 ISPPA for ~3 s. The transducer served as an emission detector and the signals were recorded in a frequency spectrum (0-2 MHz range, with 1-kHz steps) and averaged (n=10 measurement). To induce cavitation at these low intensities, ultrasound microbubbles were added to the bath (0.1 µL/mL volume concentration; Definity, Lantheus, Billerica, MA, USA), and the emission spectra were separately recorded at 5 W/cm2 ISPPA.
Results
Frequency-Dependent Degree of Dye Infiltration into Melamine Foam
In the analysis of the dye infiltration diameter from sonication using an ISPPA of 3 W/cm2 (Fig. 4A), Kruskal-Wallis one-way analysis of variance (ANOVA) revealed a frequency-dependent difference (F(2,27)=47.6, P<0.001). The use of 400 kHz frequency condition induced a wider diameter of infiltration (17.4±1.0 mm; average±standard deviation, n=10) than 500 kHz and 600 kHz (12.2±4.9 mm and 2.6±3.2 mm, respectively; post-hoc Tukey HSD, all P<0.05) (Fig. 4A). The use of 500 kHz yielded a greater diameter than 600 kHz (post-hoc Tukey HSD, P<0.05) (Fig. 4A). A frequency-dependent difference was also found in terms of dye infiltration depth (F(2,27)=34.4, P<0.001) (Fig. 4B). Post-hoc comparisons showed that the depths of infiltration using frequencies of 400 and 500 kHz (8.5±0.5 mm and 6.4±2.8 mm, respectively) were significantly greater those when 600 kHz was used (2.1±1.0 mm; post-hoc Tukey HSD, P<0.03 following ANOVA), with the greatest depth observed with the 400 kHz condition.
The trials utilizing an ISPPA of 4 W/cm2 also resulted in a frequency-dependent difference in the dye infiltration diameter (ANOVA, F(2,27)=77.0, P<0.001) (Fig. 4C). Specifically, 400 kHz generated a wider diameter of infiltration (17.2±2.4 mm), than 500 kHz and 600 kHz (post-hoc Tukey HSD, all *P<0.05 (Fig. 4); 11.7±2.4 mm and 3.7±2.6 mm, respectively). The infiltration diameter from sonication using 500 kHz was significantly wider than that obtained using 600 kHz (post-hoc Tukey HSD, *P<0.05). There was also a frequency-dependent difference in the depth of dye infiltration (ANOVA; F(2,27)=108.6, P<0.001) (Fig. 4D). Pair-wise comparison after ANOVA revealed that the use of 400 kHz showed a significantly greater depth of infiltration (9.4±0.9 mm) than the use of 500 or 600 kHz (6.2±1.3 mm and 2.1±1.1 mm; post-hoc Tukey HSD, all P<0.001). When the infiltration depths and diameter were compared between the two intensities at each frequency, a greater infiltration depth was observed only at 400 kHz (two-tailed t-test, P<0.001; noted as *** in Fig. 4B and D).
Dye Infiltration into Agar Hydrogel Blocks
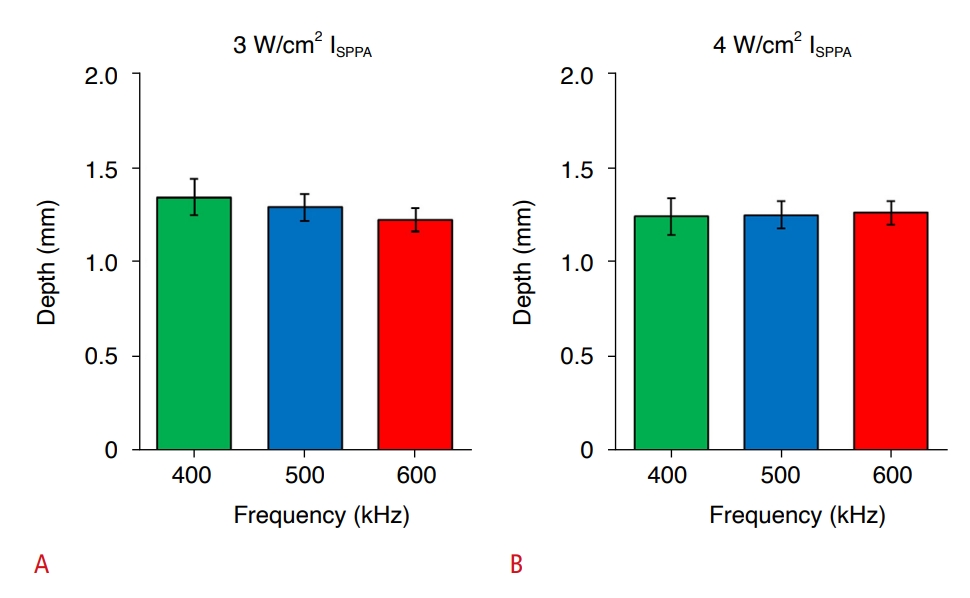
Lack of visible dye infiltration on the sonicated surfaces of the agar hydrogel blocks prevented any diameter measurements (an example shown in Fig. 3B). The infiltration depths in agar hydrogel blocks, resulting from intensities of 3 and 4 W/cm2, were much lower (all <1.5 mm) than those measured in melamine foam across the frequency range. ANOVA did not reveal a frequency-dependent difference in dye infiltration depth among any of the frequencies at both intensities (P>0.05; F-value, P-value) (Fig. 5).
PD-Dependent Dye Infiltration into Melamine and PVA Foams
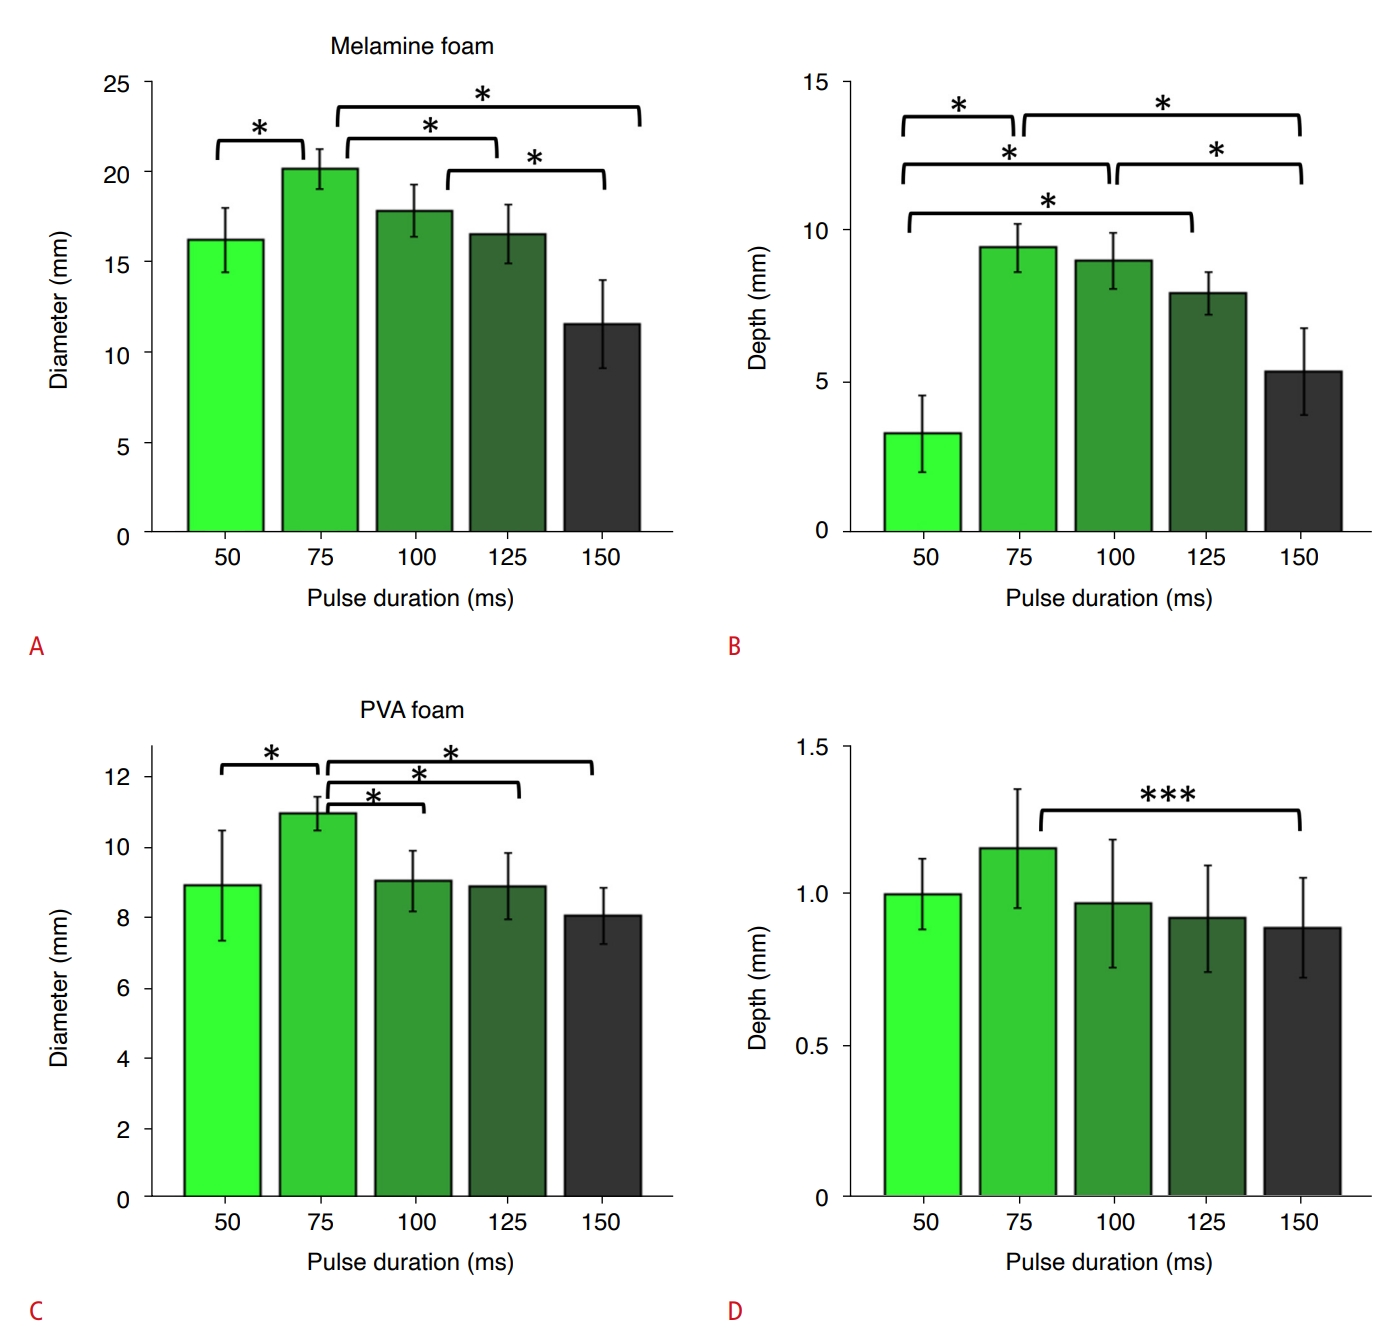
ANOVA revealed a PD-dependent difference upon analysis of the diameter of dye infiltration to melamine foam (F(4,45)=34.81, P<0.001) (Fig. 6A). A pair-wise comparison determined that a PD of 75 ms resulted in a significantly greater diameter (20.1±1.1 mm) than all other PDs except for the 100 ms condition, while a PD of 100 ms produced a greater infiltration diameter (17.8±1.4 mm) than 150 ms (11.5±2.5 mm, all P<0.05). In addition, PD-dependent differences were found in terms of the dye infiltration depth in the melamine foam (ANOVA, F(4,45)=38.93, P<0.001) (Fig. 6B). A pair-wise comparison among the PD conditions showed that PDs of 75 ms, 100 ms, and 125 ms (9.4±0.8 mm, 8.9±0.9 mm, and 7.9±0.7 mm, respectively) resulted in a greater infiltration depth than a PD of 50 ms (3.3±1.3 mm, post-hoc Tukey HSD, all P<0.05). The PD of 75 ms resulted in the greatest dye infiltration, with values greater than those observed with 150 ms (post-hoc Tukey HSD, P=0.001) (Fig. 6B).
When the experiment was repeated with PVA foam blocks, a PD-dependent difference in the diameter of dye infiltration was also observed (ANOVA, F(4,45)=24.40, P<0.001) (Fig. 6C). The 75 ms PD condition resulted in the highest infiltration diameter (10.9±0.2 mm) than all other PDs (post-hoc Tukey HSD, all P<0.05). Similarly, a PD-dependent difference was found in the infiltration depth (ANOVA; F(4,45)=10.20, P<0.001) (Fig. 6D). Pair-wise comparisons showed that a PD of 75 ms yielded greater infiltration depth (1.1±0.1 mm) with respect to 150 ms (0.9±0.1 mm; post-hoc Tukey HSD, P=0.040).
Temperature Measurement across the Different Experimental Conditions
The temperature of the TbO dye bath measured before and after the sonication sessions ranged from 23.0°C to 23.4°C throughout the experiment. No significant change in temperature was observed across the conditions (all P>0.05; n=10 for each group).
Passive Cavitation Detection
The amplitude of frequency spectra across the harmonics of fundamental frequency (multiples of 400 kHz) did not show differences in the tested acoustic intensities, suggesting the absence of cavitation (Fig. 7). The acoustic emission spectral power visibly increased in the 200-1,000 kHz range (marked with arrows) only after the microbubbles were added to intentionally increase the susceptibility for cavitation at 5 W/cm2 (red line, Fig. 7). This broadband emission spectra indicated the presence of inertial cavitation [40-42]. These results suggest that cavitation was not likely to have contributed to our observations.
Discussion
The emerging utility of non-invasive and non-thermal transcranial application of FUS is valued in the convective enhancement of drug delivery to the brain, as well as in brain waste clearance. The application of FUS to porous media in a pulsed manner is not only more efficient in transporting the solutes than continuous sonication [15,29], but may also provide an advantage in reducing the risks of thermal energy deposition. The limited range of the frequency/intensity of FUS for its safe transcranial applications, along with the understudied frequency/PD-dependent effects on advective solute transport by acoustic streaming, formed the background for the present study on phantoms that mimic the different porosities of brain tissue.
Dye motion parallel to sonication, rather than in a radial direction, approximates the impact from acoustic streaming. Based on an evaluation of the effects on TbO dye infiltration in the melamine foam at a fixed PD of 100 ms across the frequencies, the use of 400 kHz yielded the greatest depth and diameter of dye infiltration. The greatest diameter of the dye infiltration at 400 kHz was anticipated since the lowest frequency had the largest focal diameter associated with its longer wavelength. The observation of the greatest dye infiltration at 400 kHz agrees with generalized numerical framework by El Ghamrawy et al. [24], whereby the streaming velocity would increase at higher ultrasound frequencies mainly due to the higher acoustic attenuation of media (and generation of a greater pressure gradient). The reduced streaming efficiency at the higher frequencies than 400 kHz may be associated with the pressure threshold in creating quantifiable streaming, which increases with frequency [15,35]. Nonetheless, it is important to note that the scattering of acoustic waves from different inhomogeneities of phantom materials may also contribute to convective flow behavior [32,34], which may subsequently ramify into different degrees of advective solute motion. Assessment across much wider frequency bands is needed, as the frequency is likely to play an important role in acoustic streaming effects [36]. To completely rule out the contributions from unequal focal dimensions across the different frequencies, the implementation of a broadband transducer is desired in future studies.
When dye infiltration was compared between the two acoustic intensities across the frequencies, it was found that the use of 4 W/cm2 ISPPA yielded greater depths in the melamine foam than 3 W/cm2 at 400 kHz, which indicates that the acoustic streaming increased with the applied acoustic intensity. This observation is consistent with a numerical derivation of the positive correlation between streaming velocity and acoustic intensity [15], as well as an experiment examining the effects of acoustic streaming in macroporous polyacrylamide hydrogel [24]. The use of a higher acoustic intensity than the tested range (4 W/cm2 ISPPA) is expected to generate a greater level of dye infiltration due to stronger acoustic streaming; however, its detailed impact on solute transport efficiency in media with different porosities and geometry warrants further investigation. Particularly for later in vivo application to the brain, the intensity (and associated pressure level) should be carefully chosen to avoid damaging the underlying brain tissue.
While dye infiltration to the melamine foam was quantifiable, FUS did not have any impact on dye infiltration across all frequencies and intensities tested in the agar hydrogels. The agar gels have comparable porosity to that of cerebral neuropil [39], indicating that particle transport in dense media such as neuropil, in the absence of active solute transport (e.g., aquaporin-4 channel-mediated transport) [21], would be primarily governed by diffusion [37], thus unaffected by acoustic streaming.
The assessment of the effects of using different PDs on dye infiltration at a constant acoustic intensity (0.4 W/cm2 ISPTA) and frequency (400 kHz) for both melamine and PVA foams revealed that a PD of 75 ms, given at an ISPPA of 5.3 W/cm2, yielded the greatest dye infiltration depth and diameter. This finding was intriguing since the overall acoustic intensity deposition (i.e., ISPTA) and sonication geometry, including the focal dimension, were maintained across the conditions (thus, the dye infiltration would not be affected across the PD conditions according to theoretical derivation [15]). The use of a constant ISPTA was intended to exclude the potential contribution from heat deposition, as well as to limit the time-averaged acoustic energy, which is an important element for safety in biological applications. As to the cause for the existence of a specific PD that enhanced the greatest level of dye transport, a thermal contribution was ruled out, as the temperature of the bath did not change. Instead, it is hypothesized that both acoustic pressures (and ISPPA) and PDs resulted in nonlinear particle acceleration/deceleration in three-dimensional pore spaces, yielding different advective distance. Similar nonlinear effects of PD on streaming efficiency were shown by visualizing latex particle transport in an ultrasound fluidic resonator [15]. Although these results reflect the effects of different PDs on dye infiltration under a constant ISPTA, the contribution from PD can be further isolated by keeping both ISPPA and ISPTA constant. To achieve this goal, the pulse repetition frequency needs to be adjusted depending on the PD instead of using a fixed frequency 1 Hz, such as the use of a lower repetition frequency for PDs longer than 50 ms (e.g., a pulse repetition frequency of 0.5 Hz when using a PD of 100 ms).
To provide a clearer explanation of the observations, a high-speed video visualization of transient microparticles and assessment of their movement, including the velocity, should be adopted in future studies. An analytical derivation to explain all solute transport behavior would be extremely challenging, especially considering the complex boundary conditions imposed by the unknown microstructures of the porous media. To narrow the knowledge gap in understanding this seemingly nonlinear behavior in solute transport through porous media, sophisticated numerical simulation approaches can be adopted, such as Monte Carlo simulation or continuum mechanics [43,44] combined with realistic modeling of surface boundary conditions imposed by the porous structures. These important advancements are topics for further investigation.
The safety of FUS is paramount for clinical translation. The maximum ISPTA of 0.4 W/cm2 used in this study would not cause any tangible tissue temperature elevation [29]. The maximum mechanical index of sonication was 0.77, which is far lower than the regulatory limit of 1.9 for clinical ultrasound imaging [4], suggesting that the sonication used herein would not likely damage brain tissue in vivo. A potential contribution from cavitation, which may present in non-degassed (thus gas-containing) PBS, was ruled out based on the AED experiment in the present study (Fig. 7). However, in vivo monitoring of potential cavitation events is advised when stronger acoustic intensities are to be used, as the inertial cavitation may damage the sonicated biological tissue. It is also noted that FUS generated a much shorter infiltration depth in the PVA foam, corresponding to only 10%-20% of those measured in the melamine foams. An explanation for this finding is that the smaller pores in the PVA foams impeded the movement of the dyes. Based on this observation, a longer sonication time than 15 minutes would be needed in vivo to transport brain solutes for their drainage because the overall porosity of the brain is generally lower than that of the PVA foam. Further in vivo studies are needed to examine the minimum sonication time required for actual clearance of the various solutes from the brain, along with a detailed safety evaluation through animal models.
We found that a specific frequency (400 kHz) and PD (75 ms) of ultrasound maximized the dye infiltration depth into the tissue-mimicking porous media. Although the materials used in the present study may not fully replicate the complex physiology and cytoarchitecture of the brain, these findings lay the groundwork for further biological evaluations of acoustic streaming effects on non-invasive brain solute transport by transcranial FUS.


 Download Citation
 PDF Links
 PubReader
 ePub Link
 Full text via DOI


