

 Print
Print facebook
 twitter
 Linkedin
 google+

Introduction
Ischemic stroke is a leading cause of death worldwide, with carotid atherosclerotic plaques accounting for approximately 10%-20% of all ischemic strokes [1-3]. The dramatic changes in hemodynamics within the carotid artery are more pronounced in cases of severe stenosis, which increases biomechanical forces on the surface of plaques, potentially triggering their rupture [4,5]. Although the risk of plaque rupture and subsequent ipsilateral stroke also exists in patients with mild carotid stenosis, there has been less research on the role of peri-plaque biomechanical forces in these cases. Moreover, previous research, along with the authors’ recent study, has shown that the shape of carotid plaques is associated with their instability, due to the variable shear stress on the plaque surface [6,7]. Therefore, the relationship between carotid plaque shape, peri-plaque biomechanical forces, and stroke risk in patients with mild stenosis warrants further investigation.
Conventional color Doppler ultrasonography (US) and spectral Doppler US are dependent on the angle of insonation and are utilized to assess carotid blood flow and estimate axial velocity. However, they do not provide information on peri-plaque blood flow [8-10]. To address these limitations, a novel technique known as high-frame-rate vector flow (V Flow) imaging has been developed. This technique enables the visualization of true velocity vectors, streamline distribution, and vorticity distribution at any point within the blood flow [11]. Additionally, V Flow imaging facilitates a comprehensive analysis of hemodynamics and yields effective biomechanical parameters, such as wall shear stress (WSS), oscillatory shear index (OSI), and the turbulence index. These parameters can characterize the biomechanical properties surrounding the fibrous cap of a carotid plaque surface [12].
This study aimed to quantitatively evaluate biomechanical parameters in patients with a single carotid plaque and localized mild stenosis at the carotid bifurcation (CB). Additionally, it sought to investigate the differences in plaque shape and peri-plaque biomechanical parameters between patients with recent ipsilateral ischemic stroke and those without, using B-mode US and V Flow imaging. This research could offer new insights into the interpretation of local hemodynamic conditions associated with carotid plaques in cases of mild stenosis. The findings may provide noninvasive imaging biomarkers to assess the risk of carotid plaque rupture and subsequent ischemic stroke.
Materials and Methods
Compliance with Ethical Standards
The study received approval from the Ethics Committee of Shanghai General Hospital, Shanghai Jiao Tong University School of Medicine (approval number: 20240112111359313), and informed consent was obtained from all participants.
Study Population
This cross-sectional, cohort-comparison observational study enrolled 1,107 patients diagnosed with carotid plaques who underwent US and V Flow examination. Participants ranged in age from 40 to 94 years and were recruited between February 2023 and October 2023.
The inclusion criteria consisted of mild carotid artery stenosis (<50%) due to a single unilateral carotid plaque at the CB, as determined by the North American Symptomatic Carotid Endarterectomy Trial criteria for US [13,14]. The exclusion criteria were as follows: (1) the presence of multiple plaques or moderate to severe carotid stenosis; (2) poor image quality, such as that caused by severe plaque calcification (classified as type V according to the Gray-Weale-Nicolaides classification [15]); (3) plaques located at sites other than the CB; (4) a history of carotid artery stenting or carotid endarterectomy (CEA), or missing head computed tomography (CT) or magnetic resonance imaging (MRI) scans; (5) severe underlying diseases, or incomplete examination or clinical data.
All included patients were categorized as symptomatic or asymptomatic. The symptomatic group comprised patients who had experienced an ischemic stroke within the previous 30 days and were diagnosed with ipsilateral ischemic lesions in the carotid territory (anterior circulation) as evidenced by head CT or MRI images, after excluding other thromboembolic sources such as vasculitis, atrial fibrillation, or intracranial factors [16-18]. The asymptomatic group included patients who had no neurological symptoms, no history of stroke, and no intracranial lesions on head CT or MRI images.
Clinical Characteristics, B-Mode US, and V Flow Parameters
The following variables were collected: (1) demographic information such as age, sex, and body mass index; (2) blood indices, including total cholesterol, triglycerides (TG), and uric acid (UA); (3) medical history (hypertension, diabetes mellitus, and hyperlipidemia); (4) history of medication use, including statins, antihypertensive drugs, and antidiabetic drugs; (5) personal habits (smoking and drinking histories); (6) B-mode US parameters, which included plaque echogenicity, plaque length and thickness, as well as plaque shape (categorized as type I, II, or III); (7) vascular flow parameters, including WSS, OSI, and the turbulence index.
B-Mode US and V Flow Imaging Protocol
All standard B-mode US and V Flow imaging was conducted using a Mindray Resona R9 US system (Shenzhen Mindray Bio-Medical Electronic Co., Ltd., Shenzhen, China) equipped with a linear array transducer (3-11 MHz). Radiologists, each with over 5 years of experience in carotid US, were blinded to the patients' head CT or MRI results.
The longitudinal and transverse planes of both sides of the carotid arteries were scanned on B-mode US from the initial segment of the common carotid arteries to the CB, then to the internal and external carotid artery. The location, size, and shape of each plaque were observed and recorded.
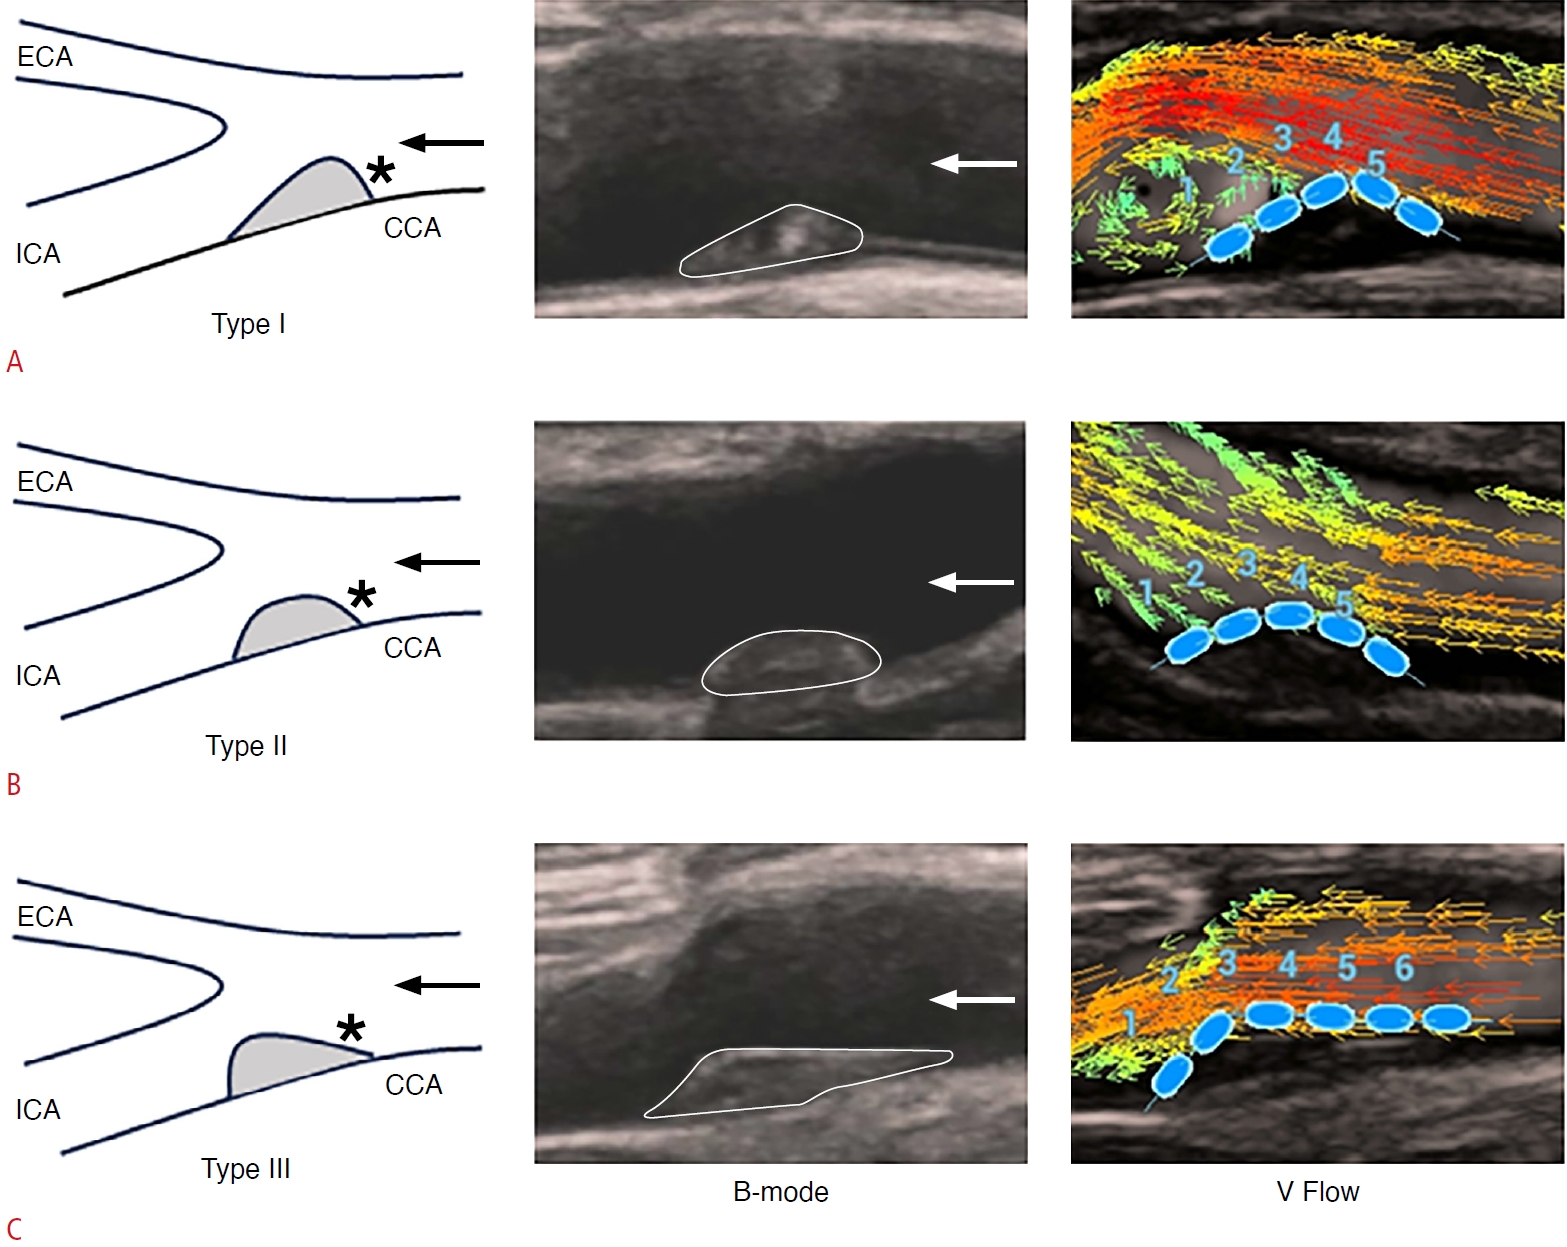
The V Flow imaging settings were as follows: arrow life cycle, 25 ms; frequency, 5.0 MHz; depth, 2-4 cm; arrow density, 10%. Patients were instructed to maintain calm breathing and a steady heartbeat during the examination. Videos of the carotid arteries on both sides were captured for further analysis. The V Flow images displayed the distributions of blood flow velocity vectors, streamlines, and vortices. In these images, the direction, velocity, and strength of the blood flow were indicated by the direction of the arrows, their color, and length, respectively (Figs. 1, 2) [19].
Two independent radiologists were involved in the blinded evaluation of the inter-observer consistency of V Flow measurements based on 30 randomly selected patients. To evaluate intra-observer consistency, a single radiologist reanalyzed the data of 30 random patients after an interval of 1 month, blinded to the initial results.
Shape Classification of Carotid Plaques
The shapes of carotid plaques were evaluated using B-mode US and categorized based on their symmetry in the longitudinal direction as type I (the downstream surface of the plaque is positioned above the point of maximum plaque thickness and possesses a greater arc-length than the upstream surface), type II (the arc-lengths of the downstream and upstream surfaces of the plaque are equal, with a tolerance of no less than 1 mm), and type III (the upstream portion of the plaque is situated below the point of maximum plaque thickness and has a greater arc-length than the downstream surface) (Fig. 1) [6]. The arc-length was determined by measuring the distance from the downstream or upstream endpoint of the plaque to the point of maximum plaque thickness.
V Flow Image Analysis
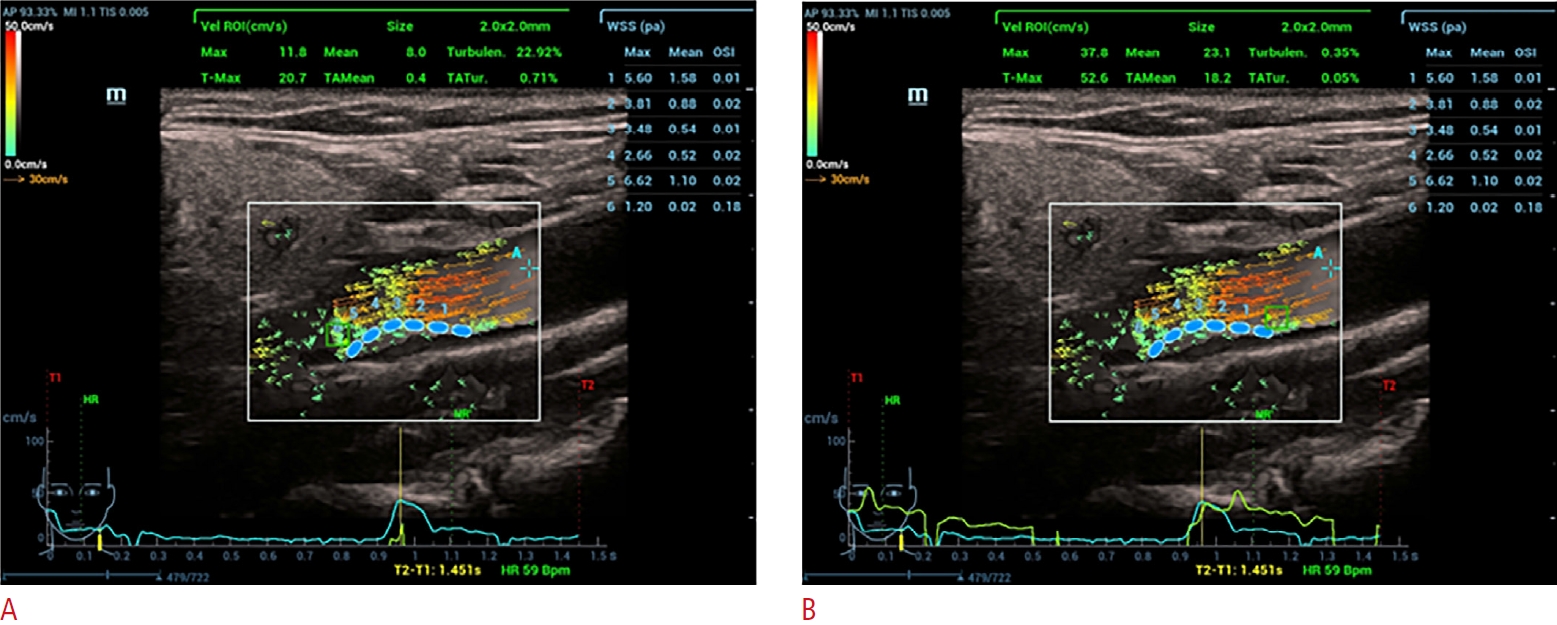
A typical image of a carotid plaque, corresponding to the systolic peak, was selected from the V Flow video. Measurements using V Flow were then conducted using this image.
The measurement points (blue dots with a 2 mm diameter) were placed along the plaque surface at the CB to obtain WSS and OSI values (Fig. 2). The turbulence index was derived from the region of interest by placing the measuring box (2×2 mm) on the upstream and downstream surfaces of the plaques (green square in Fig. 2) [20].
Statistical Analysis
Statistical analysis was performed using SPSS Statistics for Windows, version 26.0 (IBM Corp., Armonk, NY, USA). Categorical data were reported as frequencies (percentages) and analyzed using the Pearson chi-square test or the Fisher exact test as appropriate. Continuous data following a normal distribution were expressed as means±standard deviations and analyzed with the independent-samples t-test. Non-normally distributed data were presented as medians (interquartile ranges) and evaluated using the non-parametric rank sum test. To adjust for multiple comparisons among plaque types, the Bonferroni correction was applied. Multivariable logistic regression models were utilized to investigate the associations between plaque morphology, V Flow parameters, and the occurrence of ischemic stroke. The corresponding odds ratios and their 95% confidence intervals were calculated. The Kendall W coefficient of concordance was employed to measure intra-and inter-observer reliability, with a W ≥0.7 indicating a strong correlation. A P-value of less than 0.05 was considered statistically significant.
Results
Clinical Characteristics of Patients with Mild Stenosis
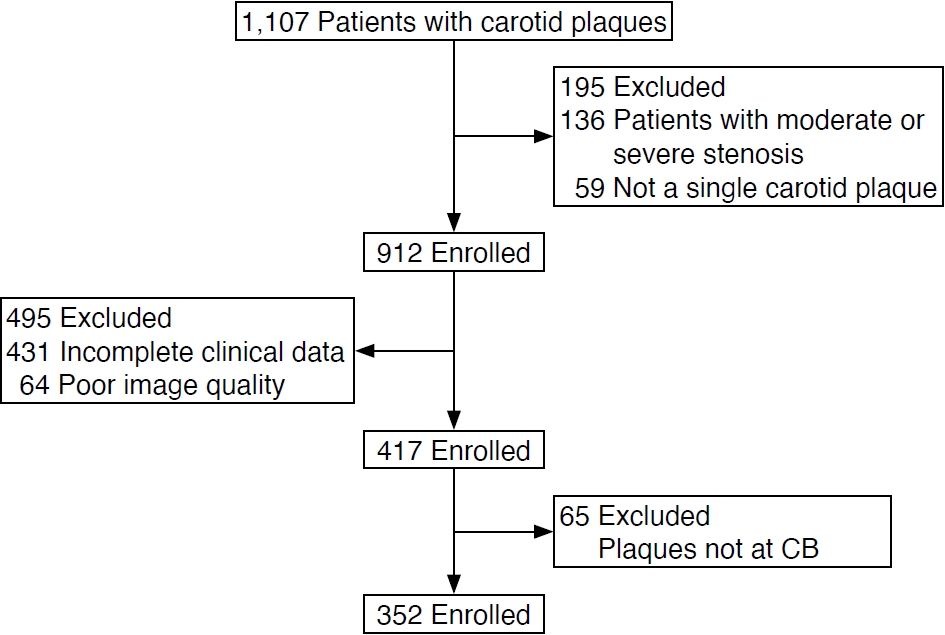
Among the 1,107 patients who underwent V Flow examination, 755 were excluded for various reasons: moderate or severe stenosis (n=136), absence of carotid plaques (n=59), incomplete clinical data (n=431), poor image quality (n=64), and plaques not located at the CB (n=65). Therefore, 352 patients were included in the study (Fig. 3), with 228 (64.8%) being male (Table 1). As shown in Table 1, these patients were categorized as symptomatic (n=170) or asymptomatic (n=182). The symptomatic group tended to be older and had higher levels of TG and UA, as well as a higher prevalence of diabetes mellitus and a history of antidiabetic medication use, compared to the asymptomatic group (all P<0.05).
B-Mode US and V Flow Parameters at the CB in Patients with Mild Stenosis
The B-mode US and V Flow parameters of carotid plaques at the CB were compared between symptomatic and asymptomatic patients (Table 2). The plaque length and thickness of the symptomatic group were greater (P<0.05). Interestingly, type Ⅲ plaques accounted for 56.1% of the symptomatic group. In both groups, significant differences were observed between the prevalence of type Ⅱ and type Ⅲ plaques (P=0.016), as well as between type I and type Ⅱ plaques (P<0.001). However, there were no significant differences between type I and type Ⅲ plaques in both groups (P=0.081).
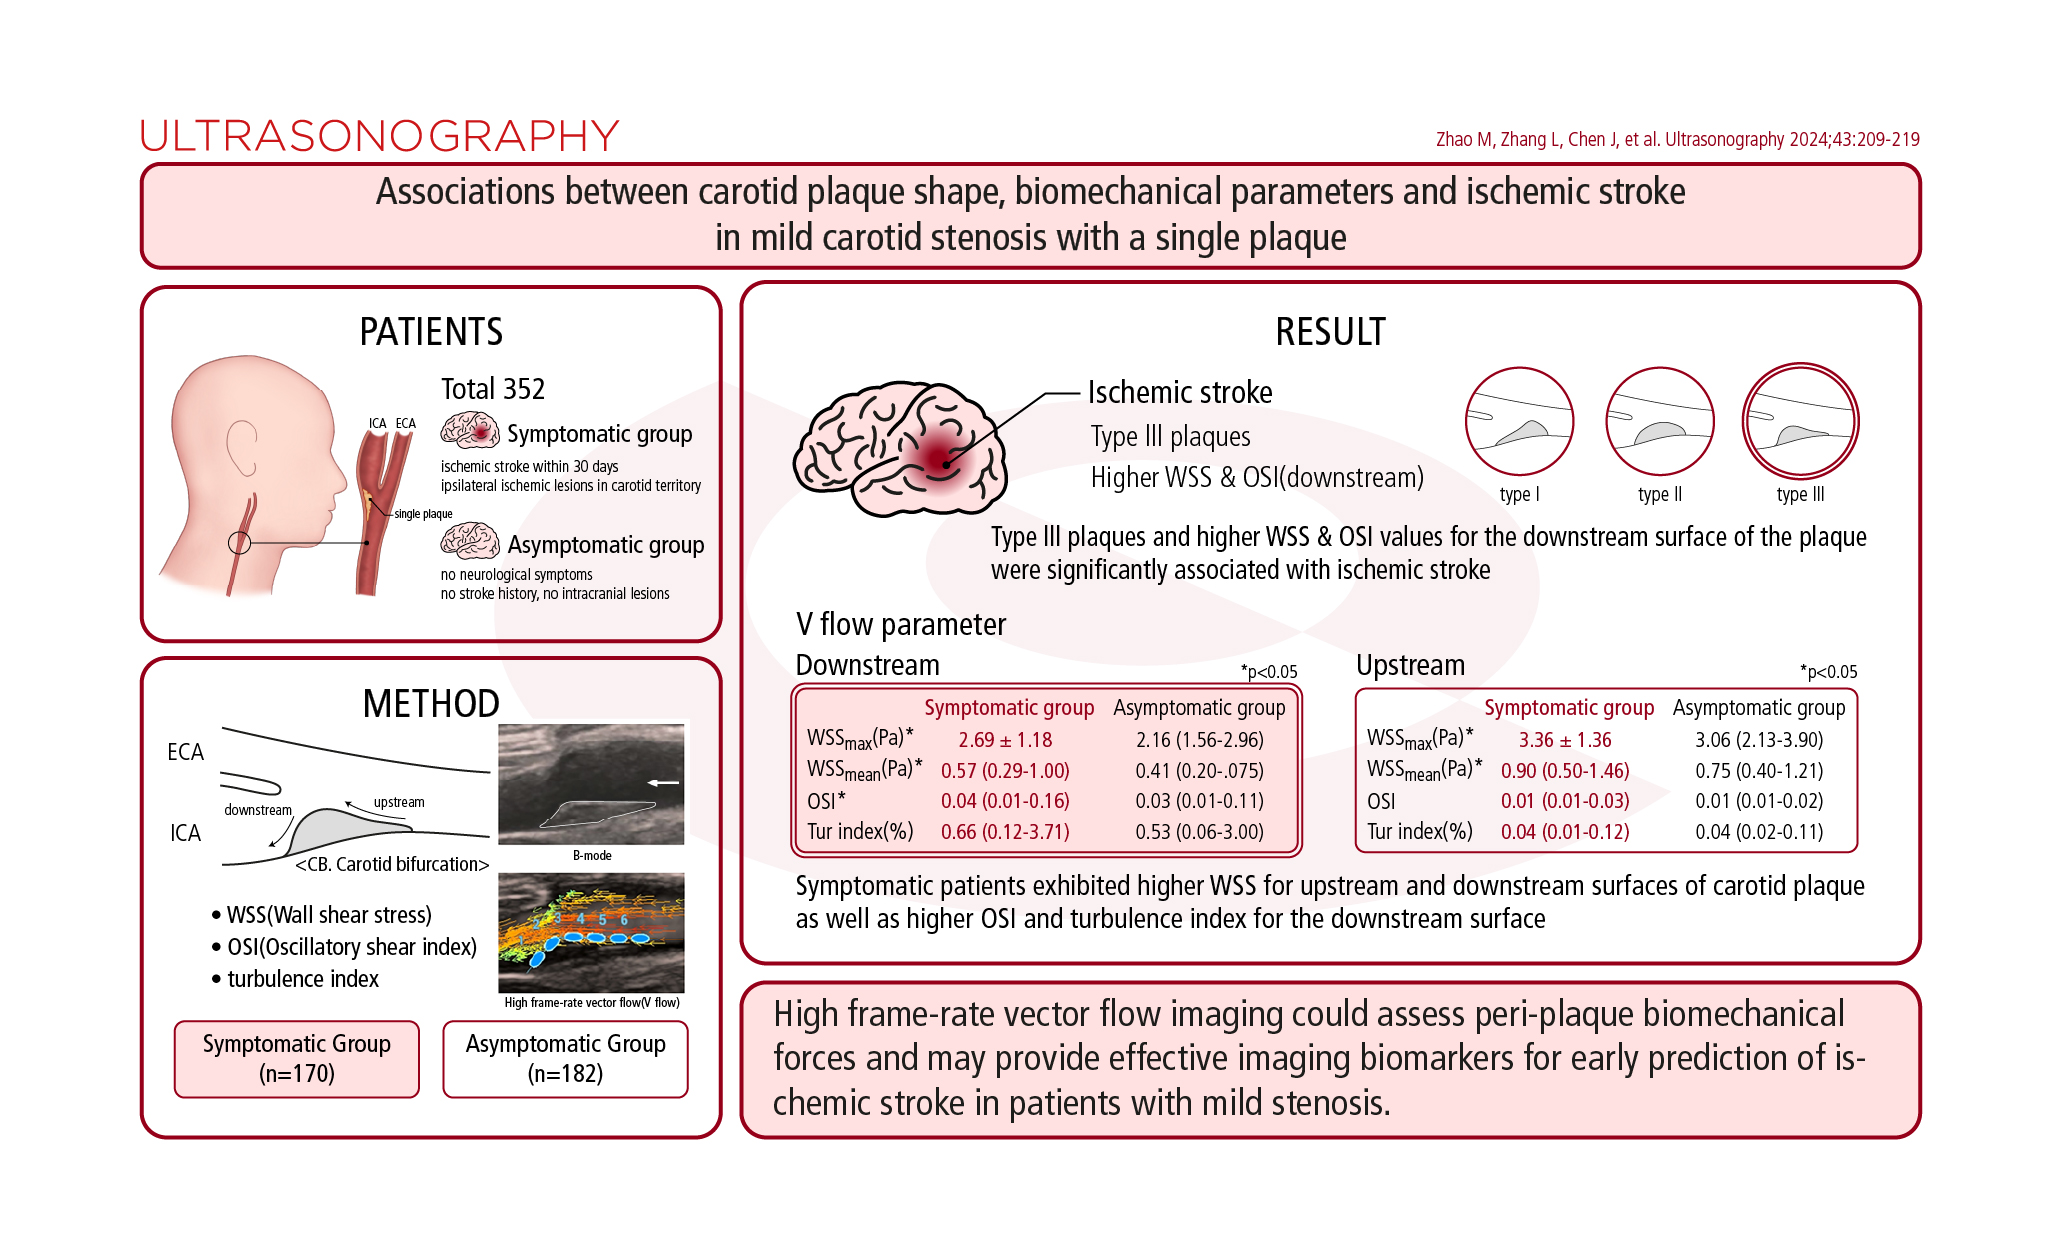
To understand the variations in peri-plaque biomechanical forces, the V Flow parameters on both the downstream and upstream surfaces of the plaques were compared between the two groups, as shown in Table 2. In the symptomatic group, higher values of WSS (both maximum and mean WSS) were observed on the upstream and downstream surfaces of the plaques (all P<0.05). Additionally, the OSI value for the downstream surface was significantly higher in this group (P<0.05). However, there were no statistically significant differences in the turbulence index for either the downstream or upstream surfaces of the plaques, nor in the OSI values for the upstream surface between the two groups (P>0.05).
As shown in Table 3, the WSS values were higher for the upstream surface than for the downstream surface in both the symptomatic and asymptomatic groups (P<0.001). However, the values of OSI and the turbulence index were higher for the downstream surface than for the upstream surface (P<0.001).
Associations of Plaque Shape and V Flow Parameters in Patients with Mild Stenosis and a History of Ischemic Stroke
Multivariable analyses indicated that the type III shape, along with WSS and OSI values for the downstream surface, were significantly associated with ischemic stroke in patients with mild stenosis (model 1, Table 4). This association persisted even after adjusting for clinical factors, including age, TG, UA, and a medical history of hypertension, diabetes mellitus, and hyperlipidemia, as well as additional adjustments for plaque burden (plaque length and thickness). The type III shape, WSS, and OSI values for the downstream surface continued to show a significant relationship with ischemic stroke in patients with mild stenosis in both model 2 and model 3 (Table 4).
V Flow Parameters of Plaques with Different Shapes
Table 5 presents significant differences in the V Flow parameters of plaques with various shapes, irrespective of whether they were associated with symptomatic or asymptomatic histories. Additionally, the mean and maximum WSS values, along with the OSI and turbulence index values for the downstream surface of type III plaques, were higher than those for type I and II plaques (all P<0.05). However, the distribution of V Flow parameters for the upstream surface did not show statistically significant differences among the three plaque shapes (all P>0.05).
Intra- and Inter-Observer Consistency
The evaluation of V Flow imaging demonstrated excellent agreement. The Kendall's W coefficient of concordance for intra- and inter-observer variability was 0.754-0.943 (all P<0.05) and 0.738-0.819 (all P<0.05), respectively (Table 6).
Discussion
The results of this study contribute to the growing body of evidence suggesting that noninvasive assessment of biomechanical parameters of carotid plaque may be useful in predicting plaque instability and the risk of stroke. The primary finding was that a type III shape of the carotid plaque, along with higher values of WSS and OSI on the downstream surface of the plaque, were significantly associated with ischemic stroke in cases of mild stenosis. This association held true even after adjusting for traditional stroke risk factors (age, the medical history of hypertension, diabetes mellitus, and hyperlipemia), significant biomedical markers (TG, UA), and the carotid plaque length and thickness (representing the single plaque burden), indicating that the plaque shape and peri-plaque biomechanical features are valuable for assessing carotid plaque instability and stroke risk.
In the present study, the symptomatic group exhibited higher blood TG and UA levels, along with a more common history of diabetes mellitus, consistent with previous reports. These findings suggest an exacerbation of lipid metabolism disorders and inflammation in the carotid artery [21-23]. Additionally, the symptomatic group had thicker and longer carotid plaques, indicating a higher plaque burden in symptomatic patients with mild stenosis. However, there were no significant differences in the medical history of hypertension and hyperlipidemia between the two groups, likely due to the use of statins and antihypertensive medications. Hypertension is recognized as a risk factor for ischemic stroke because it can increase carotid wall volume or contribute to plaque instability, as evidenced by the presence of macrophages, lipid core, microvessels, and intraplaque hemorrhage in histopathological examinations following CEA [24]. Notably, this study included patients with mild stenosis, unlike previous studies that focused on patients with more than 60% or 70% carotid stenosis [24], which may explain the lack of significant difference in hypertension. Conversely, diabetes mellitus is associated with the development of vulnerable plaques regardless of the degree of carotid stenosis [25], and the present study also found that diabetes mellitus significantly contributed to ischemic stroke in cases of mild carotid stenosis. Furthermore, the higher prevalence of glucose-lowering treatment in the symptomatic group may indicate a more severe condition of diabetes mellitus.
Atherosclerotic plaques typically develop in regions where laminar flow is unstable, such as the CB and at bends in vessels [26,27]. In this study, a high prevalence of carotid plaques was observed at the CB. This finding aligns with previous research, suggesting that the presence of unfavorable pressure gradients and a marked reduction in flow velocity contribute to increased flow instability at these sites [28,29]. V Flow imaging overcomes the shortcomings of conventional US imaging by employing multidirectional transmission and reception. This approach allows for the calculation of the velocity vector through angular synthesis [19]. Utilizing V Flow imaging, it is possible to measure various hemodynamic parameters, including WSS, turbulence index, and OSI, among others.
WSS is the shear force exerted by flowing blood on the vessel wall surface. It is influenced by blood flow and viscosity [30,31]. Typically, deviations from normal WSS values, either higher or lower, are indicative of unstable flow conditions [29]. Prior research has indicated that symptomatic patients exhibit higher WSS values compared to their asymptomatic counterparts, a phenomenon linked to the differential activation of biological processes within the plaque [32,33]. Similarly, this study found that WSS values on both the upstream and downstream surfaces of plaques in mild carotid stenosis were elevated in the symptomatic group relative to the asymptomatic group. These results suggest that increased WSS values may be a biomechanical factor contributing to the instability of carotid plaques in cases of mild carotid stenosis.
A previous study found that plaque rupture was more likely to occur at upstream sites exposed to high WSS values [32]. In this study, the WSS values on the upstream plaque surface were higher than those on the downstream surface in both groups. Notably, type III plaques in both groups exhibited significantly higher WSS values on the upstream plaque surface than type I and type II plaques. This suggests that WSS values beneath the plaque surface are associated with plaque morphology, and that blood flow is more disturbed at the upstream surface of type III plaques due to the steeper gradient and shorter arc length of the upstream surface. Furthermore, type III plaques were more common in the symptomatic group, indicating that plaque shape may influence the surrounding mechanical forces and consequently affect plaque stability.
The OSI quantifies the extent to which the direction of fluid WSS deviates cyclically from the primary flow direction during a cardiac cycle [34]. A higher OSI value indicates more pronounced oscillations in fluid WSS in response to arterial flow, which in turn increases the instability of plaque forces and the risk of plaque rupture [35]. The symptomatic group exhibited a higher OSI value on the downstream plaque surface than the asymptomatic group; however, no statistical difference was observed on the upstream surface between the two groups. This may be attributed to multiple recirculation vortices that occur due to the high velocity of blood flow near the downstream surface of the carotid plaque [32]. Furthermore, type III plaques demonstrated a higher OSI value on the downstream plaque surface compared to the other two plaque types, further indicating the instability of type III plaques. This finding aligns with the results of the authors’ previous study [7].
The turbulence index quantifies the degree of blood flow turbulence, with values ranging from 0 to 1 (equivalent to 0%-100%). These values represent a spectrum from complete laminar flow to increased flow complexity [36,37]. In this study, the turbulence index was higher on the downstream plaque surface than on the upstream surface in all plaques in both groups. This finding suggests that the downstream plaque surface is subject to oscillating shear stress and a complex hemodynamic environment. Additionally, type III plaques exhibited a higher turbulence index on the downstream surface than the other two plaque types. However, no significant difference was noted between symptomatic and asymptomatic patients for either the upstream or downstream plaque surfaces, which may be attributable to the presence of only mild carotid stenosis.
Thin fibrous caps and plaque shoulders under increased mechanical stress are regions at the highest risk of rupture [38]. This study is the first to measure biomechanical forces on the surface of a plaque, revealing higher WSS on the upstream surface and more intense blood flow oscillations on the downstream surface in cases of mild stenosis. However, WSS values for the upstream surface of the plaque were not significantly associated with ischemic stroke in multivariable analyses, which contradicts findings from a previous study that identified upstream sites as prone to plaque rupture in cases of greater than 70% stenosis [32]. It is hypothesized that blood flow on the upstream surface of carotid plaque in mild stenosis is not as disturbed as it is in severe stenosis, as observed in the previous study. Further investigation is required to understand the extrinsic stress and the corresponding mechanisms involved.
This study has some limitations. First, it was conducted at a single center; therefore, multi-center studies with larger sample sizes are necessary to validate the findings. Second, V Flow imaging is subject to inter-personal variability due to its reliance on visual interpretation [20]. Future research should aim to develop methods that enable a more precise analysis of three-dimensional blood flow characteristics while minimizing manual interpretation. Third, this study excluded carotid plaques with severe calcification to ensure high-quality V Flow imaging. The hemodynamic changes surrounding these plaques in cases of mild stenosis with a hard texture require further investigation. Lastly, this study provides a cross-sectional comparison rather than a longitudinal one, which limits the ability to predict the likelihood of symptomatic plaque progression over time. In subsequent research, the authors plan to conduct a prospective study to assess the influence of plaque morphology and biomechanical parameters on the risk of ischemic stroke.
In conclusion, this study demonstrated that high-frame-rate V Flow imaging can serve as a noninvasive diagnostic tool for the quantitative assessment of biomechanical properties in carotid atherosclerotic plaques with mild stenosis. The type III shape of carotid plaque and higher WSS and OSI values on the downstream surface of the plaque showed significant associations with ischemic stroke in patients with mild stenosis. These findings suggest that these features may be potential imaging biomarkers for plaque instability and stroke risk in patients with mild stenosis.
 Download Citation
 PDF Links
 PubReader
 ePub Link
 Full text via DOI


